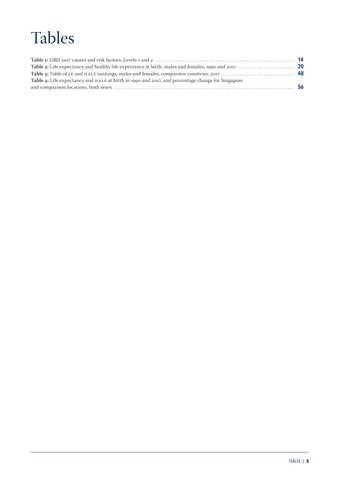
Tables Table 1: GBD 2017 causes and risk factors, Levels 1 and 2. . . . . . . . . . . . . . . . . . . . . . . . . . . . . . . . . . . . . . . . . . . . . . . . . . . . . . . . . . . . Table 2: Life expectancy and healthy life expectancy at birth, males and females, 1990 and 2017. . . . . . . . . . . . . . . . . . . . . . . . . Table 3: Table of LE and HALE rankings, males and females, comparator countries, 2017. . . . . . . . . . . . . . . . . . . . . . . . . . . . . . . . Table 4: Life expectancy and HALE at birth in 1990 and 2017, and percentage change for Singapore and comparison locations, both sexes . . . . . . . . . . . . . . . . . . . . . . . . . . . . . . . . . . . . . . . . . . . . . . . . . . . . . . . . . . . . . . . . . . . . . . . . . . . . .
14 20 48 56
Tables | 5
