Volume 16, Issue 1
73
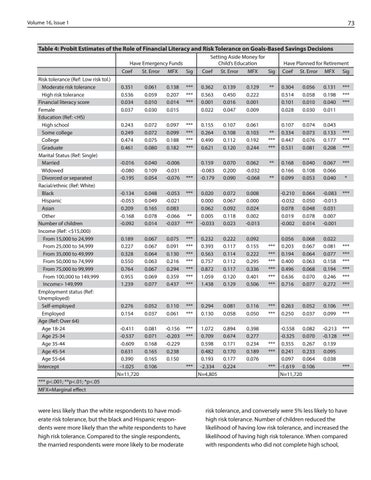
Table 4: Probit Estimates of the Role of Financial Literacy and Risk Tolerance on Goals-Based Savings Decisions
Risk tolerance (Ref: Low risk tol.) Moderate risk tolerance High risk tolerance Financial literacy score Female Education (Ref: <HS) High school Some college College Graduate Marital Status (Ref: Single) Married Widowed Divorced or separated Racial/ethnic (Ref: White) Black Hispanic Asian Other Number of children Income (Ref: <$15,000) From 15,000 to 24,999 From 25,000 to 34,999 From 35,000 to 49,999 From 50,000 to 74,999 From 75,000 to 99,999 From 100,000 to 149,999 Income> 149,999 Employment status (Ref: Unemployed) Self-employed Employed Age (Ref: Over 64) Age 18-24 Age 25-34 Age 35-44 Age 45-54 Age 55-64 Intercept
Have Emergency Funds Coef St. Error MFX Sig
Setting Aside Money for Childâ&#x20AC;&#x2122;s Education Coef St. Error MFX Sig
Have Planned for Retirement Coef St. Error MFX Sig
0.351 0.536 0.034 0.037
0.061 0.059 0.010 0.030
0.138 0.207 0.014 0.015
*** *** ***
0.362 0.563 0.001 0.022
0.139 0.450 0.016 0.047
0.129 0.222 0.001 0.009
0.304 0.514 0.101 0.028
0.056 0.058 0.010 0.030
0.131 0.198 0.040 0.011
0.243 0.249 0.474 0.461
0.072 0.072 0.075 0.080
0.097 0.099 0.188 0.182
*** *** *** ***
0.155 0.264 0.490 0.621
0.107 0.108 0.112 0.120
0.061 0.103 0.192 0.244
0.107 0.334 0.447 0.531
0.074 0.073 0.076 0.081
0.043 0.133 0.177 0.208
-0.016 -0.080 -0.195
0.040 0.109 0.054
-0.006 -0.031 -0.076
0.070 0.200 0.090
0.062 -0.032 -0.068
0.168 0.166 0.099
0.040 0.108 0.053
0.067 0.066 0.040
***
***
0.159 -0.083 -0.179
-0.134 -0.053 0.209 -0.168 -0.092
0.048 0.049 0.165 0.078 0.014
-0.053 -0.021 0.083 -0.066 -0.037
***
0.072 0.067 0.092 0.118 0.023
0.008 0.000 0.024 0.002 -0.013
-0.210 -0.032 0.078 0.019 -0.002
0.064 0.050 0.048 0.078 0.014
-0.083 -0.013 0.031 0.007 -0.001
***
** ***
0.020 0.000 0.062 0.005 -0.033
0.189 0.227 0.328 0.550 0.764 0.955 1.239
0.067 0.067 0.064 0.063 0.067 0.069 0.077
0.075 0.091 0.130 0.216 0.294 0.359 0.437
*** *** *** *** *** *** ***
0.232 0.393 0.563 0.757 0.872 1.059 1.438
0.222 0.117 0.114 0.112 0.117 0.120 0.129
0.092 0.155 0.222 0.295 0.336 0.401 0.506
*** *** *** *** *** ***
0.056 0.203 0.194 0.400 0.496 0.636 0.716
0.068 0.067 0.064 0.063 0.068 0.070 0.077
0.022 0.081 0.077 0.158 0.194 0.246 0.272
*** *** *** *** *** ***
0.276 0.154
0.052 0.037
0.110 0.061
*** ***
0.294 0.130
0.081 0.058
0.116 0.050
*** ***
0.263 0.250
0.052 0.037
0.106 0.099
*** ***
-0.411 -0.537 -0.609 0.631 0.390 -1.025 N=11,720
0.081 0.071 0.168 0.165 0.165 0.106
-0.156 -0.203 -0.229 0.238 0.150
*** ***
0.894 0.674 0.171 0.170 0.177 0.224
0.398 0.277 0.234 0.189 0.076
-0.558 0.082 -0.325 0.070 *** 0.355 0.267 *** 0.241 0.233 0.097 0.064 *** -1.619 0.106 N=11,720
-0.213 -0.128 0.139 0.095 0.038
*** ***
1.072 0.709 0.598 0.482 0.193 *** -2.334 N=4,805
**
** *** *** ** **
*** *** ***
*** *** ***
*
***
*** p<.001; **p<.01; *p<.05 MFX=Marginal effect
were less likely than the white respondents to have moderate risk tolerance, but the black and Hispanic respondents were more likely than the white respondents to have high risk tolerance. Compared to the single respondents, the married respondents were more likely to be moderate
risk tolerance, and conversely were 5% less likely to have high risk tolerance. Number of children reduced the likelihood of having low risk tolerance, and increased the likelihood of having high risk tolerance. When compared with respondents who did not complete high school,