
V.32 APRIL 2023 VOLUME THIRTY-THREE 2023 Spring Issue H ydro V isions o fficial P ublication of t H e G roundwater r esources a ssociation

HYDROVISIONS is the official publication of the Groundwater Resources Association of California (GRA).
GRA’s mailing address is 808 R Street. Suite 209, Sacramento, CA 95811. Any questions or comments concerning this publication should be directed to the newsletter editor at hydrovisions@grac.org
The Groundwater Resources Association of California is dedicated to resource management that protects and improves groundwater supply and quality through education and technical leadership.
EDITOR
Rodney Fricke hydrovisions@grac.org
EDITORIAL LAYOUT
Smith Moore & Associates
EXECUTIVE OFFICERS
PRESIDENT
R.T. Van Valer
Roscoe Moss Company
Tel: 323-263-4111
VICE PRESIDENT
Christy Kennedy
Woodard & Curran
Tel: 925-627-4122
SECRETARY
Erik Cadaret
West Yost
Tel: 530-756-5905
TREASURER
Rodney Fricke
GEI Consultants
Tel: 916-631-4500
DIVERSITY, EQUITY AND INCLUSION OFFICER
Marina Deligiannis
Lake County Water Resources
Tel: 707-263-2213
HIMMEDIATE PAST PRESIDENT
Abigail Madrone
West Yost Associates
Tel: 530-756-5905
ADMINISTRATIVE DIRECTOR
David Garrison
Groundwater Resources Association of California
dgarrison@grac.org
Jena Acos
Brownstein Hyatt Farber Schrek
Tel: 805-882-1427
Murray Einarson
Haley & Aldritch, Inc.
Tel: 530-752-1130
Yue Rong
Los Angeles Regional Water Quality Control
Tel: 213-576-6710
Abhishek Singh
INTERA
Tel: 217-721-0301
Clayton Sorensen
Balance Hydrologics, Inc.
Tel: 510-704-1000 x206
John Xiong
Haley & Aldritch, Inc.
Tel: 530-752-1130
Roohi Toosi
APEX Environmental & Water Resources
Tel: 949-491-3049
Moises Santillan
Water Replenishment District
562-275-4279
To contact any GRA Officer or Director by email, go to www.grac.org/board-of-directors
The statements and opinions expressed in GRA’s HydroVisions and other publications are those of the authors and/or contributors, and are not necessarily those of the GRA, its Board of Directors, or its members. Further, GRA makes no claims, promises, or guarantees about the absolute accuracy, completeness, or adequacy of the contents of this publication and expressly disclaims liability for errors and omissions in the contents. No warranty of any kind, implied or expressed, or statutory, is given with respect to the contents of this publication or its references to other resources. Reference in this publication to any specific commercial products, processes, or services, or the use of any trade, firm, or corporation name is for the information and convenience of the public, and does not constitute endorsement, recommendation, or favoring by the GRA, its Board of Directors, or its members.


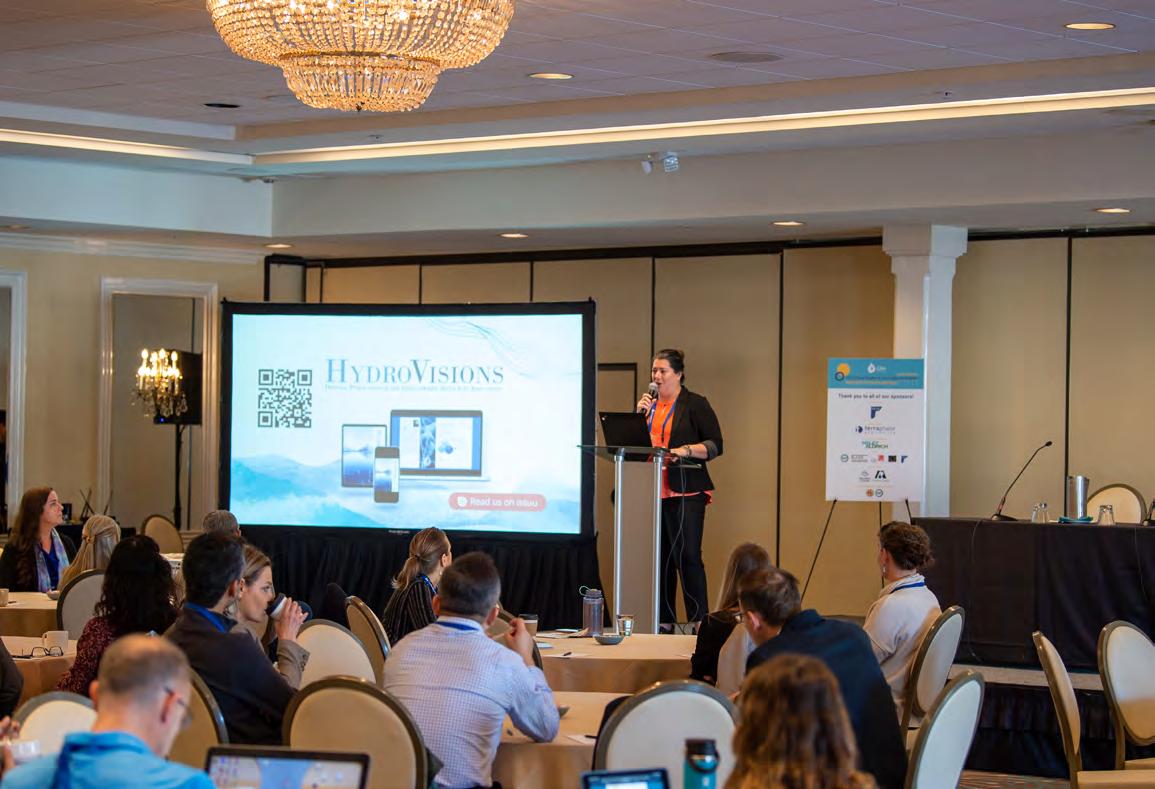
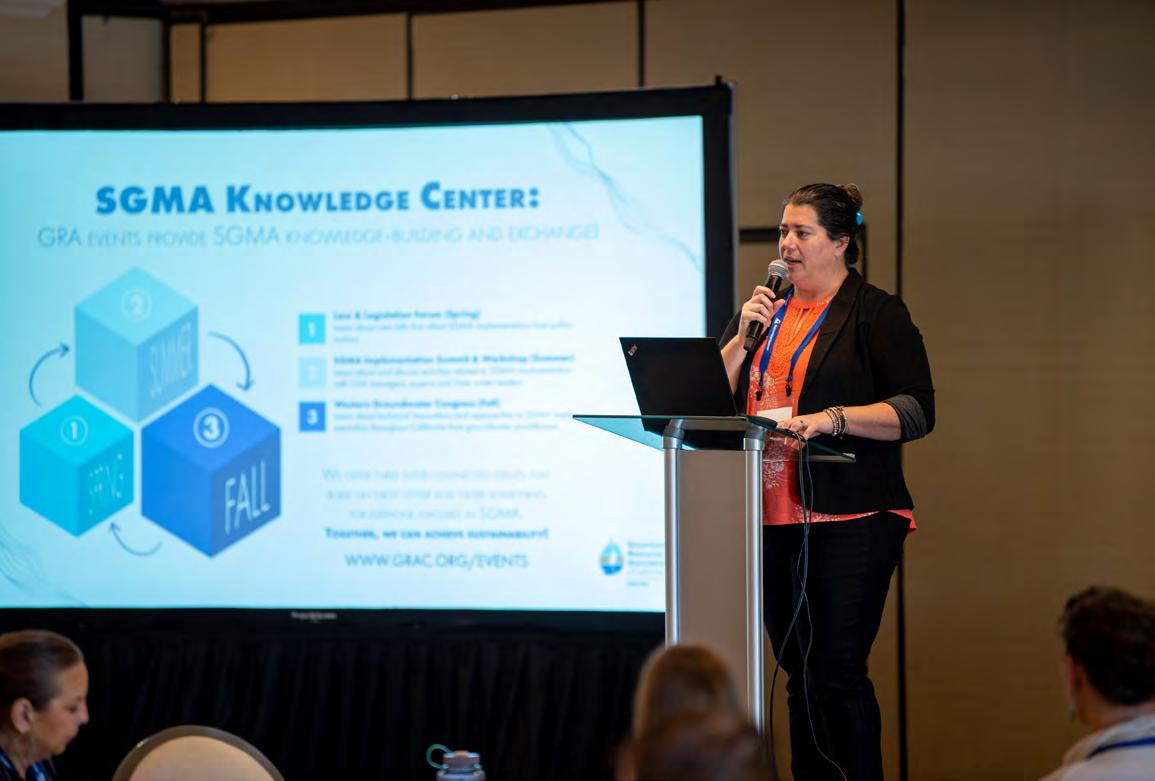
What an eventful first quarter! GRA has hosted 10 Branch meetings, two GRACasts, the incredible ESG Climate Resilient & Sustainable Remediation Symposium, and has participated with DWR in their kick off of National Groundwater Awareness Week. We also continue to design our SGMA Implementation Summit and Workshop, as well as our Western Groundwater Congress. Team GRA has been working hard all while we have been experiencing this wild weather across California and our neighboring Western States.
Despite the fact large amounts of rain have led to mudslides (one next door to me in La Cañada), downed trees, travel delays and loss of power for days, we have desperately needed this rainfall. With the record snowfall in California, my hope is we can ease into spring conditions allowing the snowpack to gradually melt to aide in the natural recharge of our aquifers and reservoirs. This one extreme year won’t get us out of the almost 25-year drought that has impacted our watersheds here and in neighboring states, but it is a start.
What will also help groundwater in California were the recent DWR decisions to approve GSPs for six critically over-drafted basins while sending six other GSPs to the State Water Resources Control Board for intervention. With plans being implemented in the near future, negative impacts such as subsidence, degraded water quality, and overdraft will be more fully addressed and putting us on a path to more sustainable groundwater over the next 20 years.
Speaking of DWR, GRA was proud to join them and others on March 6th as DWR kicked off National Groundwater Awareness Week. The workshop was fantastic and as I was honored to have the chance to interact with those who attended the event along with fellow GRA Board Members Erik Cadaret and Christy Kennedy
Another partnership I am very excited about is with the Association of California Water Agencies to host the SGMA Implementation Summit and Workshop. This annual, but revamped event, complete with a ½ day workshop on conflict resolution, boasts a new format to maximize information exchange, networking, and collaboration. GRA is passionate about bringing together a diverse group of attendees in June, providing tremendous exposure and connection to the California groundwater community.

Last, but certainly not least, we recently released our Call for Abstracts for the 6th Annual Western Groundwater Congress. The theme of our staple event is “The Future of Groundwater is YOU,” and we want YOU to submit those abstracts this month so we can begin developing another outstanding agenda for this event in Burbank. I’m truly excited to see all of the content that comes into Clay Sorenson and the WGC team.


I want to thank all of our volunteers, Board Members (especially new directors Roohi Toosi and Moises Santillan for jumping in with both feet), Sarah Erck who managed GRA for many years (and has moved onto another great opportunity), and our amazing staff at SMA, who has done an outstanding job during this “transition period” for GRA. Our organization is stronger than ever, and I believe 2023 is going to be another phenomenal year for GRA!
Sincerely,
R.T. Van Valer
“THE FIGHT AGAINST CLIMATE CHANGE IS GOING TO CHANGE MORE IN THE NEXT FOUR YEARS THAN IT HAS IN THE PAST 40. THE GREAT STORY OF OUR LIVES IS JUST BEGINNING. WELCOME ABOARD.”
-THE ATLANTIC OCTOBER 5, 2022
The February 2023 ESG evnent in San Diego was a great way to kick off the new year for GRA. We are grateful to all of our attendees, sponsors, panelists and speakers.
This conference focused on the following areas:
• Environment, Social, Governance (ESG) – What is it, and where does groundwater intersect
• Sustainable Resilient Remediation – Leveraging groundwater site cleanup to incorporate ESG and climate adaptation
• Climate Change Impacts in the Industry – Bracing for changing groundwater levels and new regulations
Some of the top industry professionals from regulatory agencies, private companies, and the biggest thinkers in the West shared lessons learned, best practices and emerging ideas on the evolving climate regulations.

You couldn't have asked for a more beautiful venue on the beach at the Kona Kai Resort in San Diego over a day and half. Technical sessions focused on climate change and sustainable resilient remediation along with a round table with various industry experts and a networking happy hour were held on Day 1 and Day 2 focused on ESG connections.
Not only were all the sessions well attended, the conversations engaging and vibrant, but complimentary headshots were offered to all attendees as well some of the best conference food, we've ever had! The networking opportunities and bonfires on the beach evenings were a delight. Thank you again to all!

 by Emery Coppola, PhD, Roohi Toosi, PE, Mary Poulton, PhD, Ferenc Szidarovszky, PhD
Introduction
In this series of two articles, we will introduce the general background and foundation of artificial intelligence (AI) and compare it with traditional physics-based groundwater modeling. The second article will present several realworld case studies in which AI was successfully applied to difficult groundwater prediction and management problems.
Climate change has severely affected water supplies in California and made clear the need for innovative management tools that accelerate data processing and decision-making. The Sustainable Groundwater Management Act (SGMA) set a framework of sustainability indicators to address groundwater challenges such as aquifer overdraft, land subsidence, saltwater intrusion, streamflow depletion, and wetlands dewatering. SGMA regulatory compliance during climate extremes requires an innovative outlook to water management and benefit from adoption of evolutionary tools such as AI and Machine Learning (ML).
The volume, variety, and velocity of water-related data are increasing due to expansion of large-scale sensor networks and increased attention to topics such as disaster response, water resources management, and climate change. However, data alone and without analysis does not inform decision making. Combined with the growing availability and decreasing cost of computational resources, these already available data could be transformed into
actionable and practical knowledge using ML and AI, thus revolutionizing the water industry.1
Despite the unparalleled analytical and computational abilities of ML and AI, they have yet to gain widespread adoption and credibility among water industry decisionand policy-makers.
Artificial Intelligence or AI was the term coined for the seminal summer workshop convened at Dartmouth University in 1956, which included pioneers in this then new and exciting area of research. The theoretical inception of AI originated from the exceptional work of Alan Turing, who famously cracked the Nazi code during World War II (some of you might have seen the movie Imitation Game, which is the story of this groundbreaking work). The underlying theory of AI is based on the principle that human learning can be replicated by a brainlike interconnected mathematical structure that learns select behavior by processing representative data patterns through its architecture. Although various AI structures have been developed for specific applications, multi-layered artificial neural networks (ANNs) are the most-used AI structure and are briefly presented below.
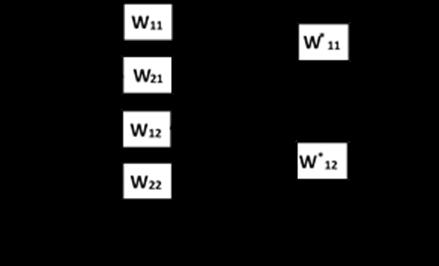
Figure 1 depicts the most basic architecture for the multilayered ANN (also known as perceptron).
The ANN architecture typically consists of three distinct layers, including an input, a hidden, and an output layer. Each layer consists of individual nodes fully interconnected
to nodes in the adjacent layer(s). Nodes in the input layer represent the predictor variables, while the nodes in the output layer represent the output or response variable(s) that one is seeking to predict. The nodes are connected through complex linear/non-linear mathematical functions (AKA transfer or squashing function) that are expressed in terms of input values and the weight of the transfer function shown as W in Figure 1.
initial groundwater elevation measured at the beginning of the week and the weather data for that week serve as the ANN model inputs or predictor variables. The training data consists of several years of weekly groundwater elevations and corresponding weather data. The data are organized into rows that represent each event, in this case a distinct week. Each row includes the input variables, which are the initial groundwater elevation at the beginning of the week and representative weather conditions for that week, along with the corresponding output or final groundwater elevation at the end of the week. Following training and testing procedures, the ANN model provides weekly groundwater elevation predictions based on the initial measured groundwater elevation and the forecasted weather conditions of that week.
More details regarding ANN’s mathematical foundation, development, and training issues with real-world applications to water may be found in Coppola and others.2
ANN utilizes a known set of input-output patterns (existing data such as historical water levels, groundwater pumping, etc.) to train or “learn” for making predictions. This training is accomplished by systematically adjusting the connection weights to minimize the difference between the ANN-estimated output values and the actual values. Through iterations of this process, ANNs calibrate or adjust the connection weight values (represented by W in Figure 1) based on the training predictions. Thus, the quality of data used for training the ANN plays a major role in predictive abilities of an AI model.
Let’s explore this in a simple groundwater-related example. A stakeholder is interested in predicting weekly groundwater elevations in a single observation well located in a remote area that is not affected by pumping. The
ANNs have distinct advantages over physics-based and statistical models. What sets an ANN apart from a physicsbased model is that it does not require any analytical formula or numerical equations based on physical laws (such as Darcy’s Law). In other words, physical parameters like hydraulic conductivity, storativity, and other characteristics of a water-bearing formation(s), many of which are highly uncertain and can vary significantly over space, are typically not required for ANN development and operation. Instead, more easily measured and often publicly available data like water levels, pumping rates, and weather conditions can be used as sole inputs to predict the output variables of interest. In addition, ANNs can be used to perform a sensitivity analysis, which quantifies how much each input variable increases the model’s prediction accuracy. In other words, it can highlight the important
variables that are influential on predictive abilities of the model so that with a limited data collection budget, the project team can focus on more crucial sampling points.

ANNs are not constrained by simplifying mathematical assumptions (e.g., linear system, normal distribution, etc.) and/or physical assumptions (e.g., laminar flow, steady state, etc.). Because of their superior non-linear modeling capability (Kolmogorov’s Theorem proves that an ANN can exactly represent any continuous function), ANNs can accurately model highly non-linear and complex phenomena. Moreover, because numerical models are calibrated with assumed hydrogeologic conditions like constant head boundaries, the model is mathematically constrained to behave physically consistent to these conditions. Re-initializing select model cells to real-time groundwater elevations that violate the assumed conditions (which the model was calibrated on) may produce highly inaccurate predictions. In contrast, ANNs can be initialized to real-time conditions; hence improving the prediction accuracy.
ANNs have been proven in groundwater applications to excel at several important tasks, including prediction and simulation, filling data gaps, flagging erroneous data, filtering noise from data, identifying important inter-variable relationships, increasing system understanding, improving data collection strategies, and supporting formal optimization modeling and management. They have been used in a variety of groundwater modeling applications including groundwater elevation and water quality predictions3,4,5,6 as well as formal optimization7.
The number and frequency of historical data required for developing a robust ANN model depends on the system complexity, the number of required model variables, and the modeling objectives. What further makes ANN a powerful tool is that it can efficiently determine whether sufficient data exists. Additionally, by identifying the important variables and the spatial and time resolution necessary for achieving meaningful predictions, it can significantly improve data collection and modeling strategies for both ANN and physicsbased models.
A limitation of ANNs is that they cannot be developed without the required real-world input data, whereas in physics-based models we can assume model parameters and new system conditions, like proposed pumping wells. Therefore, system conditions cannot be explicitly simulated for conditions or locations for which the ANN was not trained. However, leading practitioners have developed proprietary methods that can allow ANNs to simulate entirely new system conditions in situations with limited training data, which makes ANN implementation more applicable. We will explore real-world examples that explain this method in Part II of this series.
Traditional modeling and AI approaches each have distinct advantages. Rather than being an either/or choice, each can perform valuable tasks for groundwater management, and they can often be used in a complementary manner. As groundwater resources are increasingly over-used, depleted, and degraded, the urgency for effective management has never been greater. While there is a proliferation of data and information in the water sector, there is an urgent need to develop accessible and informative analysis tools that quickly and accurately inform policy. In the era of “Big Data” and powerful computing capabilities, AI can provide data-driven solutions that achieve superior groundwater management analyses and decisions in an increasingly water-stressed and uncertain world. The second paper in this series will present compelling real-world examples of how AI has been used to support important and challenging groundwater management objectives.
References:
1. Muhammed Sit et al. “A comprehensive review of deep learning applications in hydrology and water resources”. Water Science & Technology. Vol 82, Issue 12, August 2020.
2. Coppola, E., A. Szidarovszky, and F. Szidarovszky. “Artificial Neural Network Based Modeling of Hydrologic Processes”. Handbook of Engineering Hydrology. (CRC Press), March 2014.
3. Daliakopoulos, I.N., P. Coulibaly, I.K. Tsanis, Groundwater level forecasting using artificial neural networks, Journal of Hydrology 309 (1–4) (2005) 229–240.
4. Kouziokas, G.N., A. Chatzigeorgiou, K. Perakis, Multilayer feed forward models in groundwater level forecasting using meteorological data in public management, Water Resources Management 32 (15) (2018) 5041–5052.
5. Liu, D., G. Li, Q. Fu, M. Li, C. Liu, M.A. Faiz, M.I. Khan, T. Li, S. Cui, Application of particle swarm optimization and extreme learning machine forecasting models for regional groundwater depth using nonlinear prediction models as preprocessor, Journal of Hydrologic Engineering. 23 (12) (2018) 04018052.
6. Afzaal, H., A.A. Farooque, F. Abbas, B. Acharya, T. Esau, Groundwater estimation from major physical hydrology components using artificial neural networks and deep learning, Water 12 (1) (2020) 5. 5; https://doi.org/10.3390/w12010005.
7. Rogers, L.L., F.U. Dowla, Optimization of groundwater remediation using artificial neural networks with parallel solute transport modeling, Water Resources Research 30 (2) (1994) 457–481.
Our Geophysical solutions provide detailed 3D subsurface images that enables identification of most suited areas for surface water infiltration.
We are a newly established company in California, specialized in the use of Geophysics for groundwater investigation. We use AEM, tTEM and many other methods, and have extensive experience in California.
Please reach out to us if you have any geophysical questions.
wells and words

 by Roohi Toosi, PE, Apex Environmental & Water Resources
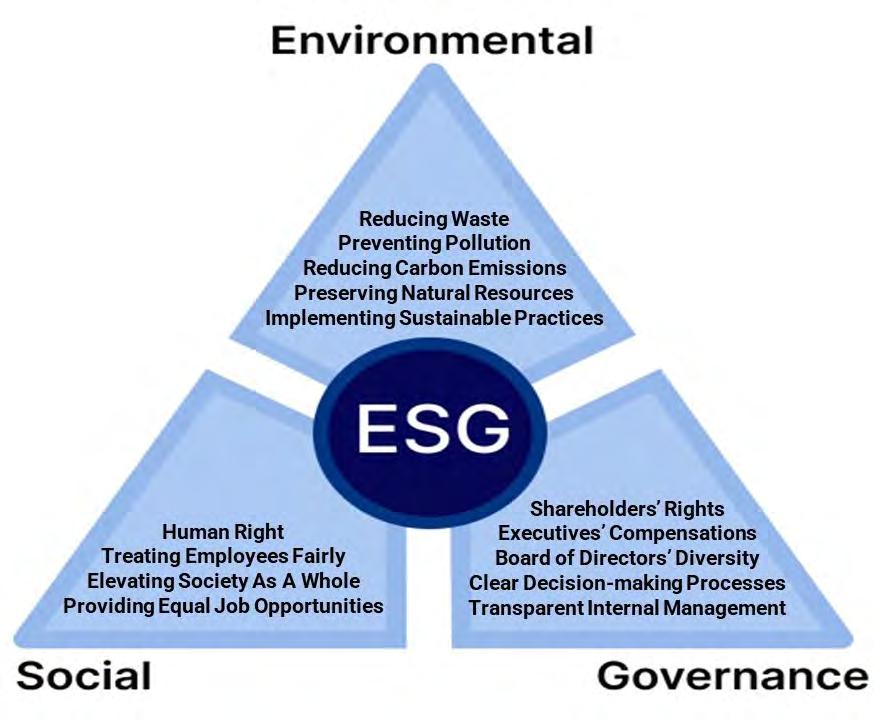
Environmental, Social, and Governance (ESG) was just a buzzword until recently, but it is encouraging to see that it is becoming the governing framework of organizations across many sectors and industries. ESG defines an organization’s commitment to their environmental and social impacts by incorporating these values into their management and decision-making processes. Public and private investors are increasingly supporting companies and ventures that have ESG metrics as their guiding principles or in other words:
• Organizations that are cognizant of their surrounding environment by reducing their carbon emissions, preserving natural resources, implementing sustainable practices, reducing their waste, and preventing pollution,
• Organizations that elevate the community they influence by treating their employees fairly, providing equal job opportunities, and elevating society as a whole and not just a particular group and interest, and
• Organizations with transparent internal management and decision-making processes that reflect on executives’ compensations, board of directors’ diversity, and shareholders’ rights.
Before ESG became a widespread framework, GRA was acting upon it as ESG goals and metrics are perfectly aligned with GRA’s mission as an organization. GRA’s mission has always been to preserve our natural water resources, cleanup groundwater contamination, plan and implement groundwater sustainability projects, provide water to our communities, enhance our supplies through recycled/
captured water, and educate the industry and stakeholders on sustainable and climate-resilient practices. As a pioneer in adopting ESG practices, on February 6 and 7, 2023, GRA organized an awesome event in beautiful San Diego to gather industry leaders, decision-makers, and practitioners to discuss how ESG is impacting our industry, and how Sustainable and Resilient Remediation (SRR) can help an organization to improve their overall ESG score*.
Sustainable Remediation is execution of practices and technologies that above all will ensure a clean and safe environment for human health, save more energy, conserve more water, reduce greenhouse gas (GHG) emissions, improve water quality, minimize waste and toxins, and have a positive socioeconomic effect on communities. To make Sustainable Remediation also Resilient, the remedial approach must endure extreme natural events such as drought, sea level rise, storms, wildfires, earthquakes, etc. All positive outcomes of SRR are directly or indirectly correlated with the ESG metrics, and therefore make an environmental remediation project a perfect opportunity to elevate the responsible party’s ESG impacts.
The United States Environmental Protection Agency (USEPA)2 identified six core elements for “Green Remediation” practices. The Interstate Technology and Regulatory Council (ITRC)3 further explored resilient components of an SRR project. In addition to these six components, there is a seventh hidden element that is an intrinsic outcome of an SRR project. Here we will evaluate these components from the ESG standpoint:
Energy Perspective:
Utilizing renewable energy to power the treatment systems, selecting more energy-efficient equipment, utilizing passive-energy sampling and remedial techniques, and avoiding reconstruction cost by building a resilient system, are ways that an SRR elevates the overall ESG score of the responsible party.
Direct Emission
Perspective:
Reducing GHG emissions from operating heavy machinery, implementing efficient dust control measures, and incorporating resilient approaches that eliminate the threat of sudden releases of contamination, contribute positively to ESG impacts of an organization.
Water Perspective:
Sourcing recycled water for remedial construction, utilizing treated water as a water supply, and incorporating green infrastructure to capture stormwater for recharge can promote the ESG metrics and offset a portion of water demand for the local community.
Ecosystem Perspective:
Minimizing negative impacts on the surrounding ecosystem and habitats, controlling contaminant plume propagation, improving the overall health of the ecosystem through contaminant reduction, and protecting the habitats from extreme weather conditions that could disrupt remediation and cause
adverse effects, elevate the ESG metrics of an organization.

Waste & Material Perspective:
Incorporating recyclable and renewable materials, implementing processes with minimal or net zero waste generation, and reusing generated waste for redevelopment purposes are examples of sustainable practices that will improve the ESG impacts of the responsible organization.
Community Perspective: Engaging stakeholders in decision-making is an important component of an SRR project that will result in reducing the environmental burden on the impacted community, boosting the local economy by utilizing local workforce and providing redevelopment, and rebuilding trust between the responsible party and the community; hence elevating the ESG score.
Let’s not forget that the purpose of a remediation project is to cleanup a contamination that has affected the environment, the community, and the ecosystem around it. The contamination negatively influences the responsible party’s ESG impacts. By conducting the remediation (not considering the sustainable and resilient components), the responsible party automatically improves their environmental impact, elevating their ESG score.
Conclusion:
We are seeing an increasing demand from investors for organizations that are cognizant of their ESG impact. GRA, as a leading groundwater resource organization, has proven to be committed to ESG metrics, which are parallel to GRA’s mission. The recent GRA symposium helped to educate the water sector on the relationship between ESG and SRR. As described above, an environmental liability such as a cleanup project could be leveraged as an opportunity to improve ESG impacts of the responsible party through implementing SRR practices. Regulatory agencies and councils are developing guidance materials that can be utilized for planning and implementing successful SRR projects. We should see a shift of narrative and requirements in the regulatory landscape that demands SRR practices be implemented in every remediation project.
* ESG score is an effort to quantify an organization’s performance against various sustainability metrics as it relates to Environmental, Social, and Governance issues. Various groups such as finance and investment firms, consulting groups, standard-setting bodies, NGOs, and even government agencies develop the scoring system based on widely accepted factors like climate change, diversity, equity, and inclusion (DEI), and human rights. ESG rating platforms determine a weighting for each measurement criterion; then, they assess an organization’s performance against each criterion. An organization’s final ESG score is typically a sum-product of the criteria ratings and the (proprietary) criteria weightings. More details can be obtained here

References:
1. Roohi Toosi, 2023, ESG and Sustainable Remediation; https://www. apexewr.com/esg-and-srr
2. USEPA, 2008, Incorporating Sustainable Environmental Practices into Remediation of Contaminated Sites; Link to the PDF
3. ITRC, 2021, Sustainable and Resilient Remediation; https://srr-1. itrcweb.org/

identifyinG locations for sMall water suPPly wells in fractured-rock enVironMents usinG Vlf-eM
by David W. Abbott, P.G., C.Hg., Consulting GeologistSince February 2016, I have been assisting a field technician in San Diego County, CA, who performs passive Very Low Frequency (VLF) Electromagnetic (EM) geophysical surveys for mostly 2- to 30-acre rural parcels in order to identify possible locations for small potable water supply wells in mainly fractured-bedrock environments. The technician collects the data and I interpret the data in order to provide a standardized reconnaissance-level (recon-level) Preliminary and Interpretive Commentary for the client. The VLF-EM survey is one of several possible exploration techniques to determine subsurface characteristics and geologic structures suitable for a successful low-yield water supply well.
VLF-EM is based on the measurement of alternating magnetic fields (AMF) associated with artificial or natural currents occurring in the subsurface. If these currents are induced by a primary AMF, the name inductive EM method applies. If these currents are conducted into the ground via electrodes, the name conductive EM method applies. The VLF-EM method discussed here and used by the technician is an inductive survey method.
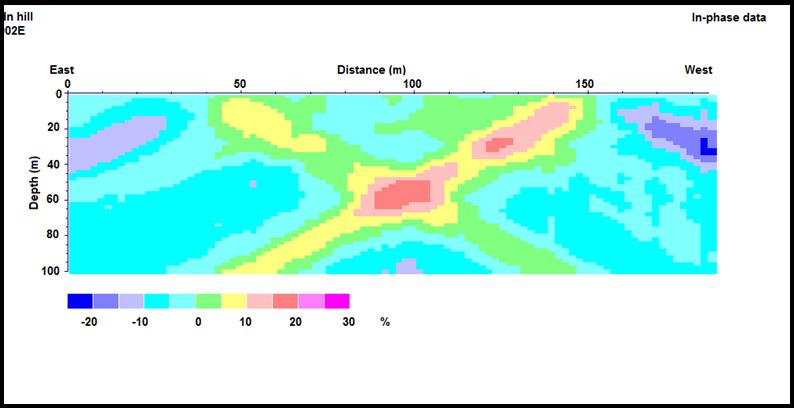
These passive surveys are conducted with a light-weight (13.2 pounds) instrument (WADI)1,2,3 which is: (1) compact; (2) carried and operated by one technician; (3) easy to operate; (4) measures and records the changes in the EM currents along traverses; and (5) provides initial results while collecting the data at each station. The survey yields a current density profile which shows the EM on the y-axis and distance along the ground surface on the x-axis (see Figure 1).
MetHodsThe VLF-EM method has been available since at least the 1940s for oil/gas exploration. However, the method was generally too expensive for groundwater and hydrogeologic investigations until the late-1980s when the arrival of the desk-top computer allowed recon-level surveys to be completed for less than a fraction of the cost to drill exploration test wells. The digital codes developed in the late-1980s significantly reduced the costs of manual labor to evaluate and present the VLF-EM data that was collected in the field. WADI was offered to the groundwater industry in about 1987.1
Natural and manmade primary currents (waves) can penetrate rock formations underlying the ground surface. In rock formations which are homogeneous with respect to electrical conductivity and resistivity, the primary current will continue to penetrate both laterally and with depth until the energy of the transmission dissipates. If the primary current encounters a subsurface feature with a different resistivity (water-filled fractures – also known as an electrical conductor) than the surrounding rocks, a new or secondary (induced) current develops and its wave energy will alter the primary wave energy of the transmission. The subsurface features identified by the induced current can be buried geologic features or manmade objects (i.e., pipelines, buried drums, septic tanks, leach fields, etc.). The variation of the signals (percent difference between the primary and secondary currents) measured in the field from the underlying rocks was originally illustrated with various shades of white-gray-black on pseudosections (p-sections), which bear no relationship to a geologic cross section. In the 1990s, the p-sections were upgraded with color (see Figure 2).
The VLF-EM method measures the induced currents produced by local subsurface features including the general distribution and properties of the geologic structure, fractures, faults, and rock beneath the land parcel. The induced currents are generated from the prevailing and transmitted current originating from usually distant and powerful VLF (between 15 and 30 kilohertz [kHz] for WADI) AMF transmitters operated by the US Navy for submarine vessel communications. These geologic properties and subsurface features are inferred from the VLF-EM data, can be related to the possible occurrences and accessibility of groundwater, and can help to select a more favorable drilling location for a water supply well in fractured rock. Note that no direct or physical contact of the underlying geology (or other subsurface exploration methods) is performed during this type of survey. However, if available, existing borehole data on the property can be used to “calibrate” the VLF-EM interpretation. The findings and conclusions of these recon-level surveys are based on research of readily available (internet accessible) local geologic, hydrogeologic, and topographic data coupled with the instrumentation which measures both the primary and induced (or secondary-type) currents by the induction method with computer-generated and -enhanced graphics interface that came with WADI and with similar past experience.
Surveys are conducted along roughly linear traverses on the parcel that are generally perpendicular to the regional geologic trends (geomorphic and/or structural, if known). The field technician is instructed to traverse perpendicular to topographic and geomorphic structures (i.e., valleys, ground surface depressions, outcroppings, etc.) and to avoid cultural features on the parcel. Field measurements are collected along each individual traverse at approximately 30- to 50foot intervals (stations). The theoretical depth limitation for collection of meaningful data with WADI is about 330 feet (100 meter) or greater in crystalline rock; less in sedimentary rocks. Note that the 330-foot depth of penetration is consistent with my training of fractured rock hydrogeology, which is: “Don’t drill deeper than 300 to 400 feet in fractured
rock unless you have a ‘darn’ good hydrogeologic reason to drill deeper”, because the (1) occurrence of open fractures, (2) their aperture size, and (3) permeability usually decrease with depth.4,5 The depth of penetration (δ) in meters (m) of VLFEM depends upon the resistivity (ρ) in ohm-meters (Ωm) of the subsurface rocks and the AMF transmission frequency (ν) in hertz (Hz)3
δ (meters) = 503 sqrt [ρ ÷ ν]
If ρ of rocks can vary from 10 to 100 Ωm for clay and is >5,000 Ωm for granite and ν of VLF transmission is 15,000 Hz; then the possible range of δ for VLF-EM could vary between 13 and 41 meters for clay; and be greater than 290 meters for granite. Because the actual resistivity of the subsurface rocks is generally unknown beneath a parcel, the depth of penetration and the depth to the VLF-EM anomaly are generally unknown when applying this method. Nevertheless, the horizontal location on the parcel can be identified from the charts.
The field data for each station is concurrently down-loaded (when a station is occupied) into the memory of the Receiver for computer analysis. The computer-generated analysis in the field includes the line profile(s) during the traverse (Figure 1). The p-section is later generated on a desktop computer with software that was provided with WADI. The p-section is used to present all of the data from a traverse in one chart.
A color bar scale (ranging from -25 to +30%) is provided with each p-section (see Figure 2). The colors on the lefthand side (cooler or colder) of the scale indicate that the rocks are more homogeneous (i.e., no fractures), while the right-hand side (warmer and hotter colors) of the bar scale suggests the underlying geology or structure is heterogeneous, or anomalous in contrast to the surrounding un-fractured rocks. The observed hotter anomalies along the profile are inferred to be more favorable for the movement and storage of groundwater. The warmer colors indicate the degree to which the rock may be fractured which could provide sufficient permeability for a water supply. For example, red areas on the chart would indicate that the rock has a greater amount of fracturing than the yellow areas. The p-section helps to identify the horizontal location on a specific parcel (i.e., 98 meters on the horizontal scale of Figure 2) but does not provide accurate information on the depth of the anomaly. Multiply traverses (both parallel and perpendicular to each other) are usually collected at each parcel. Long profiles (> 200 meters) are preferred in order to capture the entire subsurface anomaly but cultural features (i.e., fences, property boundaries, buildings, infrastructure, etc.) on the parcel may restrict the lengths of the traverses.
It is noteworthy that the reported success rate (82%) for EM techniques is much greater than other geological techniques in identifying subsurface fractures which include logistical (50%), air photo interpretation (61%) – including lineament analysis, and hydrogeology (66%). If vertical electric soundings (VES) are combined with VLF-EM, then the success rate increases to 90%.1,6 In addition to siting a water supply well location, VLF-EM has been used successfully at environmental contamination sites to locate buried drums, etc.7,8 The VLF-EM survey should be included in the toolbox of every hydrogeologist for evaluating potential locations of wells on a parcel underlain by crystalline rock.

Figure 1
A plot of unfiltered in-phase data against distance at location VLF 01. (Michael, George A., A.A. Agwul, and O.D. Akam, 2013, Fracture zone detection using very low frequency (VLF) electromagnetic method in parts of Oban Massif, southeastern Nigeria published in Advances in Applied Science Research, Volume 4, Issue 6, p.p. 104-121)

References:
1. Atlas Copco ABEM AB, 1988, Smart Water Prospectors Rely on WADI: Finds More Water Faster, published in Impulse (instrument news from Atlas Copco ABEM), pp. 1-2.
2. ABEM Instruction Manual, unknown date, ABEM WADI VLF Instrument: Simple, state-of-the-art water and mineral prospecting instrument, published by ABEM 90282, 47p
3. ABEM Interpretation Guide, 1989, ABEM WADI VLF Instrument: Theory, practice, and case stories for WADI operators, published by ABEM 93057, 36p.
4. Davis, Stanley N. and L.J. Turk, 1963, Optimum Depth of Wells in Crystalline Rocks, National Groundwater Association publication Groundwater, pp. 6-11; and Davis, Stanley N. and L.J. Turk, July-August 1969, Best Well Depth in Crystalline Rocks, Johnson Drillers Journal, pp. 1-5. (note that the complete set of Johnson Drillers Journal are on the CD included with the third edition of Groundwater and Wells by R.J. Sterrett, 2007)
5. Abbott, D.W., 2007, Wells and Words column: Fractured rock aquifers – positive correlation between well depth and estimated hydraulic conductivity, in HydroVisions a quarterly publication of the Groundwater Resources Association of CA, Volume 16, No. 4, pages 4/5.
6. Singhal, B.B.S. and R.P. Gupta, 2010, Applied Hydrogeology of Fractured Rocks (second edition), Springer Science+Business Media, Dordrecht, the Netherlands, 408 p. (see page 305).
7. Stewart, Mark and Robert Bretnall, Winter 1986, Interpretation of VLF Resistivity Data for Ground Water Contamination Surveys, NGWA Groundwater Monitoring and Review, pp. 71-75.
8. Meyer, Brian R., C.K. Eger, and W.T. Blasingame, unknown date, Application of a Geophysical Tool (WADI) which monitors Very Low Frequency (VLF) radio waves at the Tower Chemical NPL Site, pp. 1,113 to 1,127.
wells and words
GeoH2oMysteryPix
by Chris Bonds, Sacramento Branch Member at Large
GeoH2OMysteryPix is a fun, new addition to HydroVisions that started in Fall 2022. The idea is simple; I share a question or two, some cool supporting geology and/ or water resources photo(s) along with a hint, and readers email their guesses to me.
In a future issue of HydroVisions, I will share the answer(s) along with some brief background/historical information about the photos and acknowledge the first person(s) to email me the correct answer(s).

GRA looks forward to your continued participation in this new, interactive section: GeoH2OMysteryPix.
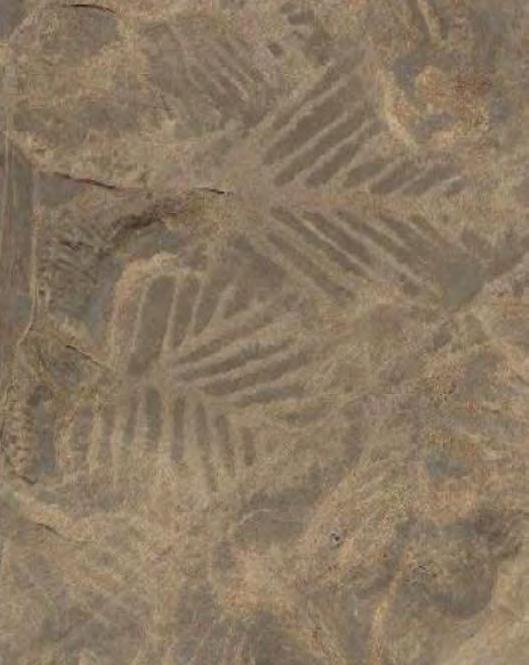
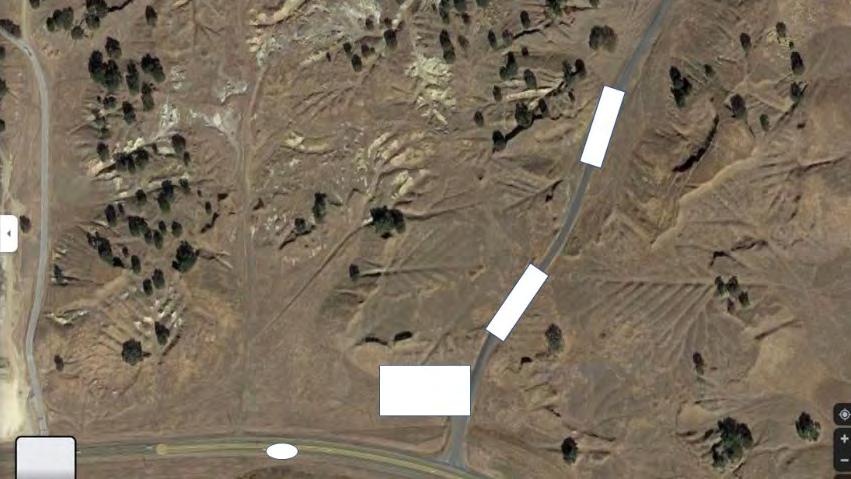
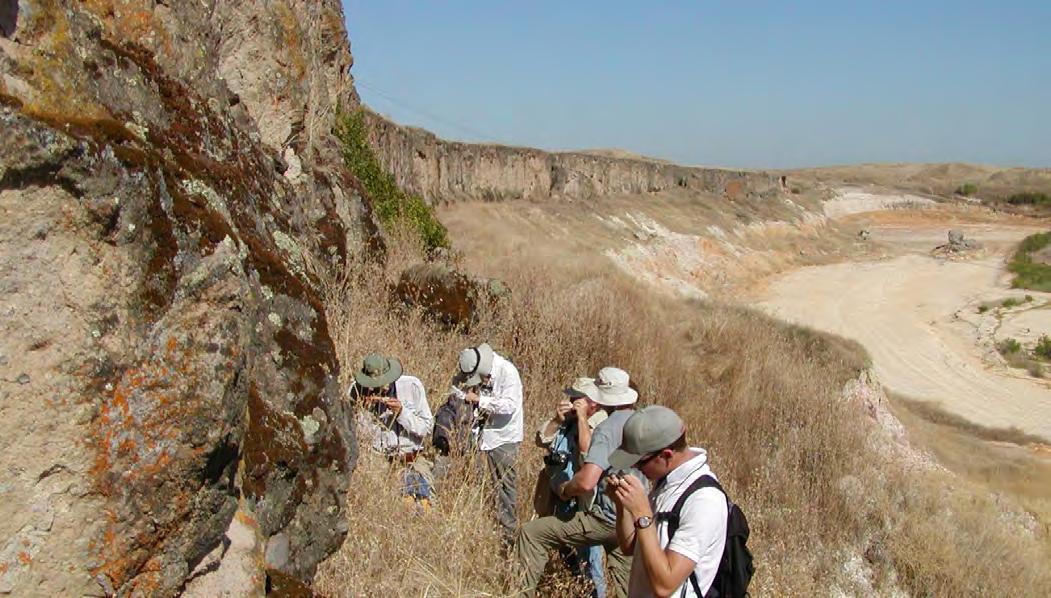
What are these Patterns? Where are they Located? Hint: These are not geoglyphs:
Congratulations to GRA member Trevor Pontifex from Montgomery & Associates for being the first to partially answer the Winter 2023 GeoH2OMysteryPix Questions.
Trevor did some preliminary Internet research and came up with the following: He presumed that this site was in CA and that it was probably mining related”. Trevor’s
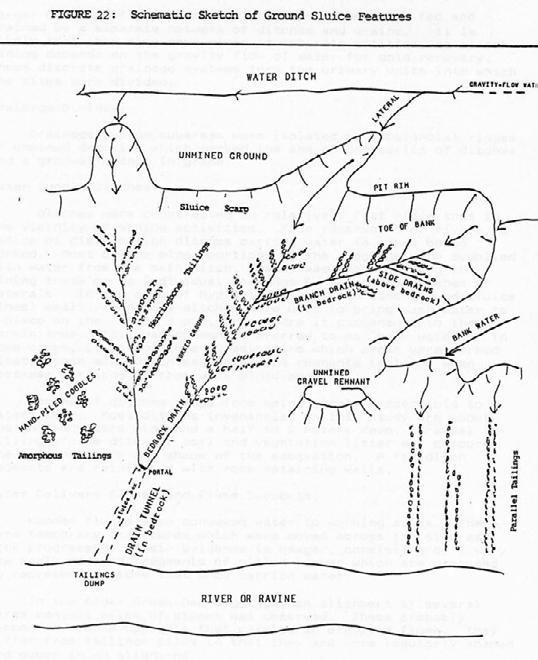
presumptions are correct, but there is so much more to the story about this historical site, so here is the lowdown: This site is none other than the Michigan Bar Mining District along Jackson Highway (SR16) east of Rancho Murieta (Sacramento County). The district covered a vast area roughly between the towns of Michigan Bar and Sloughhouse. The district’s placer gold deposits were mined extensively between 1849 and 1900, primarily by hydraulic and ground sluicing techniques. Dredging was another successful technique and extended the district’s mining life into the 1950s.
Total gold production in this district has been estimated at over 1,500,000 ounces. The interesting herringbone patterns you see in the above photos are due to a specific mining technique practiced there known as ground sluicing. Figure 22 from Lindstrom 1988 sketches out the unique features of a ground sluice mining site.
CA Historical Marker No. 468 on Michigan Bar Road, just off SR-16, commemorates this amazing, local mining district. FYI, a hydraulic mining scarp can be seen in the upper right of the historical monument photo.
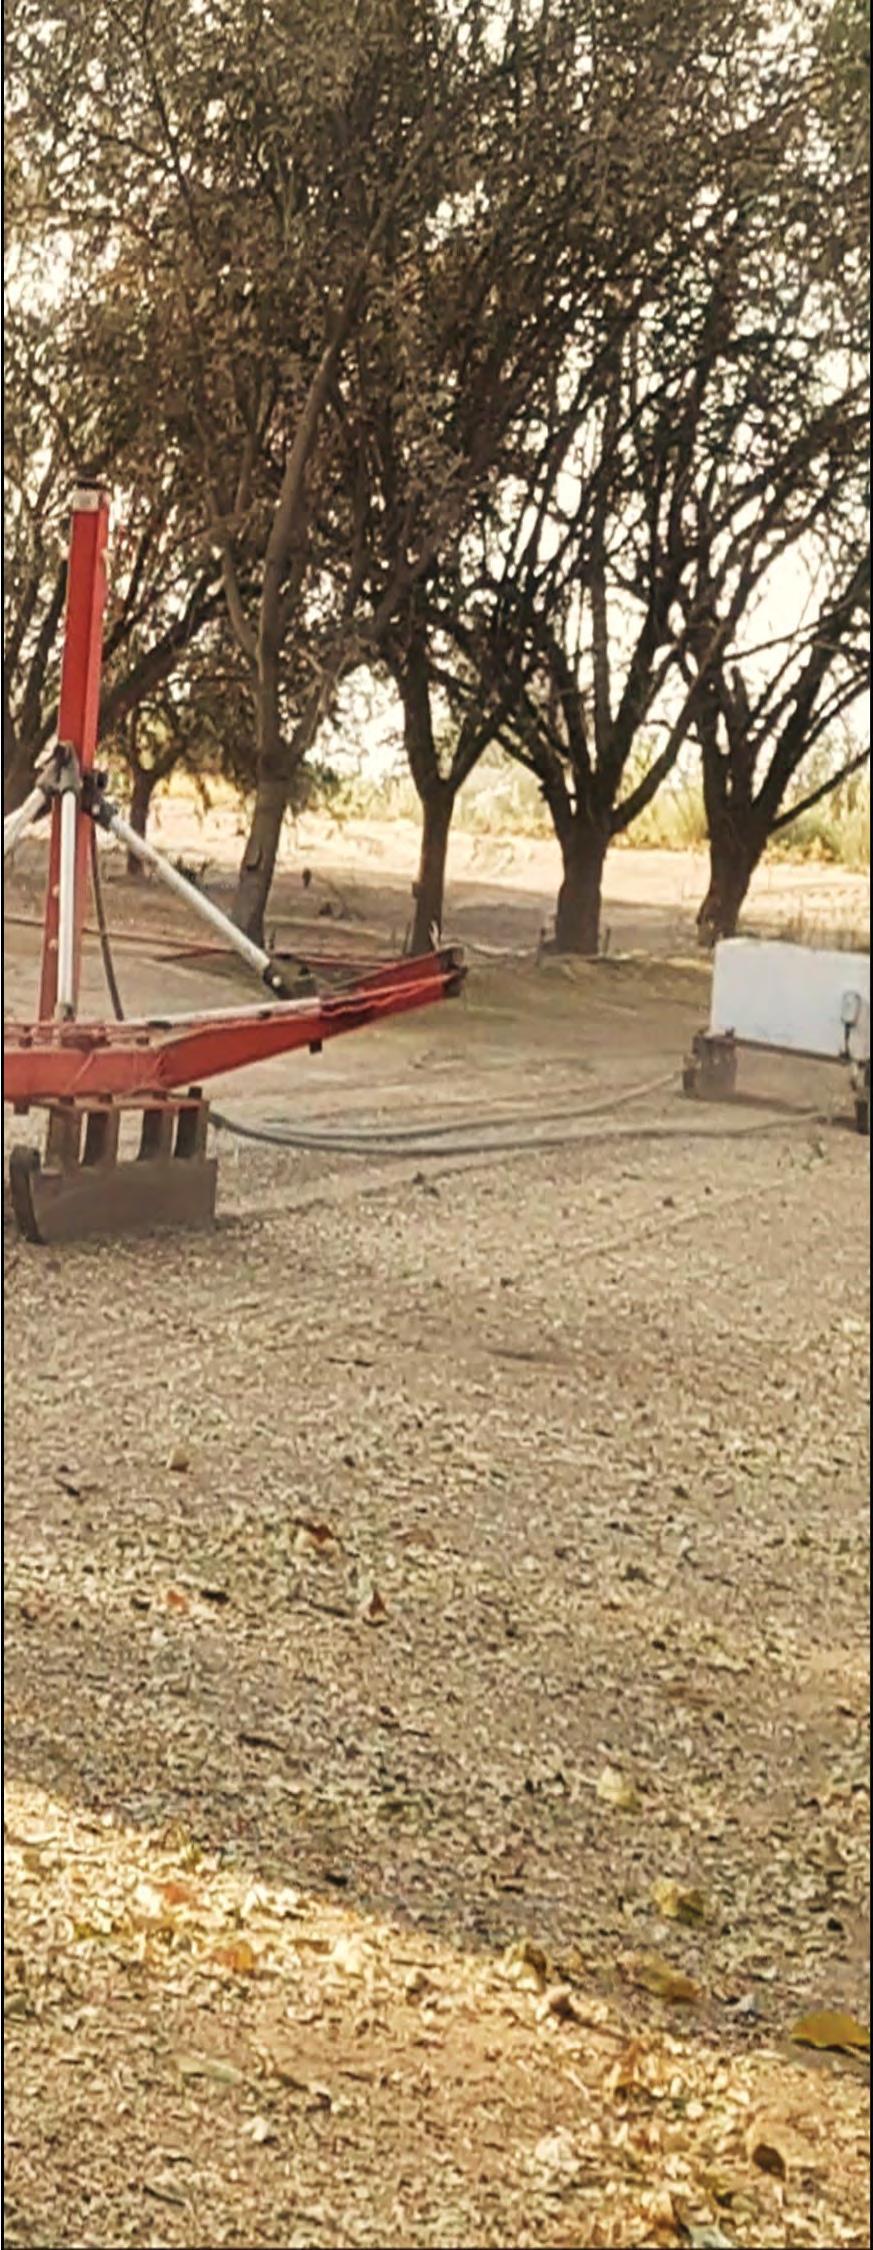
What is this? Where is it Located?
Hint: It is not the foundation excavation for a mega dam in the western US.
References:

1. The Historical Marker Database - https://www.hmdb.org/m. asp?m=2037
2. Lindstrom, S. 1988. A Comparative Evaluation of the Natoma Ground Sluice Diggings, Folsom, California. Prepared for Environmental Impact Professionals, Sacramento, California. June.
Introduction
This article is the second in a series of four HydroVisions articles that provides basic information and answers general questions about the California Department of Water Resources’ (DWR’s) Airborne Electromagnetic Surveys (AEM Project); , and connects the reader to more detailed information online. This work was initiated in 2021 and will be completed in 2024. The project is being funded through Proposition 68 Funding. Visit the AEM Project webpage for more information: https://water.ca.gov/Programs/SGMA/AEM.
This second article provides technical details on the AEM method. Previous and subsequent articles include:
• Winter 2023: (published): High-level overview of the AEM Project, introducing the AEM method, the kinds of data that are collected, and the project schedule.
• Summer 2023: How Does AEM Improve Management of Groundwater? Case Studies from Denmark and other States in the US.
• Fall 2023: How can AEM Improve Management of Groundwater in California and the US? A Case Study in California
While this article dives into some of the details on AEM data, more information can be found in DWR’s AEM Project data portal (https://data.cnra.ca.gov/dataset/aem). Specifically,
• Sections 3 and 4 of the Survey Area Data Reports give a walkthrough of the AEM survey methodology and data processing and inversion. Survey Area 1 (Salinas Valley) Data Report: https://data.cnra.ca.gov/dataset/aem/ resource/6def3ab5-9b35-4e8e-b2e6-c21e330d8a6d
• Appendices 2 and 3 of the Survey Area Data Report give additional details on topics such as the AEM system configuration, field notes, the AEM data processing and inversion workflow, and references to additional reading. Survey Area 1 (Salinas Valley) Data Report Appendices: https://data.cnra.ca.gov/dataset/aem/resource/708b20ac14bb-49f7-ad88-a6233566925e
Now, let’s talk about data!
What are AEM data?
The AEM method is an electromagnetic method, mounted on an airborne platform, that uses electromagnetic measurements to estimate the electrical resistivity of the subsurface. Specifically, in DWR’s AEM Project, a timedomain electromagnetic method is used, and is based on the principle of inducing electrical currents in the subsurface and receiving the earth’s response over rapid intervals of time.
Figure 1 is an image of the AEM system being used in the DWR’s AEM Project. The antenna array is suspended beneath a helicopter piloted by Sinton Helicopters and is operated by SkyTEM Surveys.
Raw AEM data comprise a set of voltage timeseries that represent changes in the magnetic field over time. Let’s unpack that. During the AEM survey, the helicopter flies at a groundspeed of 80-100 kilometers per hour (50-60 mph) carrying the equipment approximately 30 meters (100 feet) above the ground. Throughout the survey, an AEM measurement is being made approximately every 20 milliseconds, roughly every 5m. In this short span of time, a lot happens, which is illustrated in Figure 1:
• A current is generated in the transmitter loop (red line in Figure 1), creating a constant magnetic field (light grey lines).
• The current is abruptly shut off, causing the magnetic field to lose intensity over time as it propagates into the subsurface.
• The decaying magnetic field induces electrical currents in the subsurface (yellow lines).
• The subsurface electrical currents generate their own, secondary magnetic field (black lines).
• The decay of the secondary magnetic field is measured in the receiver coil (circled in brown) as a voltage timeseries. How do the voltage time series become resistivity images?
While the raw data acquired by an AEM system are timeseries of induced voltages measured by the receiver coil, the product of an AEM survey is a set of resistivity estimates as a function of depth. These two parameters are related because, as the AEM signal propagates into the subsurface, the amount of current induced in the subsurface, and therefore the strength of the signal measured in the receiver coil, depends on the electrical resistivity of the sampled area.
To obtain resistivity estimates, the AEM voltage timeseries and information about the sensor positioning are input into a type of optimization, called an inversion. Figure 2 illustrates this conversion from the voltage timeseries (Figure 2a) into an estimate of the resistivity with depth (Figure 2b). When the many resistivity estimates are stitched together along or across flight lines, cross-sections can be developed, such as shown in Figure 2c, which spans the width of the Central Valley between Fresno and Merced.
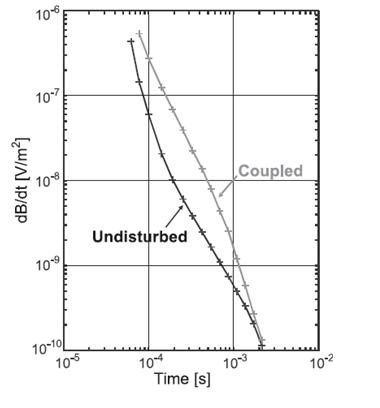
Before the AEM data can be inverted, the data undergo crucial and time-consuming processing steps, which includes filtering, averaging, and removing noisy data. AEM data are very sensitive to metallic infrastructure, such as powerlines, cables, and pipes, which create interference (or coupling) in the data, such as shown in Figure 3. Some types of interference are readily visible from the voltage timeseries due to the oscillating character (Figure 3a), whereas other types of inter-
ference, such as from vineyards and uninsulated pipes (Figure 3b), are typically identified from infrastructure maps and the resistivity estimates from a provisional inversion.
During the inversion, the entire AEM dataset is inverted together, and the resistivity estimate at each location is constrained to have some similarity to nearby locations. This constraint is done by introducing a dependency between resistivity estimates for neighboring locations.
Inverting large datasets takes hours on a powerful computer, and multiple iterations of inversion and quality control may be necessary before the inversion result is considered final. In DWR’s AEM Project, ancillary well data, compiled as part of the project, are plotted along with resistivity estimates as a validation of the inversion results. AEM data can be revisited in locations where well data and inversion results conflict.
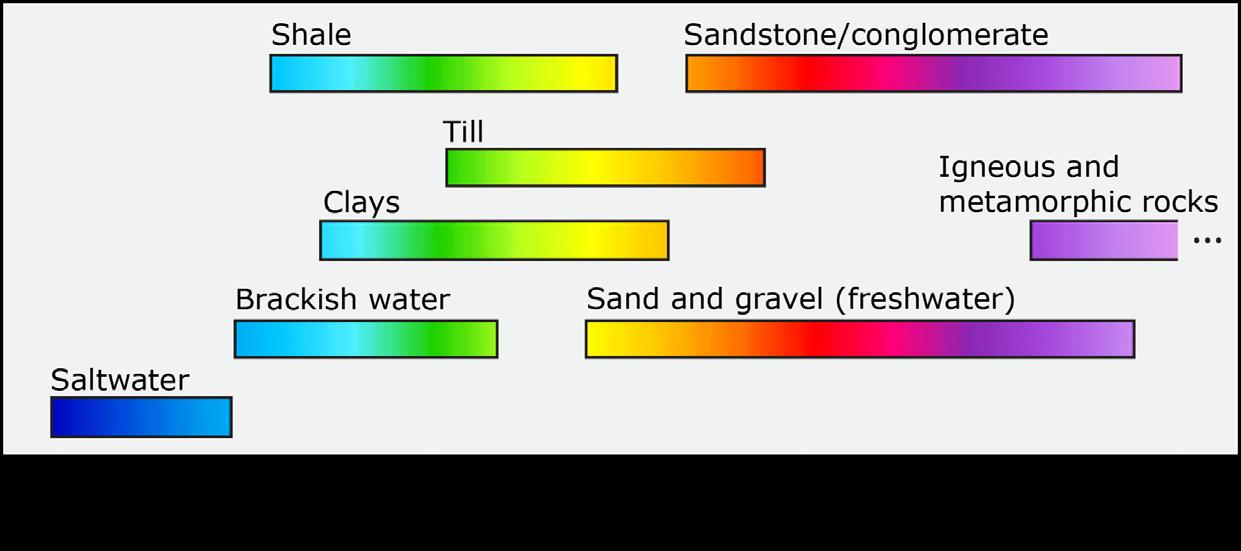
The estimated resistivity values from the AEM method can support mapping of the subsurface because of the relationship between electrical resistivity and subsurface properties of interest. Generally, resistivity will decrease with an increase in clay content, groundwater salinity, or water content. The general relationship between resistivity, lithology, and salinity is illustrated in Figure 4. The wide range of resistivity values spanned by each bar underscores the variable and sitespecific nature of the relationship between resistivity and earth materials. Locally variable conditions can cause coarse sediments to have a higher resistivity in some areas than in others, and mixtures of sediments (e.g., till) result in resistivity values between those of coarse and fine.
In DWR’s AEM Project, locally varying conditions are integrated into the AEM data interpretation by utilizing existing information, like lithology logs, geophysical logs, water levels, and water quality (where available). The acquired AEM data are interpreted to show the distribution of coarse-grained and fine-grained materials in the subsurface, which improves the understanding of aquifer structures. The data can be used in several ways, including, but not limited to, identifying geological structures such as folds and faults, mapping the extent of saline water bodies, and identifying areas suitable for groundwater recharge. Examples of how AEM data are used will be provided in the next article in this series.
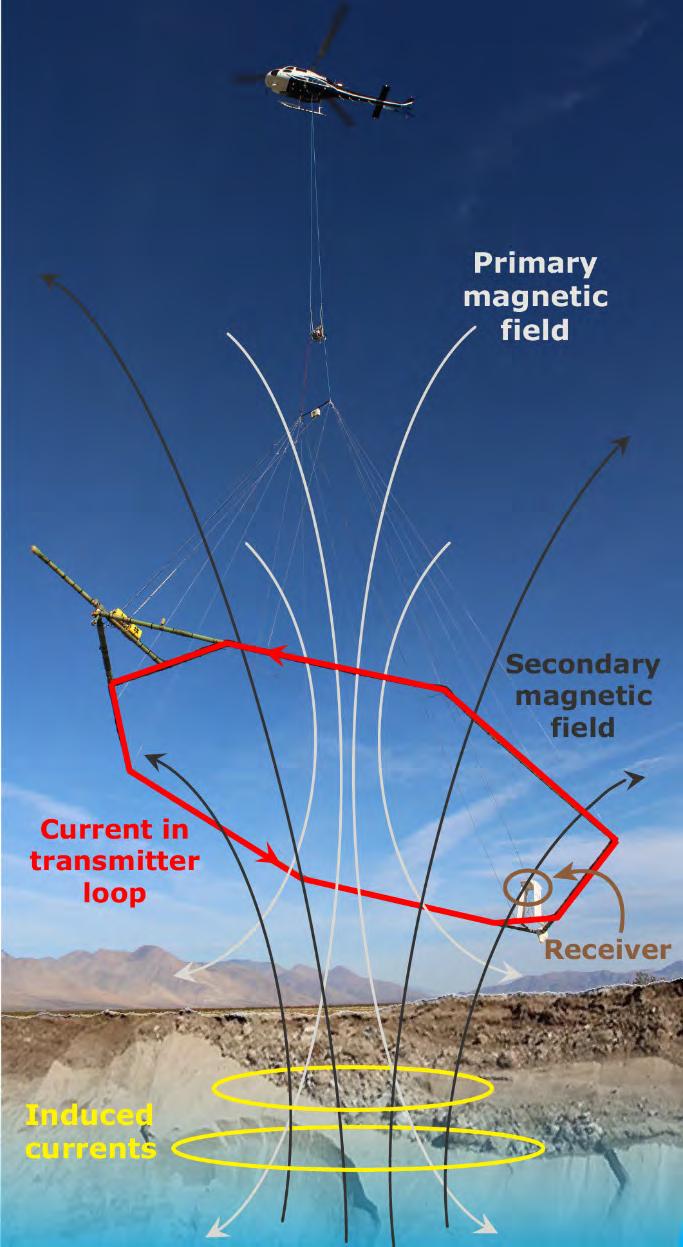
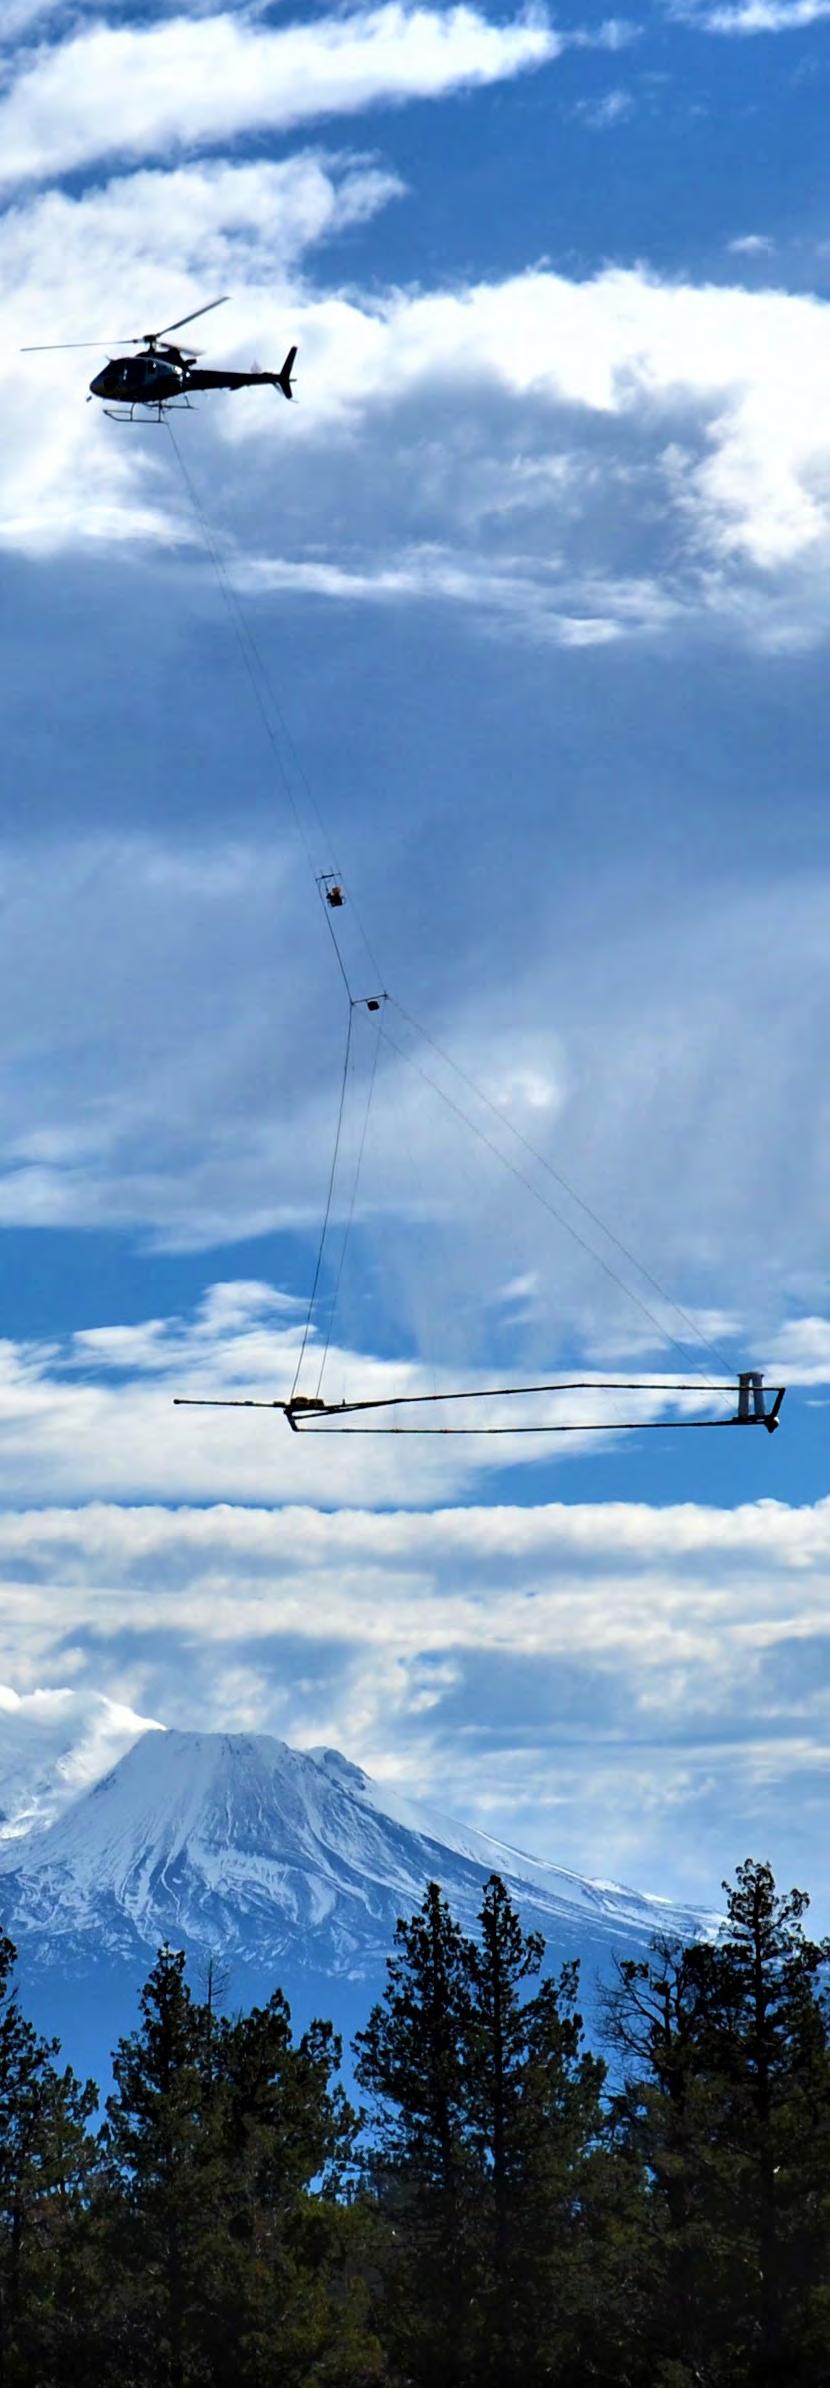
Figure 2: Parts of the AEM data workflow: (a) an example of a single voltage timeseries of acquired AEM data, (b) the corresponding resistivity estimate (i.e., model) showing the resistivity from the ground surface to a depth of 350 m (1,150 ft), (c) a crosssection comprising hundreds of resistivity estimates along a profile. The location of the single resistivity estimate in b) is outlined in c) by the dashed rectangle.
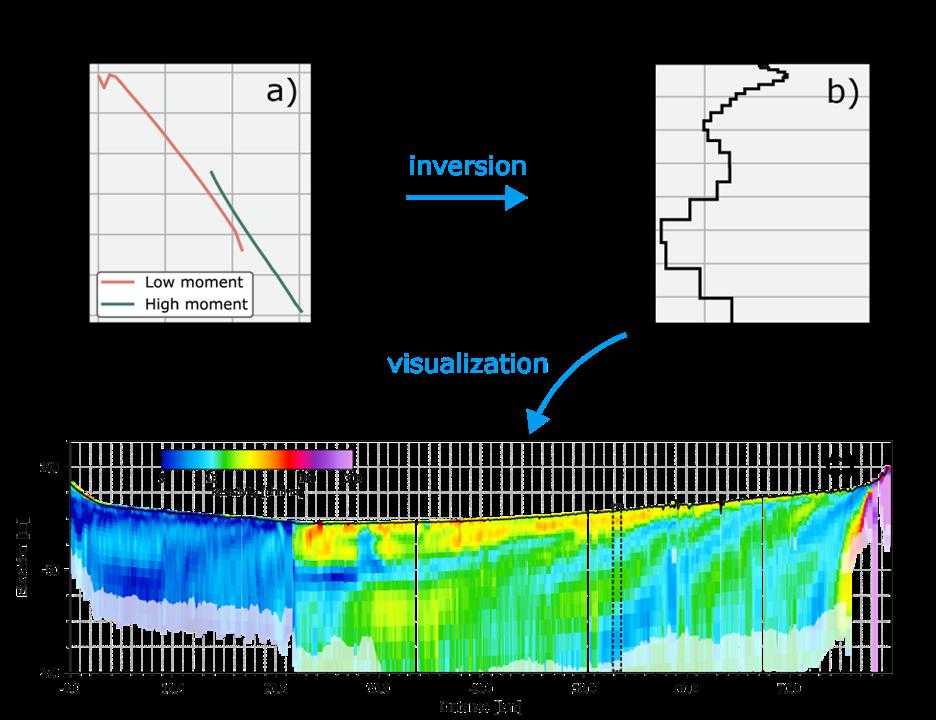
Figure 3: Effect of two different types of interference on AEM data: a) interference from an insulated source, which is straightforward to identify from the AEM data, and b) interference from a grounded source, which is often identified from the inversion results or from supplemental information. Figure from Danielsen, J.E., Auken, E., Jørgensen, F., Søndergaard, V. and Sørensen, K.I., 2003. The application of the transient electromagnetic method in hydrogeophysical surveys. Journal of applied geophysics, 53(4), pp.181-198.
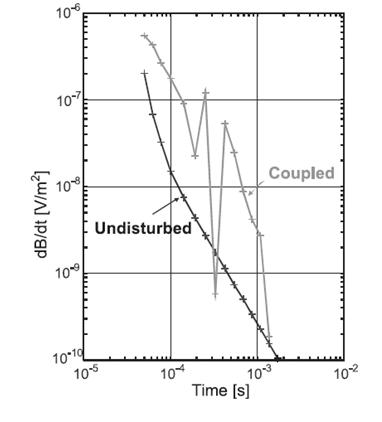
Figure 4: General relationship between resistivity, sediment and rock types, and water salinity
Reference
1. PhD and Geophysicist with Ramboll
2. PG and CHg with Ramboll, lead reviewer and Project Director for AEM Project
3. PhD and Senior Geologist with Ramboll, Project Manager for AEM Project
4. PG and CHg with GEI Consultants and task order manager for AEM Project
5. PG with GEI Consultants and technical lead on compiling supporting data for AEM Project
6. PhD, PG with Sustainable Groundwater Management Office, California Department of Water Resources and Project Manager for AEM Project
Gra and acwa* are Proud to Present a new and iMProVed sGMa iMPleMentation suMMit!
*presented by the ACWA Groundwater Committee and the GRA SGMA Implementation Subcommittee
This is a once-a-year GSA and communities of interest get-together to foster progress on SGMA implementation, collaborating with ACWA members and implementers and GRA technical experts.
Format:
• One full day of interactive panels
• Reverse panel with DWR/SWRCB leaders
• Guided lunch discussions
• Evening social with tables representing different areas in the state to network and discuss location-specific challenges
Additional: Optional ½ day workshop on conflict resolution training and approaches
this one!
Key Topics:
• GSP 5-Year Updates – requirements and expectations, including need for revised climate change analysis
• Demand management as a complementary tool to supply augmentation – creative approaches
• Inter-connected surface water and depletions, upcoming requirements and state framing (GSP compliance and tools) ------And more!

This is YOUR Summit – come prepared to get the most out of it!
On June 7th & 8th 2023, don’t miss this opportunity to share and mingle with other SGMA practitioners!
For more information or if interested in participating/ providing input/leading a conversation, reach out to: Lisa Porta (lporta@elmontgomery.com), Adam Hutchinson (ahutchinson@ocwd.com)

 by
by

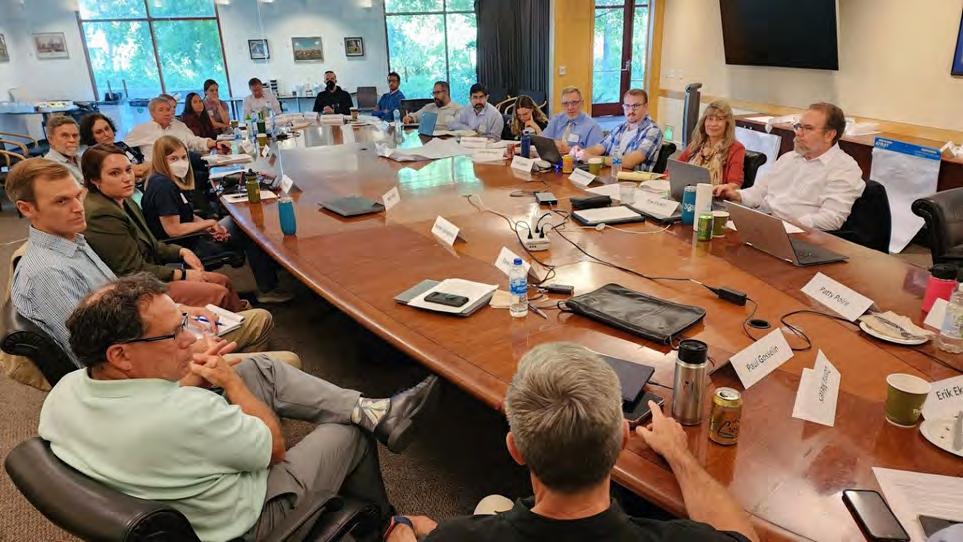
It would not be an exaggeration to say that when it comes to water and especially groundwater, California faces some of the most challenging problems in the world today. The Governor’s Water Resilience Portfolio1 and the recent Water Supply Strategy2 provide the blueprint for the state to tackle many of these challenges. These documents formed the backdrop for the Groundwater Resources Association’s (GRA’s) Contemporary Groundwater Issues Council (CGIC3) annual workshop held at the University of California, Davis on October 4, 2022. With the theme of “SGMA and the Governor’s New Water Policy – Challenges and Hope in a Climate of Drought”, the CGIC workshop took on some of the most pressing water availability, reliability, and sustainability concerns pertaining to the implementation of the Sustainable Groundwater Management Act (SGMA). The workshop provided a forum for leading voices from across the water world to come together and
brainstorm solutions to California’s groundwater challenges. Workshop participants included about 30 executives and leaders from State agencies, water districts and utilities, groundwater sustainability agencies (GSAs), non-profit organizations, academia, research institutions, and consulting firms from across the state. Several GRA Board and Executive Team Members also participated in the event. The focus was to discuss how the California Water Supply Strategy sets forth initiatives to better prepare for and adapt to hotter, drier climate and extreme precipitation events, and to implement steps towards modernizing water infrastructure and management.
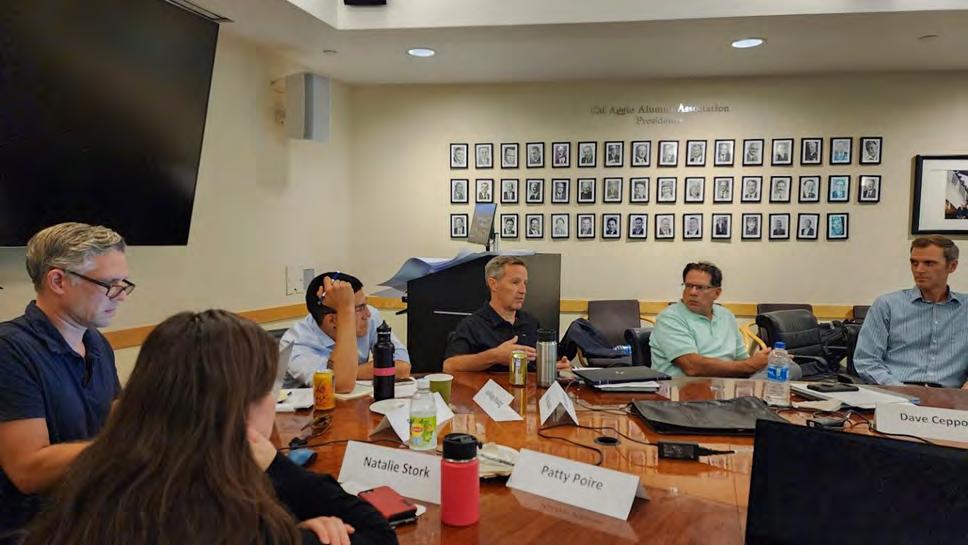
The full-day workshop was split into a morning session, consisting of a moderated panel followed by a roundtable discussion, and afternoon sessions, consisting of three breakout groups focusing on key topics and themes. The morning panel brought together diverse perspectives from state and local agencies with panelists, including Paul Gosselin (Deputy Director of Sustainable Groundwater Management, Department of Water Resources

[DWR]), Erik Ekdahl (Deputy Director, Division of Water Rights, State Water Resources Control Board [SWRCB]), Patty Poire (Executive Director, Kern Groundwater Authority), and Donna Meyers (General Manager/ Executive Director, Salinas Valley Basin GSA). The panel was facilitated by Dave Ceppos (Consensus and Collaboration Program, California State University, Sacramento) and dug deep into what SGMA and the Governor’s New Water Policy mean from a regulatory, policy, and implementation standpoint in a changing climate.
Key takeaways from the panel discussion and the follow-up roundtable discussion included the on-going impacts from Climate Change, the importance of recharge for groundwater sustainability, streamlined permitting for surface water diversions for recharge projects, state and local funding for implementation of groundwater sustainability plans (GSP), the necessity of demand management for long-term sustainability in overdrafted basins, the nexus between groundwater quality and land use, and the importance of coordination between GSAs and Counties over land/water-use changes that will need to be made to manage demands and improve long-term groundwater quality. The panel acknowledged the importance of California’s diverse economy and expressed confidence that this condition can be preserved in a future with less water through creative and collaborative solutions. All agreed that given sufficient information, planning time, and flexibility, farmers can adaptively manage agricultural land use within the available water while optimizing economic returns. The panel
also emphasized that the SGMA planning process is adaptive and GSPs will evolve and be refined as more data are collected, more stakeholders get involved, and more technical assistance and guidance are provided by DWR and the SWRCB. Stakeholder communication along with good data and science will be instrumental in implementing future adaptive management strategies.
The afternoon sessions consisted of three parallel discussion groups organized by themes: Policy and Statewide Planning, Technical Issues and Funding, and Demand Management and Recharge. Each group went through three rounds: initial brainstorming, idea consolidation, and finalizing recommendations for report-outs.
The “Policy and Statewide Planning” group highlighted the importance of alignment between various State and local agencies on the overall approach to groundwater supply management. It was recommended that GRA weigh in on Executive Orders (EOs) such as the 2022 EO on well permitting (N-7-22) and the next Bulletin 118 update. GRA could provide value to the community by considering local basin-specific workshops or events that can help the stakeholders understand groundwater quantity and quality issues and highlight necessary regulatory changes for SGMA implementation. The group emphasized the need to look beyond local jurisdictional boundaries and drive analysis, planning, and implementation efforts across multiple subbasins and watersheds.
The “Technical Issues and Funding” highlighted the following areas where additional advances are needed on the technical front: climate change impact assessments, interconnected streamflow depletions, subsidence monitoring and modeling, and cross-basin coordination, and water-budget analysis. On the funding front, there was general acknowledgment that while State and federal funding will help, GSAs need to start evaluating local funding approaches (the point being made that, “local control also means local funding”). Water trading was highlighted as an economic tool to ease the costs of near-term water cutbacks and support long-term shifts in water use patterns. GRA could help provide insights on what grants/technical assistance can be provided by the State and the level of funding necessary for implementing projects and management actions at the local scale. The group saw tremendous value in GRA collecting and presenting “SGMA success stories”, be it in technical analysis, fee and funding approaches, trading platforms, or stakeholder coordination.
The “Demand Management and Recharge” group recommended that GRA provide insight to pumpers on the trade-offs between meters and remote-sensed approaches to estimating pumping. Local workshops and/or successful case studies on demand management and recharge projects will be of value through the SGMA implementation phase. The group also touched on the need for more regional recharge, storage, and trading platforms. GRA could support the statewide prioritization for both surface-water and groundwater storage projects. The GSAs would also benefit from monitoring facilities, tools, and techniques to better estimate subsurface flows (at the GSA scale) as these have an important bearing on sustainable yield determinations.

All groups recommended, that given GRA’s initiative on Diversity, Equity, and Inclusion (DEI), equity and environmental justice aspects of groundwater policy, planning, SGMA implementation, and funding decisions would be key areas for GRA consideration. The workshop concluded with an acknowledgment of the challenges involved in SGMA implementation but also renewed enthusiasm for the work that lies ahead where collaboration and creativity can strengthen California’s path to groundwater sustainability. Key recommendation from the CGIC workshop were summarized and communicated to the GRA Board and committees to help plan for and formulate GRA’s events and activities, including the Law and Legislative Forum, the Annual GSA Summit, the Annual Western Groundwater Congress, GRACasts, and other technical and legislative initiatives. The CGIC planning committee is currently scheduling the next CGIC annual workshop for October 27, 2023, at UC Davis. We look forward to bringing back leading voices from the groundwater community to ensure GRA brings value to this community as GRA strives towards its vision of “Groundwater Sustainability for All”.
References:
1. https://resources.ca.gov/Initiatives/Building-Water-Resilience/ portfolio
2. https://resources.ca.gov/-/media/CNRA-Website/Files/ Initiatives/Water-Resilience/CA-Water-Supply-Strategy.pdf
3. https://www.grac.org/contemporary-groundwater-issuescouncil/
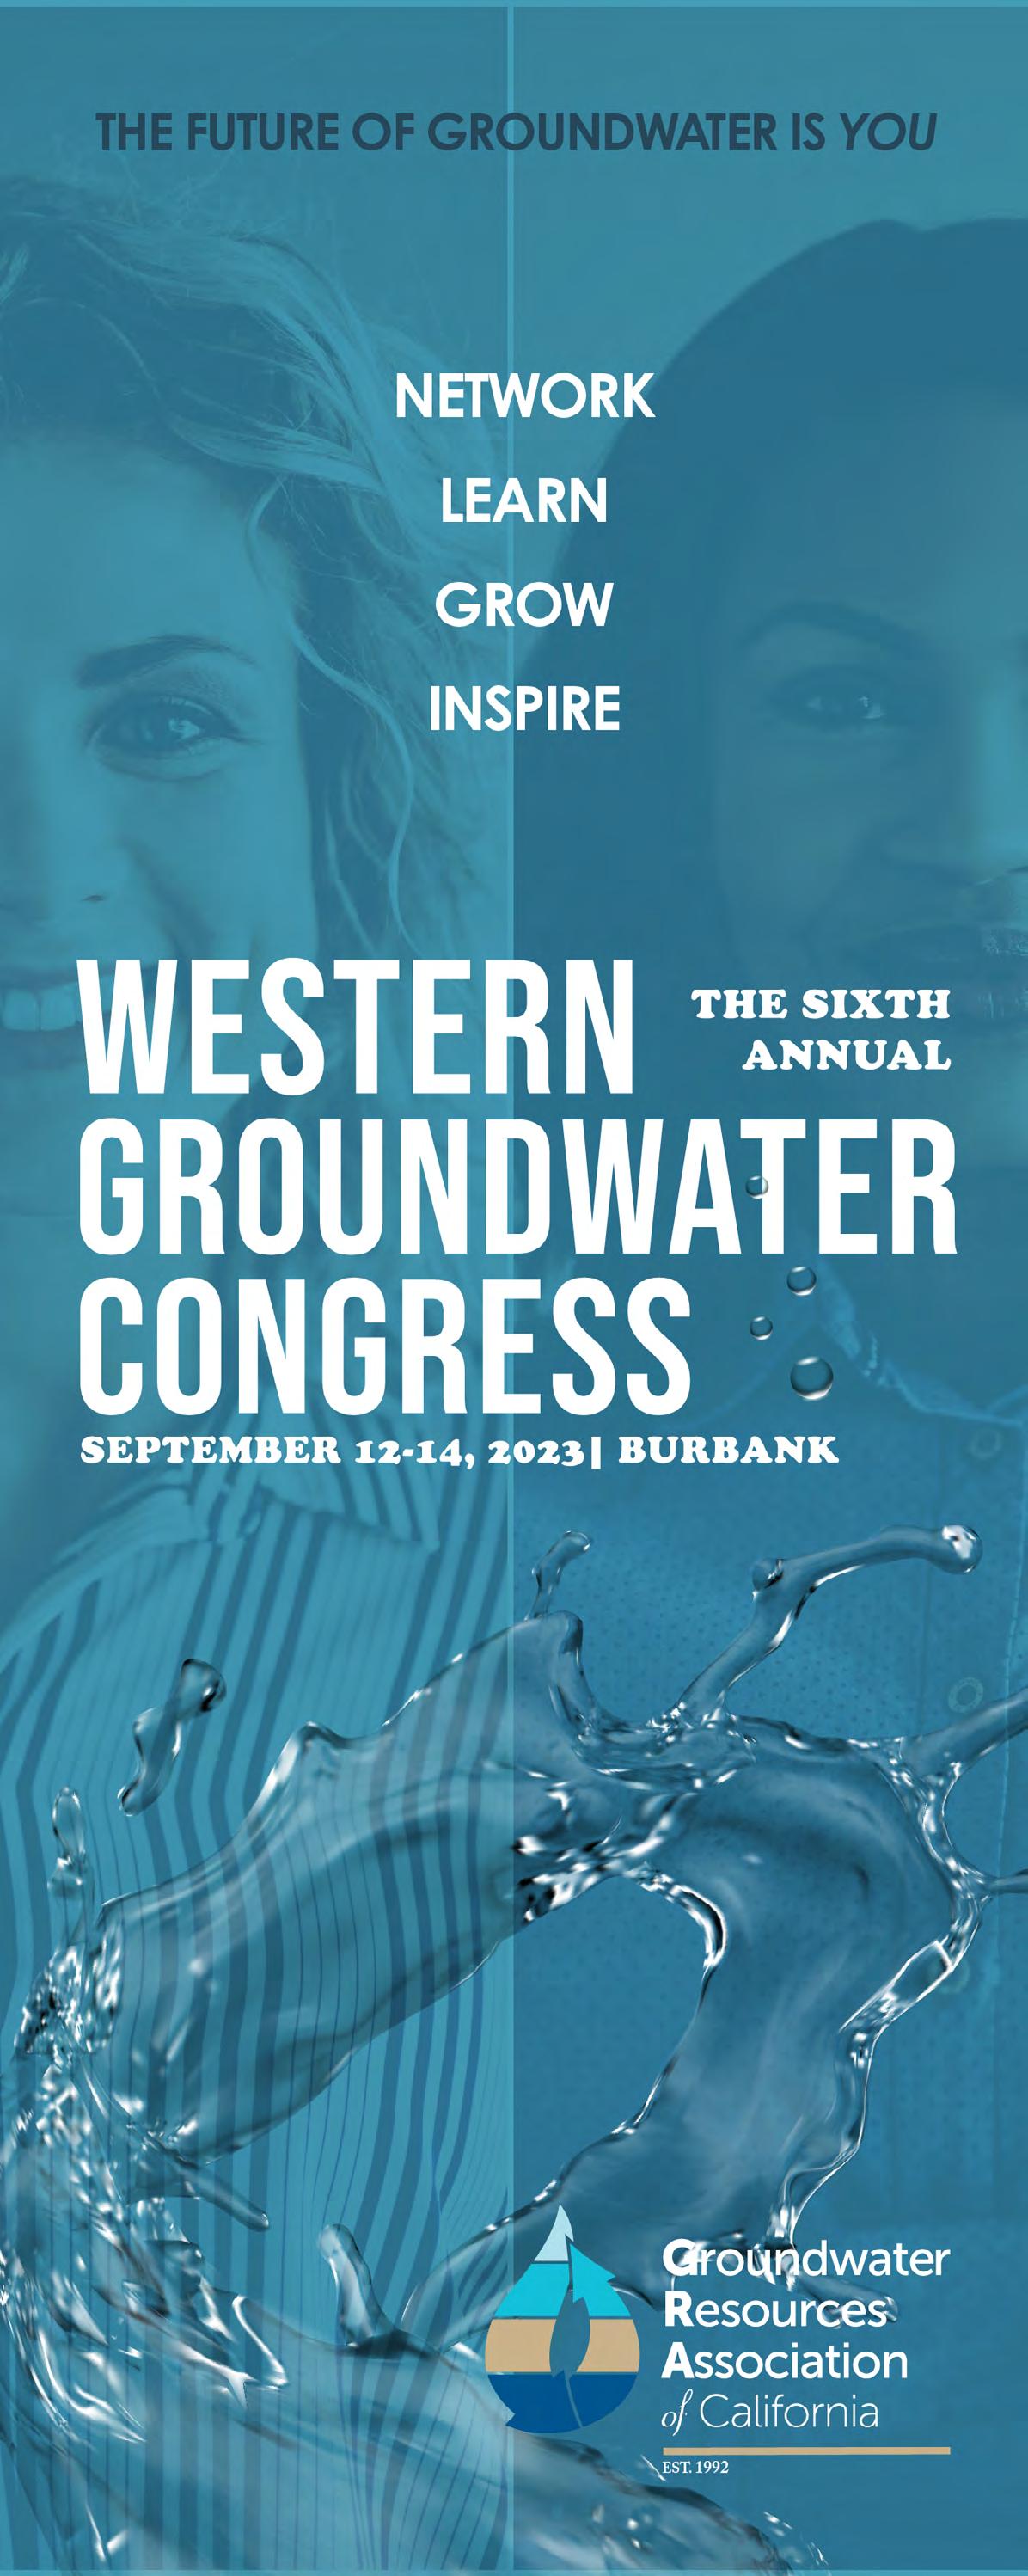
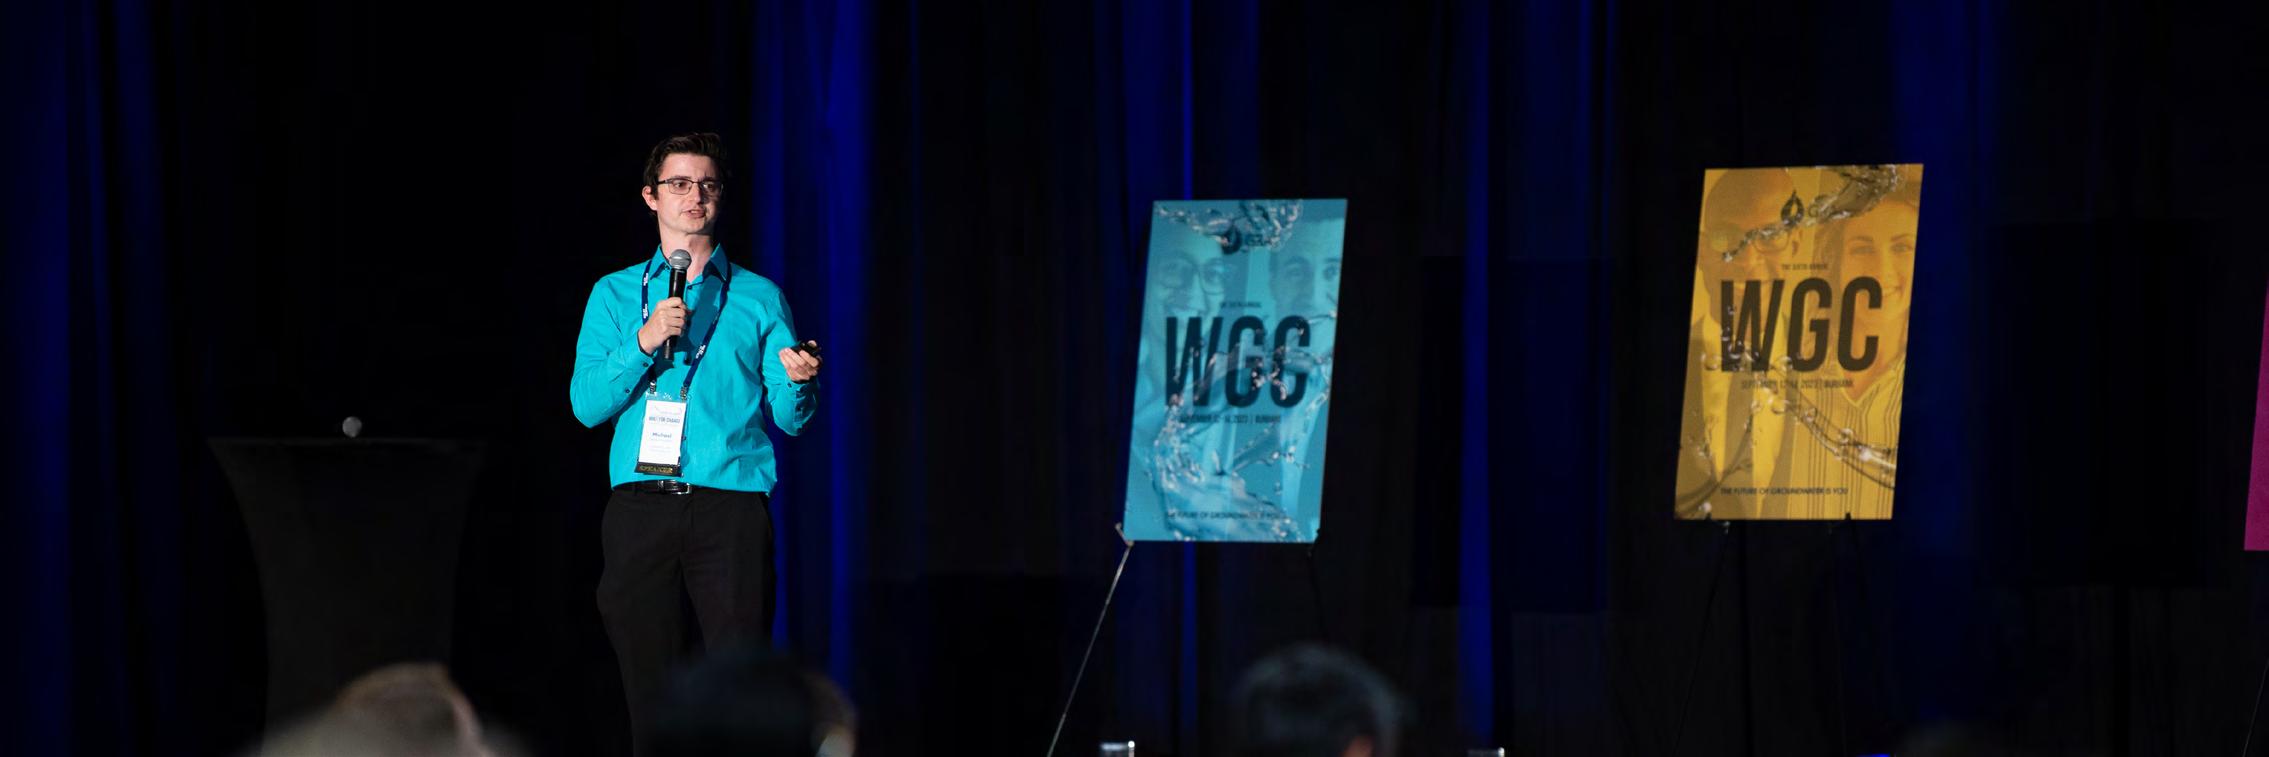
Karlee Liddy is in the second year of her master’s degree program in Coastal Science & Policy at UC Santa Cruz. She is a Repass-Rodgers Salmon Restoration Policy Fellow, and has geared her capstone project towards improving the health of California’s groundwater dependent ecosystems and species. In September 2022, she had the opportunity to present her topic “Deepening considerations for listed species in Groundwater Dependent Ecosystems” at the Western Groundwater Conference (WGC) and we decided to get her perspective on her experience through a small interview. We hope that students who are considering participating in GROUNDWATERx will feel inspired to submit an abstract for the 2023 WGC.
1. How did you hear about GROUNDWATERx?
Both my academic advisor at UC Santa Cruz, and my mentor for my capstone project told me I should attend the GRA conference in Sacramento. As I looked through the agenda for the Western Groundwater Congress, I realized there was an opportunity to submit a short abstract, and to share my current research with leaders in the water/land management space.
2. What was it like participating in GROUNDWATERx and attending the WGC?
Attending WGC was an encouraging and affirming experience. I had seemingly unlimited opportunities to approach and learn from folks who represent a myriad of opportunities in the water management space. Though I was nervous to speak in front of some 200+ water professionals, I felt confident that I had concisely


and clearly articulated the goals and importance of my master’s project. I came away from the experience with a rejuvenated sense of confidence, and with several business cards in hand!
3. Did you hear from any agencies/companies after participating in GROUNDWATERx?
Yes, I did. I was diligent in reaching out to folks, and have kept in contact with them as I search for my next career move.
4. What’s the number one reason you think a student or recent graduate should participate in GROUNDWATERx?
The number one reason I think a student or recent grad should participate in GROUNDWATERx is for the exposure and opportunity to network. Not only is it an excellent practice in science communication, but the audience felt extremely welcoming and encouraging. Partner organizations and consultant leads demonstrated a willingness to hear from and engage with early-career students that I have not otherwise experienced.
5. Anything else you would like to add?
I deeply appreciate the responsiveness and attention from each member of the GRA team. Managing water ultimately means managing people, and I feel that GRA’s leadership understands that valuing people is essential to achieving progress towards equitable water management.
We’re happy to hear that Karlee had a positive experience and we hope that other students and recent graduates will join us to participate in GROUNDWATERx. We hope to see you all there!
The next GROUNDWATERx event will be at the Western Groundwater Congress, September 12th through September 14th at the Los Angeles Marriott Burbank Airport Hotel in Burbank, CA. Please visit https://www.grac.org/events/453/ for more information.

*NOTE: GROUNDWATERx is changing its name to the Student Networking and Participation Program (SNAPP), and student presentations at future WGCs will be called SNAPP Talks.
 by Karlee Liddy, UC Santa Cruz
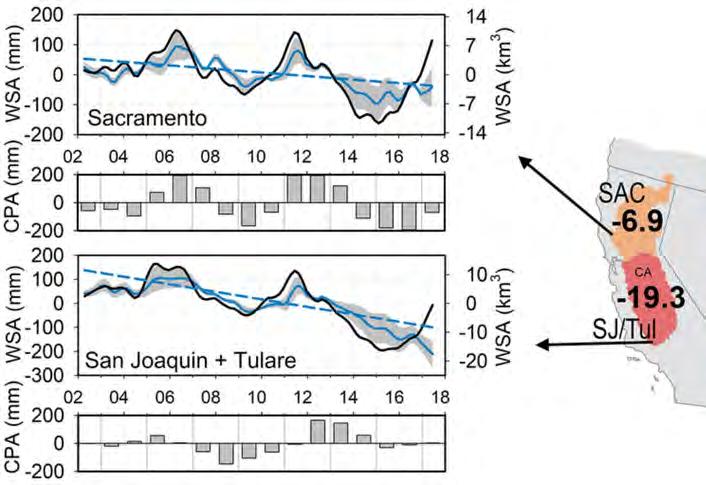
Due to increasing demand, depleted storage, and historic drought, groundwater is in peril in California11 (Figure 1). To govern its sustainable use and reliability, the Sustainable Groundwater Management Act (SGMA) was signed into law in 2014. Historically, groundwater and surface water have been managed separately in California: an approach that neglects hydrologic connections and flows between surface and subsurface water reservoirs15. SGMA is the first statewide legislation that explicitly recognizes surface watergroundwater interactions, requiring that groundwater be managed to prevent depletions of interconnected surface waters. Interconnected surface water is typically a stream, pond, or wetland that is directly fed by and/or directly recharges shallow groundwater.
A groundwater dependent ecosystem (GDE) is a community of species that depend on the presence of shallow groundwater and/or surface water-groundwater exchange. When GDEs are present, excessive groundwater pumping may reduce surface water-groundwater exchange and degrade habitat conditions15,18. While SGMA poses no legal obligations to protect or restore GDEs, it does require that groundwater sustainability plans (GSPs) identify and consider the impacts of groundwater use on GDEs13. Though many GSPs identify GDEs within basin boundaries, some GSPs did not sufficiently address impacts of groundwater use on those ecosystems and species15. Conversely, some groundwater sustainability agencies (GSAs) have leveraged the opportunity and authority to improve conditions for GDEs and species through collaborative projects.
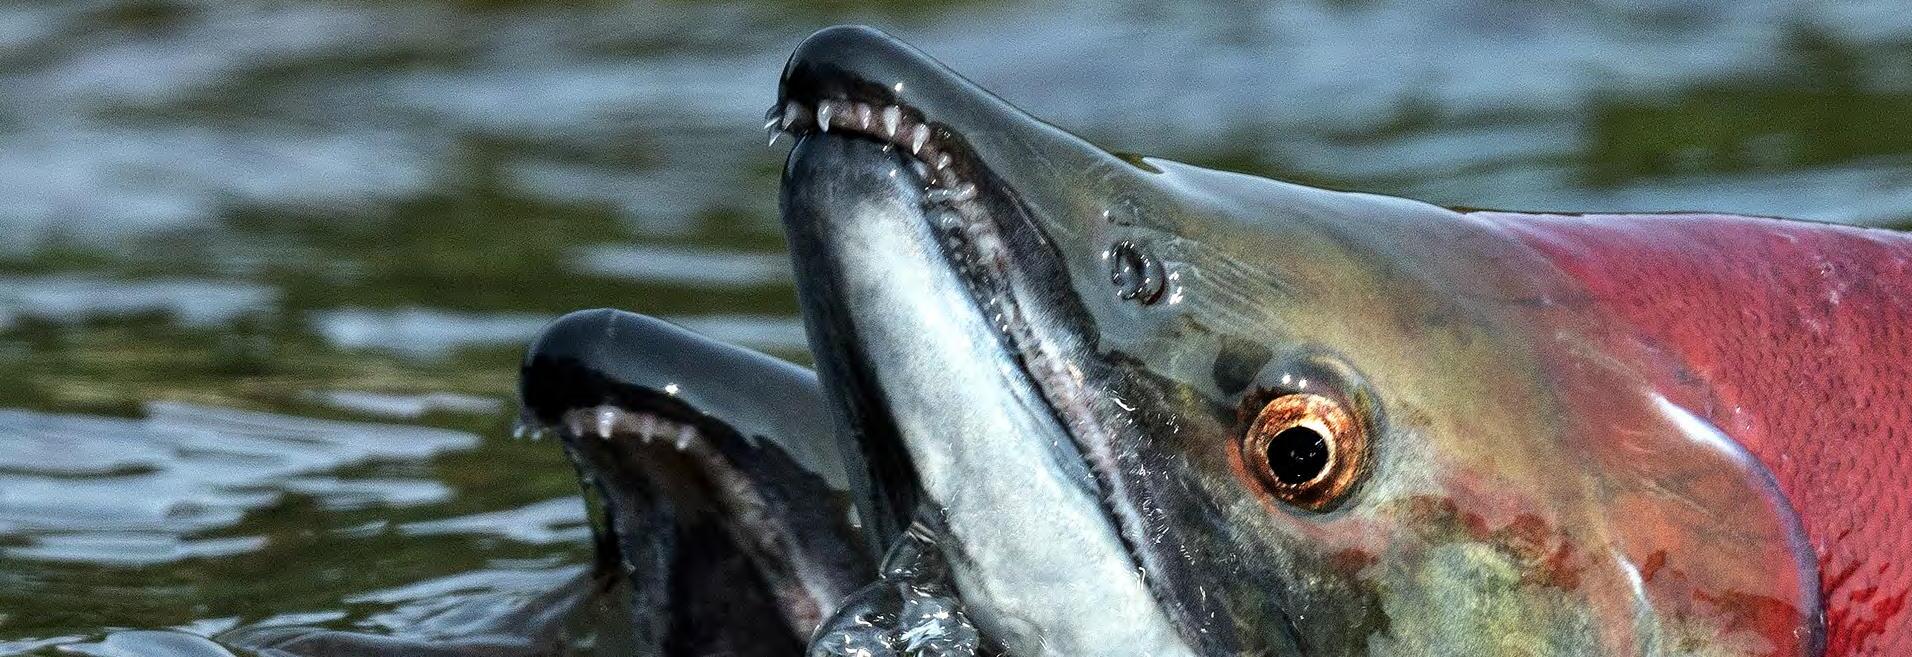
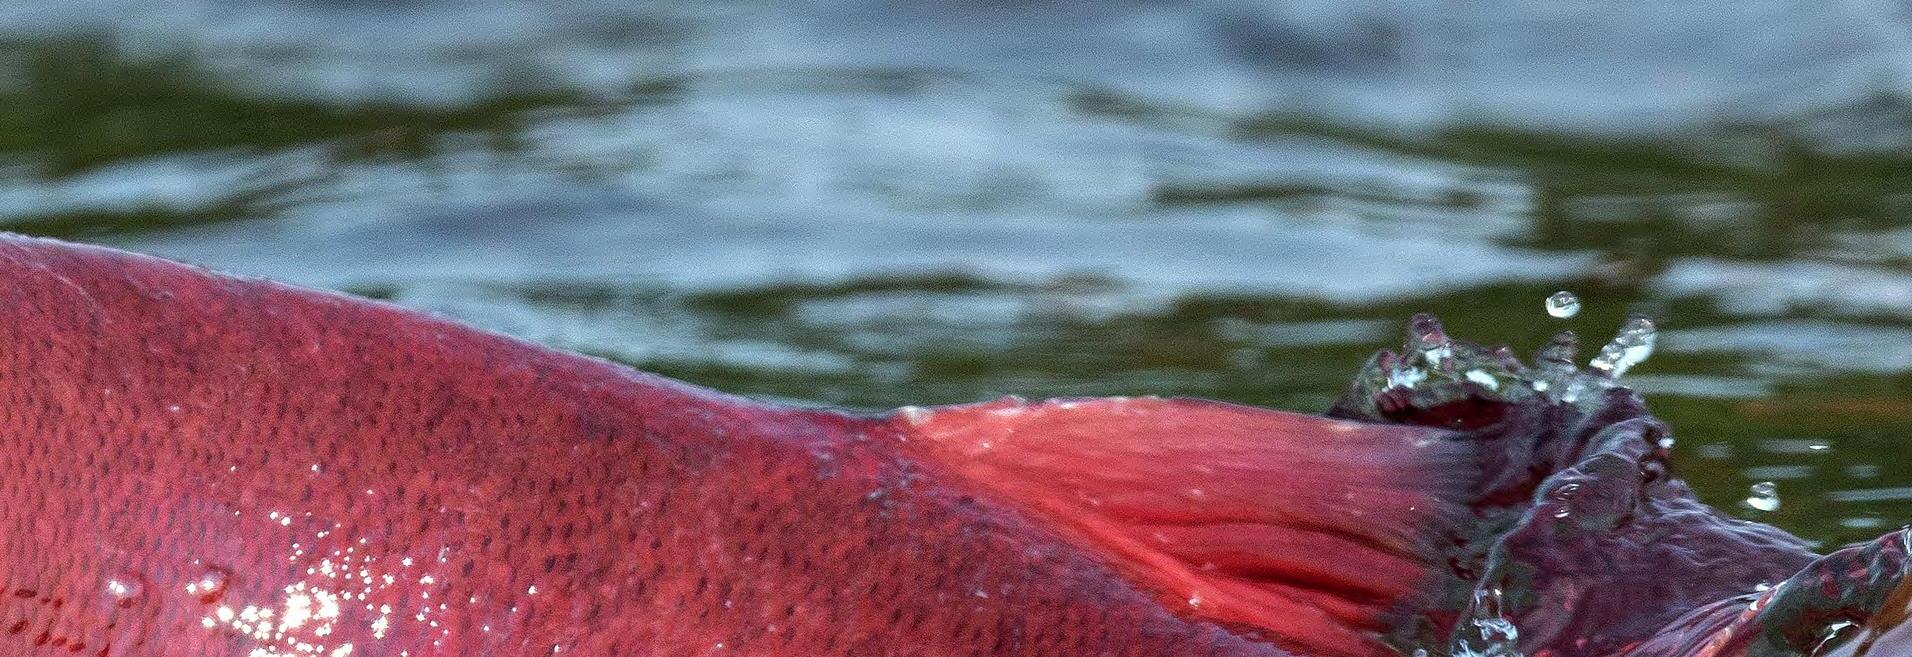
Significance of the Pacific salmon species Salmon are indicator species, meaning their abundances can help determine the health and stability of a stream or watershed. They are deeply rooted in the identities, livelihoods and cultures of California’s Indigenous groups, and also hold significant value to commercial and recreational fishers. As a sea-going species, they provide marine nutrients to freshwater ecosystems when they return to spawn and reproduce. The ability to migrate between the ocean and freshwater habitats to meet the needs of different life stages creates immense resilience in Pacific salmon species. They require cool water temperatures to survive through those diverse life histories, with a typical upper temperature limit of 20- 25oC 12. Despite their resilience, Pacific salmon are increasingly threatened by rising stream temperatures, predation, and lack of suitable habitat due to land use changes and extensive groundwater pumping, especially in California’s Central Valley.
Indirect groundwater needs for salmon
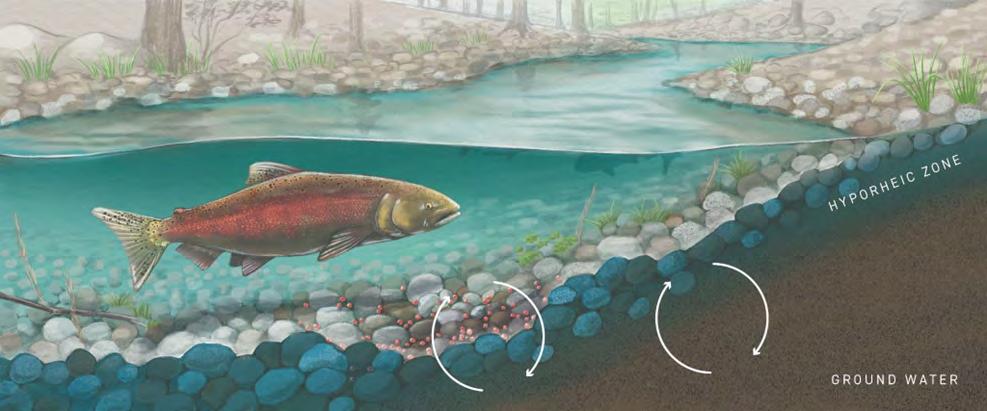
Pacific salmon are highly migratory species that rely on groundwater directly and indirectly through space and time. Groundwater provides nutrients and water to the roots of vegetation that make up and support connected riparian habitat. The vegetation along the bank of a river or stream provides shade and leafy debris, which moderate surface water temperatures, provides protection for small fish, insects, and other creatures that form the basis of their food chain. Complex root systems of trees and shrubs provide bank stabilization and can prevent excessive erosion and sediment accumulation during high-precipitation events. Woody debris, exposed roots, and undercut banks also help create channel complexity, including backwater pools and areas of elevated water that can drive surface water-groundwater exchange.
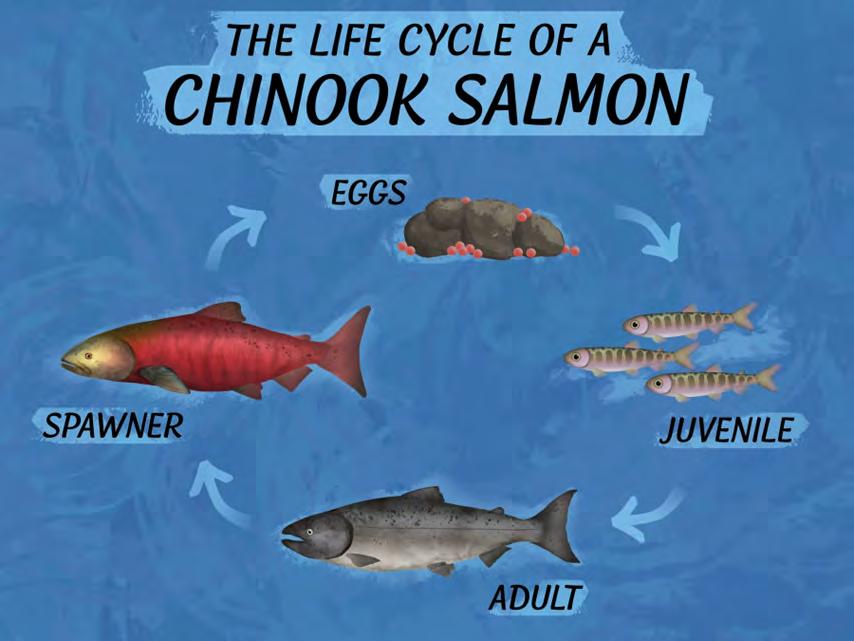
The hyporheic zone is where shallow groundwater and surface water mix. A stream channel (Figure 4) contains this mixing zone, which is a unique environment containing distinctive and abundant aquatic biota7. Pacific salmon lay their eggs in streambed nests called redds. The eggs require cool, consistent flows to receive oxygen throughout the 6- to 20-week incubation period. Though groundwater is generally cooler than surface water in the summer, it can also moderate cold stream temperatures in the winter3. This thermal exchange helps sustain the optimal temperature for salmon eggs to incubate, hatch, and survive.
Juveniles also depend directly on thermal and nutrient exchange across the hyporheic zone, which serves as a buffer to maintain desirable conditions. Across connected stream reaches, groundwater can provide the minimum flows (baseflows) required for salmon to access upstream habitat as surface water levels drop during the summer months.
Groundwater also provides cold-water refugia when instream temperatures rise Moreover, juvenile chinook salmon have been observed burrowing into streambed gravel during the hottest parts of the day, where groundwater exchange moderates ambient river temperatures of about 23oC to a more suitable 16-17oC 3
Adults and spawners depend directly on cool groundwater exchange to maintain low metabolic rates, allowing them to direct the bulk of their energy towards migrating to spawning grounds2. Adults returning to their natal streams to reproduce rely on groundwater-fed flows to provide “adequate water quality, temperature, and volume for upstream migration” before precipitation supplements and augments these flows13 Interestingly, it has been observed that groundwater- surface water dynamics can influence redd site selection3. In a Montana stream study, bull trout (Salvelinus confluentus) spawning was observed to increase in stream sections characterized by significant hyporheic exchange and upwelling1. This example highlights the importance of nutrient and thermal cycling for successful spawning.
Intensive channelization and levee construction across California has straightened meandering streams and effectively eliminated the hyporheic zone in large expanses of historic floodplain habitat. With it, humans have eliminated the channel’s capacity to moderate water temperature, and the availability of critical “holding habitats”, or thermal refugia, for native fish species2
Though groundwater agencies are required to identify GDEs within their basins, their plans may be insufficient in describing long-term impacts of groundwater use on these ecosystems15 Currently, monitoring wells that measure groundwater elevation and quality may not sufficiently represent critical connected habitats for native species. Some agencies plan to install more monitoring wells adjacent to riparian habitat, in order to better understand pumping impacts on connected surface water flows. Though hydrodynamic variability over space and time is typical for California watersheds, climate change and groundwater pumping have exacerbated impacts on groundwater-surface water connection. Negative impacts include the loss of proper temperature and flows that support ecosystem function, and even the disappearance of streams16 In response, species that require groundwater-surface water exchange, like Pacific salmon, may become locally extinct. Thus, it is now more important than ever to protect thermal refugia along connected rivers and streams, in order to secure the survival of California’s native fishes.
References
1Baxter, C.V. and Hauer, F.R. (2000). Geomorphology, hyporheic exchange, and selection of spawning habitat by bull trout (Salvelinus confluentus). Canadian Journal of Fisheries and Aquatic Science 57: 1470-1481.
2Berman, C.H. and Quinn, T.P. (1991). Behavioral thermoregulation and homing by spring chinook salmon, Oncorhynchus tshawyscha (walbaum), in the Yakima river. Journal of Fish Biology 39: 301.
3Douglas, T. (2006). Review of groundwater-salmon interactions in British Columbia.
For Watershed Watch Salmon Society. Canadian Electronic Library. Canada. https:// policycommons.net/artifacts/1186350/review-of-groundwater-salmon-interactions-in-britishcolumbia/1739478/
7Käser, D. (2010). A new habitat of subsurface waters: The hyporheic biotope (translation of Orghidan’s 1959 paper). Fundamental and Applied Limnology, 176, 291–302. https://doi. org/10.1127/1863-9135/2010/0176-0291
11Raiteb et al. (2020). Comparison of Groundwater Storage Changes From GRACE Satellites With Monitoring and Modeling of Major U.S. Aquifers
12Richter, A., and Kolmes, S. A. (2005). Maximum Temperature Limits for Chinook, Coho, and Chum
Salmon, and Steelhead Trout in the Pacific Northwest. Reviews in Fisheries Science, 13(1), 23–49. https://doi.org/10.1080/10641260590885861

13Rohde, M.M., Seapy, B., Rogers, R., Castañeda, X., and editors. (2019). Critical Species LookBook: A compendium of California’s threatened and endangered species for sustainable groundwater management. The Nature Conservancy, San Francisco, California.
15Saito, L., Christian, B., Diffley, J., Richter, H., Rohde, M. M., & Morrison, S. A. (2021). Managing Groundwater to Ensure Ecosystem Function.
Groundwater, 59(3), 322–333. https://doi.org/10.1111/gwat.13089
16Stein, E. D., Zimmerman, J., Yarnell, S. M., Stanford, B., Lane, B., Taniguchi-Quan, K. T., Obester, A., Grantham, T. E., Lusardi, R. A., & Sandoval-Solis, S. (2021). The California Environmental Flows Framework: Meeting the Challenges of Developing a Large-Scale Environmental Flows Program. Frontiers in Environmental Science, 9, 481. https://doi.org/10.3389/fenvs.2021.769943
18Winter, T. C. (1998). Groundwater and Surface Water: A single Resource (UCGS Circular) [1139].
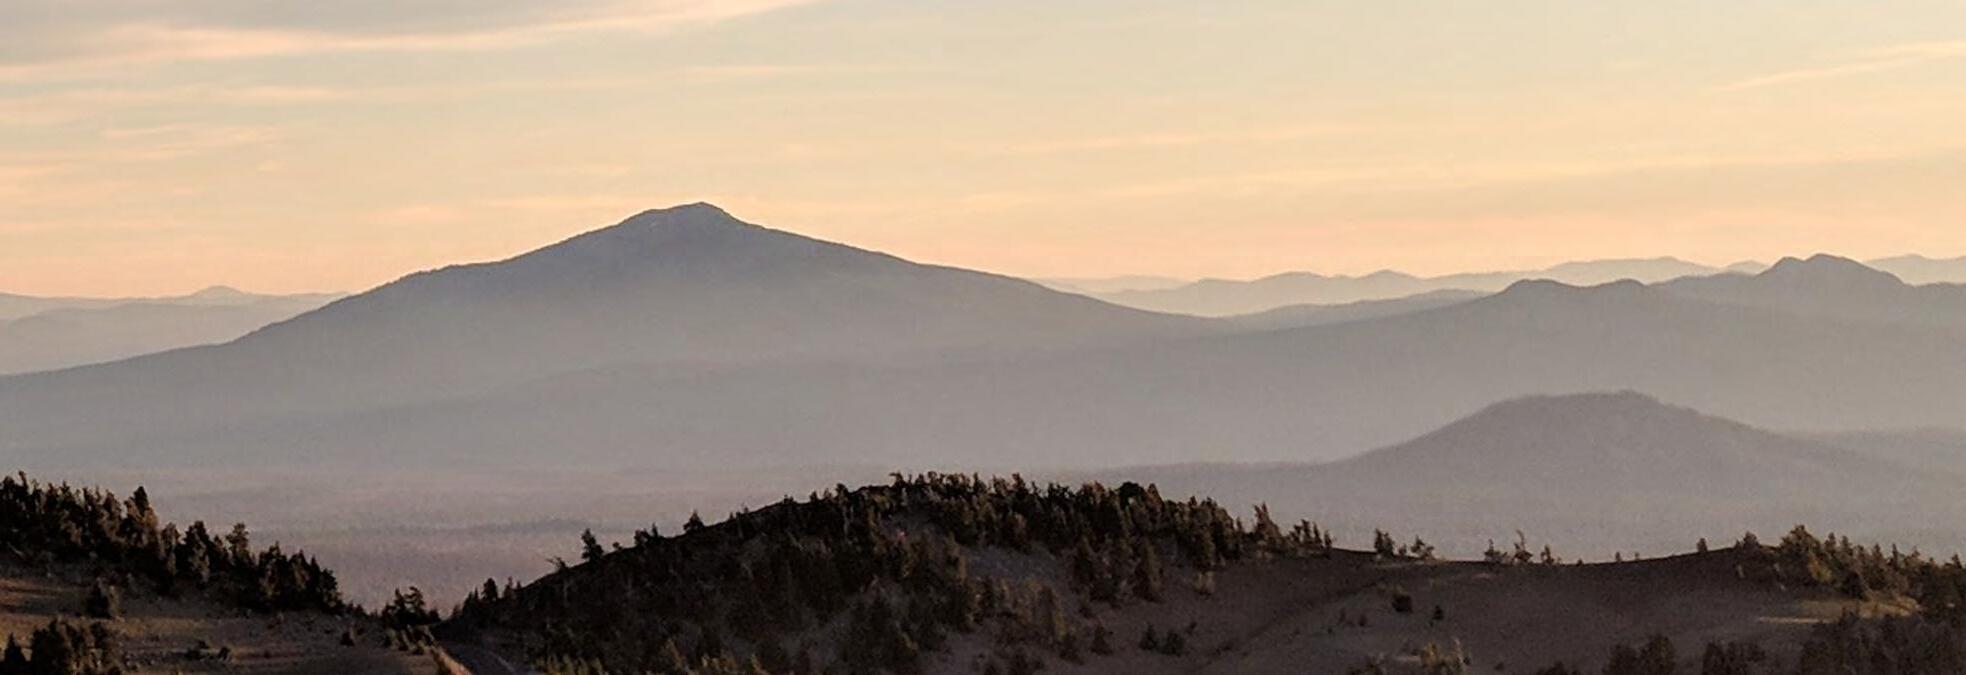
by Todd Jarvis, Director at Institute for Water & Watersheds Khaos has not always referred to disorder and confusion. Greek mythology identified Khaos as the first of the primordial gods to emerge at the dawn of creation. She was the goddess of air and the mother of birds. Later, classical authors respelled and redefined “chaos” as the “chaotic” mix of elements that existed in the primordial universe. The Klamath Basin serves as a type example of both uses of Khaos and chaos. Often referred to as the “Everglades of the West” and hosting the largest freshwater wetlands west of the Mississippi River and serving important habitats for migrating waterfowl and fish in the United States, the region has also long served as a media darling for the “water wars” narrative.
Research bears out the perception of equating the Klamath Basin to conflict. An event database determined the Klamath Basin had the highest number of conflictive events and was the only basin in Oregon in which conflictive events substantially outnumbered cooperative ones. The Klamath was also the only basin where extreme conflictive events occurred. The “water wars” narrative often poses two opposing sides, such as farmers versus fish, yet the story is more complex, with more than 60 groups of people who have an interest in the Basin’s water allocation1. Dam removal and related water pollution and water quality are important
issues often connected to fish mortalities, but the issues have become manifold with the prolonged drought and aridification, drying wells, supplied water to replace drying wells, accusations of groundwater mismanagement2, surface water-groundwater interaction studies and related lawsuits, and now the illicit extraction of groundwater for the $10B illegal cannabis market (estimated at $2B in Oregon, and $8B in California).
Part of the problem is the Klamath Basin is often referenced by the media as an autonomous geographic area with a single management structure, rarely mentioning that it is a transboundary basin shared between California, Oregon, and tribal governments. The recharge area for Klamath Basin groundwater starts at Crater Lake in Oregon, converging in the internally-drained lakes and rivers incised in volcanic rocks, ultimately discharging in Tule Lake Valley of northern California.
It is the heterogeneity and anisotropy inherent in the fractured volcanic rocks that contributes hydrogeologic complexity with respect to confidently assessing groundwater flow, storage, and hydraulic connection to surface water. As a transboundary river and groundwater basin, a major source of the Klamath’s water problems is that Oregon’s water rights laws don’t mesh well with California’s water rights laws. Despite these legal differences separated by a thin line on a map, Oregon water regulators have found fault with California water regulators on how groundwater is managed in the Tule Lake area underscoring the tension between transboundary water users in the chaos zone of complexity science.

A less well studied narrative, yet fueling a powerful identity-based conflict, the Klamath Basin has also been the region of secession efforts described by Oregon historian Jeff Lalande3 to include the State of Jefferson, State of Shasta, and most recently Greater Idaho. LaLande describes one of the tenets of the proposed State of Shasta in the 1950s was to protect the region’s water rights. The Greater Idaho proposal of 2022 notes that Oregon has resources that would “be highly beneficial to Idaho,” such as timber, minerals, and water.
Decades of water
Generalized water-level contours and approximate directions of regional ground-water flow in the upper Klamath Basin, Oregon and California (USGS image).
negotiations in Klamath Basin have focused on the largest dam removal project in the United States. In a nod to Klamath Khaos, tribes and government hail the removal of four dams in one week; the next week the honeymoon is over because the federal government wants to reduce flows in the Klamath River to keep Upper Klamath Lake full. And no good water crisis should go to waste, with water storage serving as the inspiration for clever entrepreneurs such as the Oregon Water Train who propose to fill Upper Klamath Lake through a 10 million gallon per day water-by-rail scheme.
Many well owners in the Klamath Basin are experiencing drying wells. Water levels in wells monitored by the US Geological Survey on both sides of the California-Oregon border declined 6 to 90 feet over the past 20 years, in extreme cases requiring water to be trucked in and stored in tanks at approximately 300 homes. The paucity of well drillers in the region has led to Klamath Community College offering a new well drilling program. But if water storage for later recovery is part and parcel of resolving a water war, why not consider opportunities for aquifer storage and recovery (ASR)?
The Bureau of Reclamation completed investigations for offstream storage in the Upper Klamath Basin that included direct injection and indirect infiltration methods. Few of the identified locations in Oregon were considered potentially viable except for areas near Gerber Reservoir. However, areas near Clear Lake and Tule Lake in California were identified as possible locations for further studies, with the Tule Lake site as the best candidate for ASR4 using either deep well injection or surface infiltration methods.
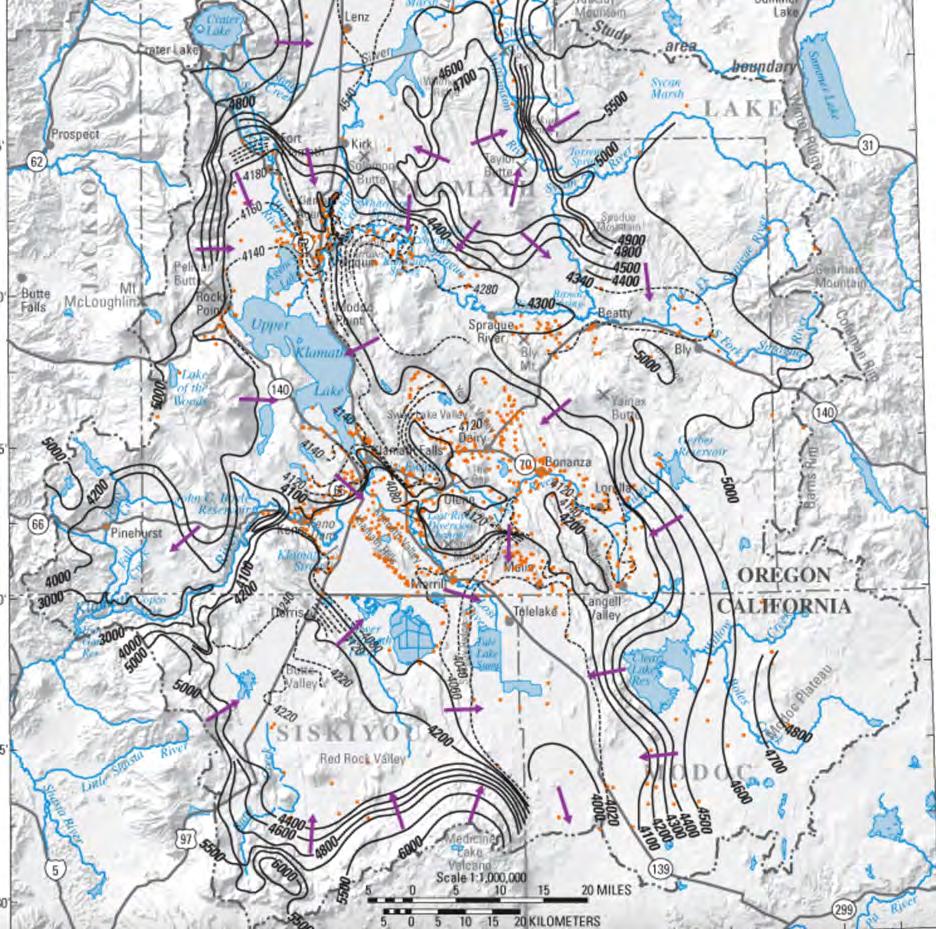
As the goddess of the air and mother of birds, Khaos informs responses to chaos in the Klamath Basin. Dessicated lakes and dried out farms sully the air of business ecosystems and environmental ecosystems alike. The perceived water wars provide an opportunity to “clear the air” as exemplified by the documentary video on the Klamath River - A River Between Us. The seemingly chaotic hydrogeology and diverse values associated with both surface water and groundwater that have led to perpetual conflict indicates actions taken in a chaos situation by decisionmakers needs to “stanch the bleeding” by acting, quickly and decisively, to reduce the turbulence. The Klamath Basin can learn much from other basins in the world experiencing comparable struggles with the delicate balancing act of water for drying lakes, water for fish and fowl, and water for food. And the world can learn from the many stories and identities connected to water in the Klamath Basin, where the intimate connection between surface water and groundwater indicates action taken on one part of the hydrologic cycle will affect all.
References:
1. Whitley, H. 2022, The Klamath Basin Is Not a Lost Cause: Controversy and Compromise in One of America’s Most Contentious Watersheds, Water Resources IMPACT, Vol. 24, No. 5, pp. 22-26.
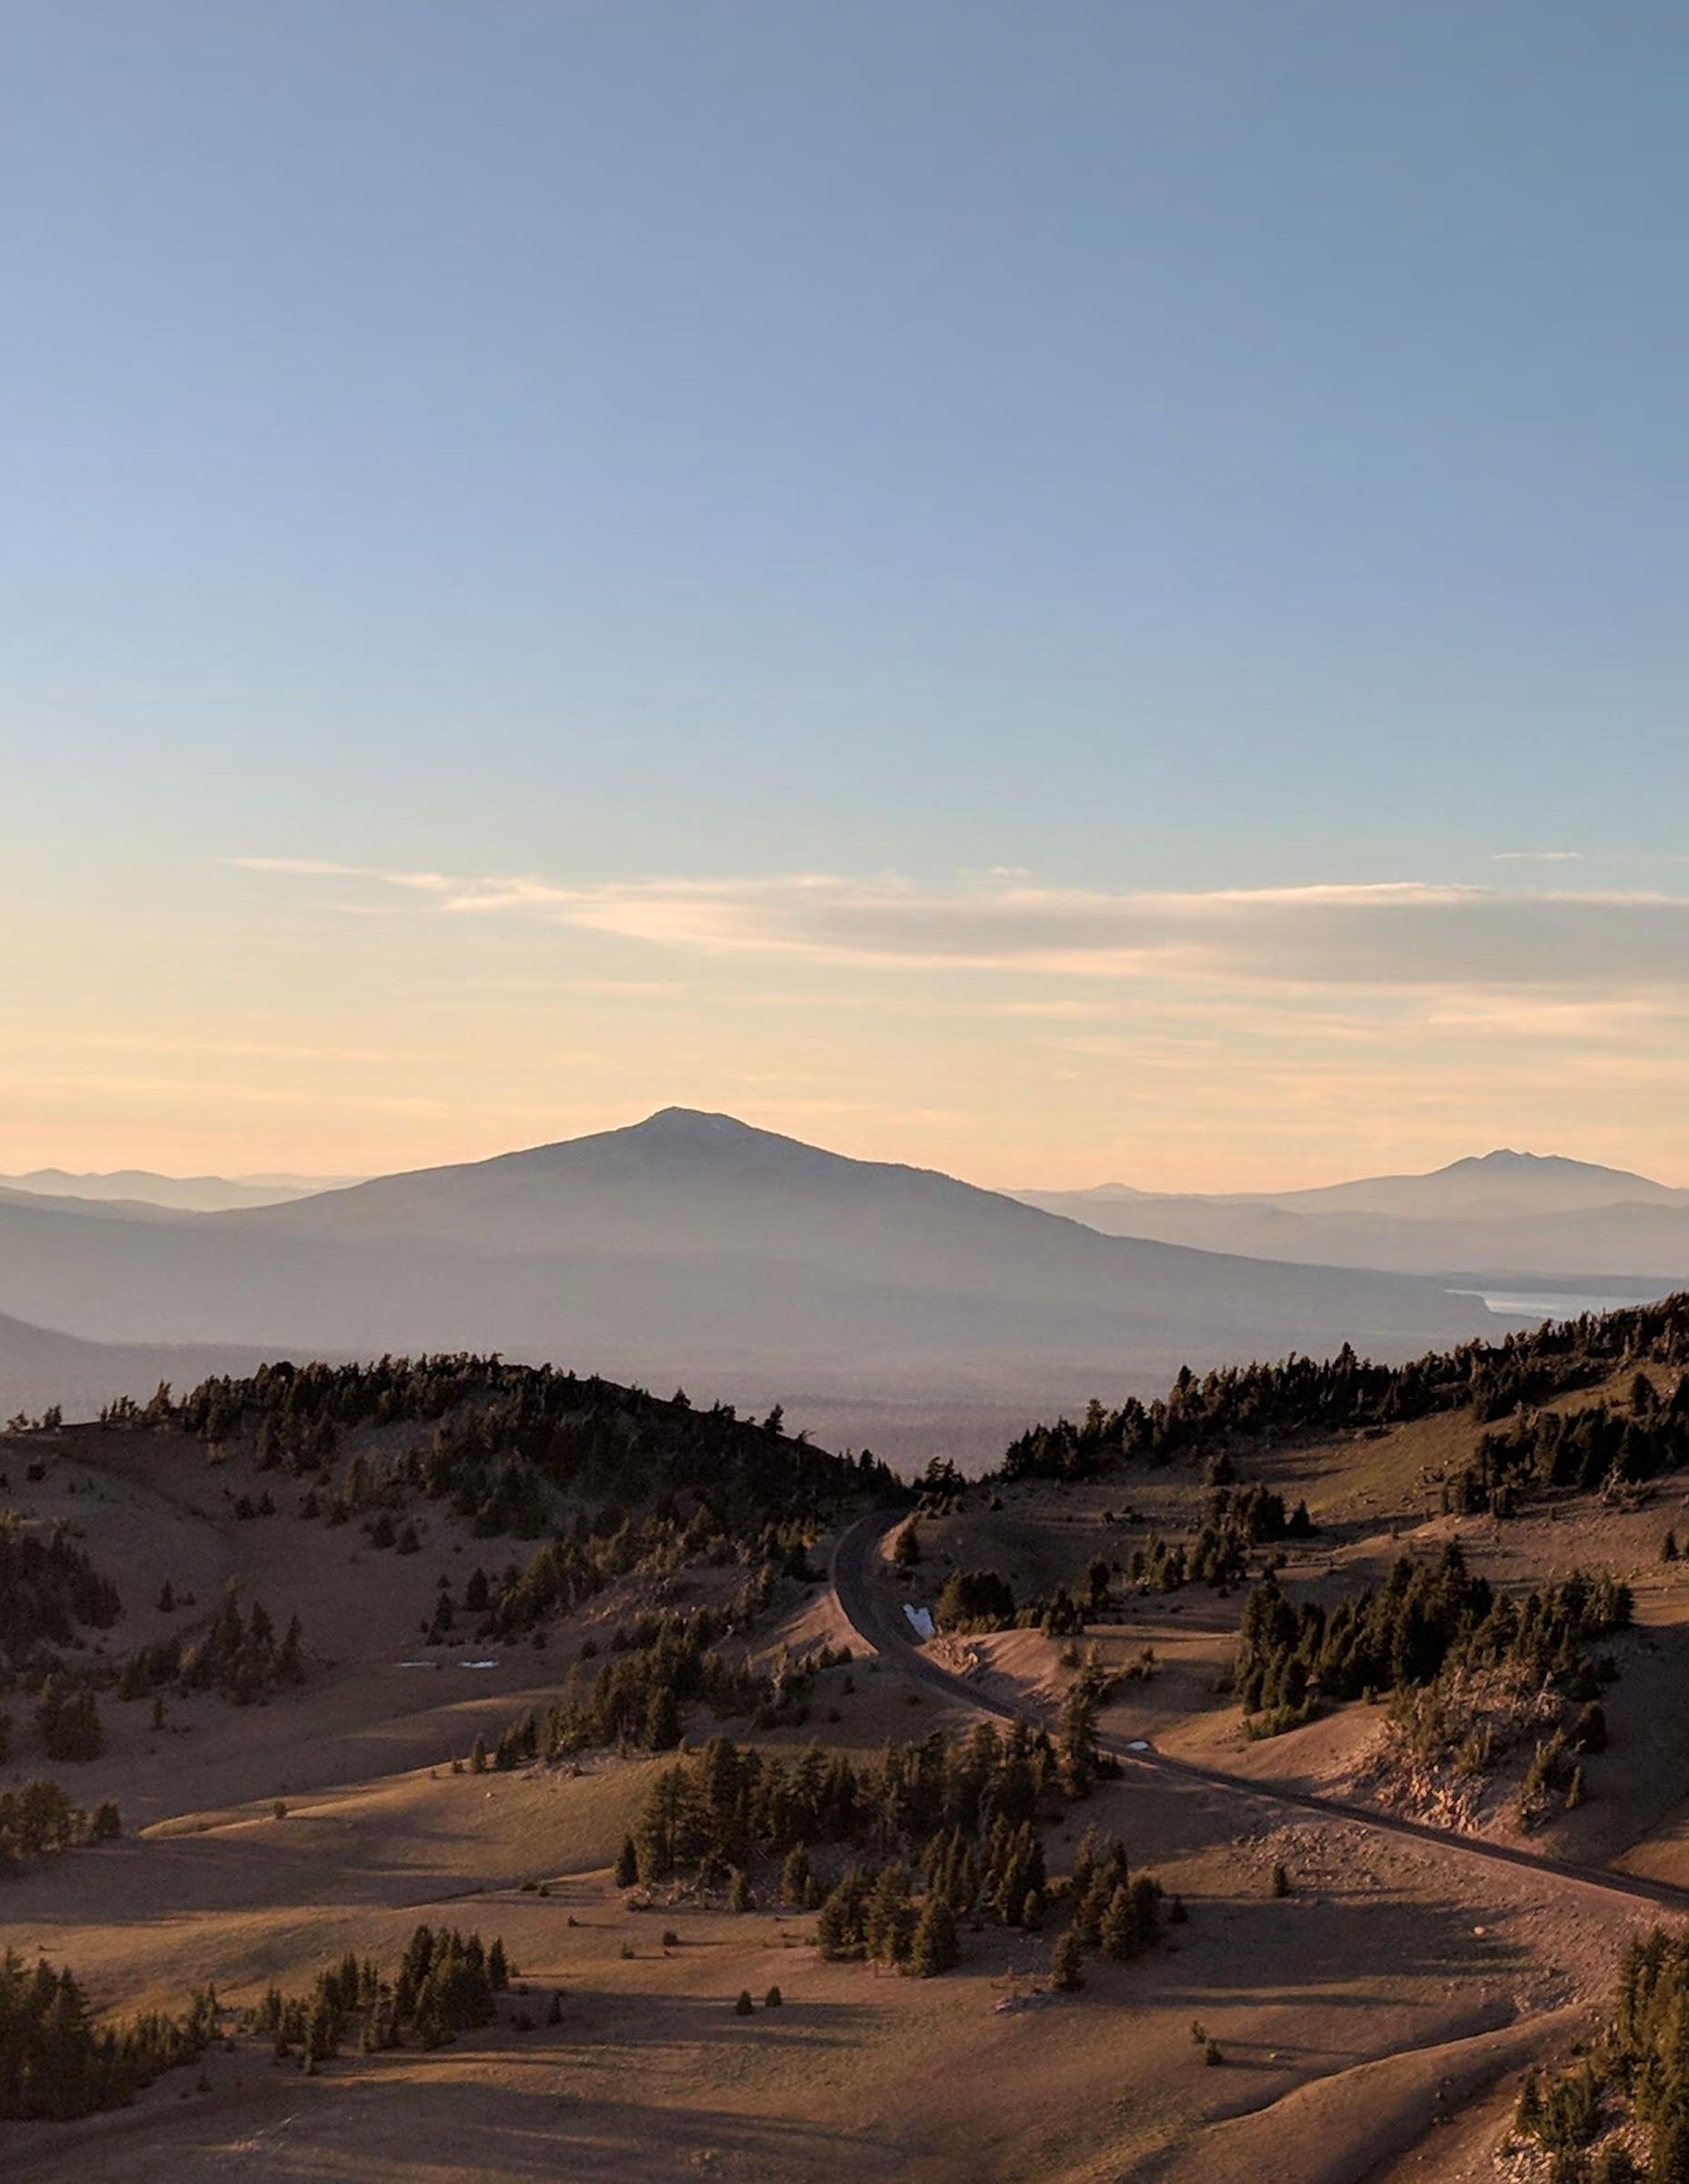
2. Smith, S. 2021, Too Little, Too Late: How California‘s Failure of Nerve Perpetuates Unsustainable Agricultural Pumping and Water Injustice, Water Resources IMPACT, Vol. 23, No. 3, pp. 17-19.
3. Lalande, J., 2017, “The State of Jefferson”: A Disaffected Region’s 160-Year Search for Identity, Oregon Historical Quarterly. Spring 2017, Vol. 118, Issue 1, pp. 14-41.
4. Editor’s note: ASR projects in California are subject to General Order 2012-0010 from the State Water Resources Control Board, which requires the use of potable water for direct injection. Other sources of injection water are available and would be subject to other state regulatory programs.
Groundwater Resources Association of California (GRA) is proud to announce the Call for Nominations for our 2023 Awards! Nominations open on April 3, 2023. Please nominate worthy recipients by April 24, 2023.
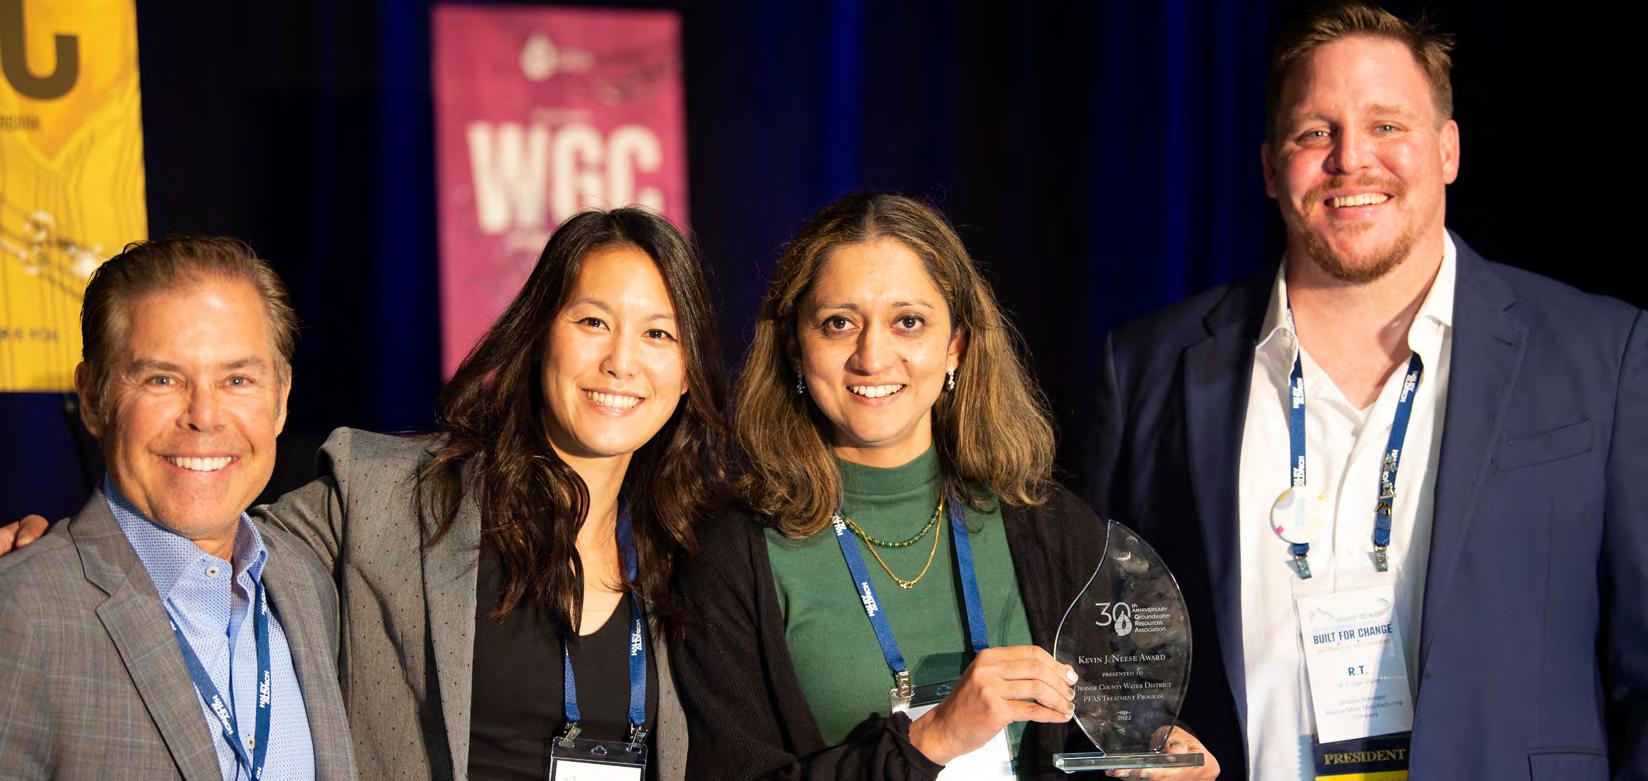
Think…is there a person or person(s) whose work and expertise has made a significant academic or practical contribution to the growth of the groundwater industry? Is there an entity that exemplifies the importance of groundwater protection and sustainability? Is there a project or initiative that displays technical complexity and innovation that advances groundwater knowledge and awareness? Or is there a rising star that will be a future leader in the industry? If so, please nominate recipients so that their positive impacts can be recognized! A list of 2023 awards is provided below.
I almost became a soil chemist; about an eon ago, when I was completing my Master’s degree. One of my thesis committee members was a soil scientist and he tried convincing me to major in soil chemistry. Alas (for him), I continued my geochemistry studies, but retain to this day a soft spot for soil and agricultural chemists. With California’s recent drought (even with the record-breaking precipitation, we’re still in a possible continuing drought), an understanding of salt impacts to our soils, surface water, and groundwater in agricultural and other areas of the state becomes exceedingly important. California has some of the west’s most saline impacted soils (Figure 1). California’s continuing drought and water crisis prompted the State Water Resources Control Board to issue a policy to increase supplies from other water sources such as recycled water (RW) (Motzer 2011 and 2012 and California Water Boards, 2023). Additionally, this policy requires completion of Salt and Nutrient Management Plans (SNMPs) by applicable local agencies to facilitate basin-wide management of salts and nutrients from all sources in a manner optimizing RW use. I’ll discuss SNMPs in more detail in a future article.
Salts are invariably added to soil with application of each irrigation supply. Generally, salt concentrations are lowest in precipitation and surface water such as streams, increasing in concentration in rivers and lakes (Table 1) and RW. Therefore, water derived from rivers and lakes can have significant salt concentrations and, when used for irrigation, such salts can impact crops by reducing crop yield. To determine water for crop usage suitability, water quality by chemical analysis of the dissolved salts becomes crucial. Because salts vary in any given surface water and groundwater type, they may be determined by sodium (Na+) and chloride (Cl–) or total dissolved solids (TDS) analysis or by measuring other parameters such as electrical conductivity (EC). Both TDS and EC are the most common methods for determining water salinity.
The transport and fate of salinity in infiltrating water through soil, rock to surface water and groundwater is largely governed by the amount of TDS, which is defined as the total quantity of solids in milligrams per liter (mg/L) or parts per million (ppm). Commonly, TDS is determined in the laboratory by evaporating a water sample and weighing the solid residue. However, it can also be calculated from a standard water analysis of the basic intrinsic cations (Ca2+, Mg2+, Na+, and K+) and anions (HCO3–, Cl–, SO42–, and NO3 ) then by summing the total cations and total anions. However, for greater accuracy, additional cations (e.g., Ba2+, Fe2+, and Mn2+) and anions (e.g., F– ) plus silica (SiO2) could also be included. Water quality classifications may be based on TDS and – although the definition of what is fresh versus saline, etc. varies in the literature – the most commonly used classification is from the U.S. Geological Survey (Table 2). TDS transport through soil is typically dominated by soluble anions (i.e., Cl–, SO42–, HCO3–, and NO3–) and these anions are not inhibited or retarded by soil sorption because soils have very little anion exchange capacities. Soil, however, may retain the cations (Ca2+, Mg2+, Na+, and K+), particularly if clays are present. Additionally, local surface water and related groundwater quality may be impacted by inflow of salts from surrounding geologic formations. For example, sedimentary rocks of marine origin and their residual soils have naturally deposited salts that can contribute to the genesis of the saline soils. Although at first minimal, such salt contributions may remain a factor because these salts tend to accumulate over time in crop root zones and thereby will also contribute to natural saline groundwater. Where soils contain extensive clay pans, shallow (perched) water tables predominate, particularly in areas having gentle to flat slopes. Generally, when the water table rises to within 5 or 6 feet of the land surface, groundwater tends to move upward via capillarity into the root zone and to the land surface. Under such conditions, groundwater and irrigation water will both contribute to the soil salinization.
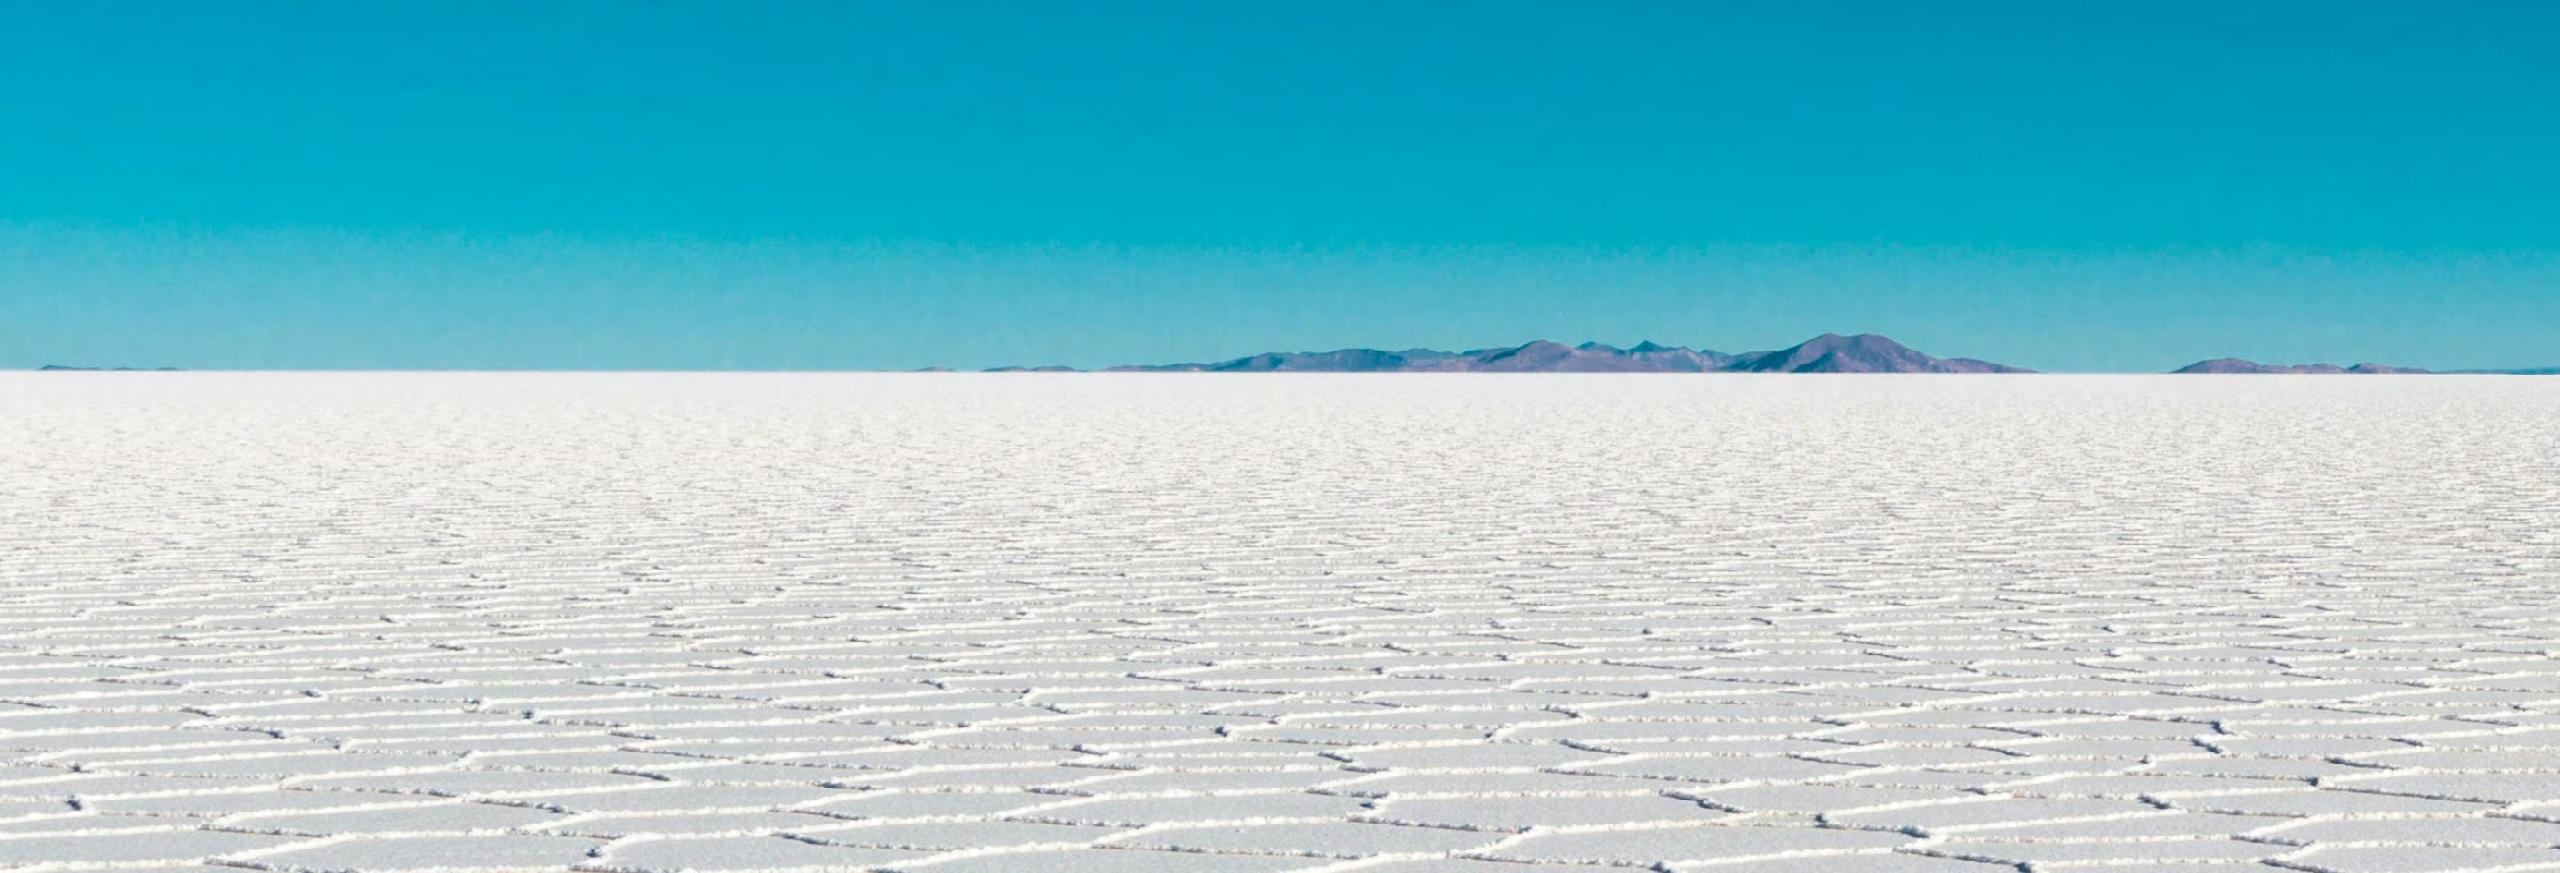
As described above, the major potential impact to such soil, would be additional salt loading with subsequent leaching and runoff to eventually impact surface water and groundwater. Impacts to surface water and groundwater may also result from improper pesticide usage. Modern management practices (also known as best management practices or BMPs) for salinity, irrigation, and pesticide usage can be employed to minimize and mitigate impacts to irrigated land and these BMPs will be discussed in a future article.
EC is defined as the conductance of one cm3 of H2O at 25oC and was historically presented in micromhos per centimeter (µmhos/ cm) EC is also known as specific conductance, and, in agricultural literature, is commonly expressed in deciSiemens per meter (dS/m), where 1.0 dS/m is equal to 1,000 µmhos/cm. Water salinity classification may also be based on TDS and EC (Table 2). Non-saline water generally has TDS concentrations less than 500 ppm and EC values less than 0.7 dS/m or 700 µSiemens/ cm (µS/cm). Non-saline waters will have the lowest impact to agricultural lands and are preferred for irrigation usage.
Another approximate relationship between TDS and EC is that in the range of natural water:
~100 to 5,000 μS/cm ≈ 1 milliequivalents per liter (meq/L) of cations = 100 μS/cm and therefore 1.0 mg/L = 1.56 μS/cm.
I’ll continue this discussion in Part 2.
References
1. Biota of North America Program (BONAP), 2008, Soil Types: http://www.bonap.org/2008_Soil/SoilTypesRelatedMaps.html
2. California Water Boards, 2023, Water Quality Control Policy for Recycled Water https://www.waterboards.ca.gov/water_issues/programs/recycled_ water/policy.html
3. Motzer, W.E., 2011, Recycling Water-Part 1: The VORTEX, v. LXXII, n. 10, pp. 6 and 9. www.calacs.org
4. Motzer, W.E., 2012, Recycling Water-Parts 2 and 3: The VORTEX, v. LXXIII, n. 1 (January), pp. 6-7 and v. LXXIII, n. 2 (February), pp. 6 and 10. www.calacs.org.
5. Motzer, W.E., 2016, Salty Solutions: The VORTEX, v. LXXVII, n.1, pp.6-8. www.calacs.org
6. U.S. Geological Survey (USGS), 2013, Saline Water and Salinity: https://www.usgs.gov/special-topics/water-science-school/science/ saline-water-and-salinity
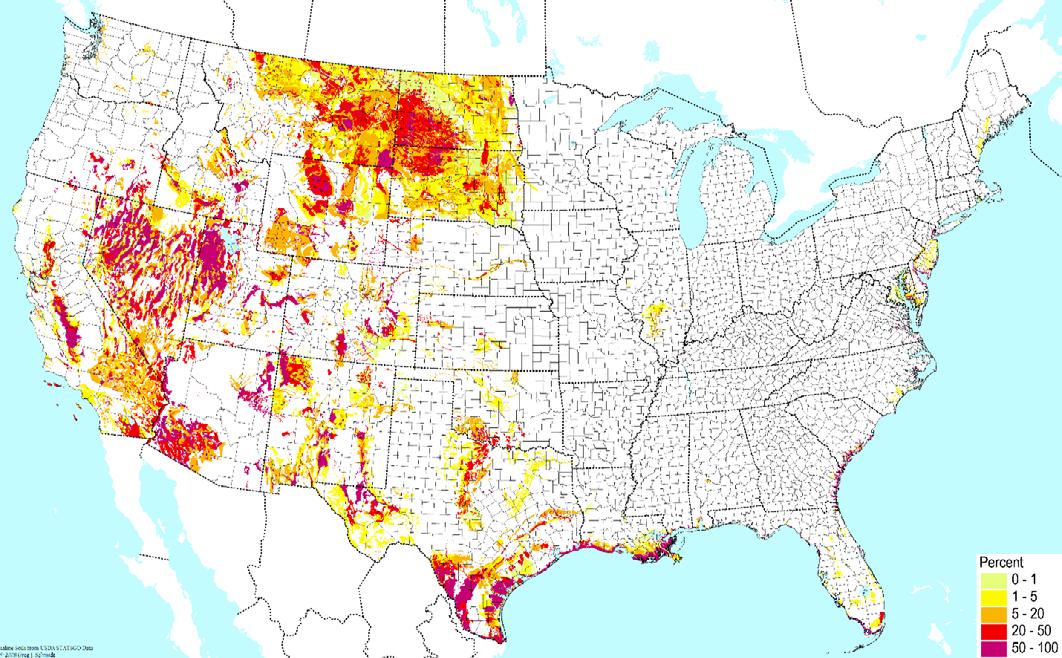
Figure 1: Salty soils based on high electric conductivity. Source: BONAP (2008).
Table 1: Salt Concentrations in Freshwater Bodies
Freshwater Body Salt Concentration (ppm)
Rain 1 – 10
Streams 100 – 1,000
Rivers 1 – 10,000
Lakes with outflow 10 – 10,000
Lakes without outflow 1,000 – 700,000
Table 2: U.S. Geological Survey Classification of Water based on TDS
 by Todd Jarvis, Institute for Water & Watersheds at OSU
With groundwater depletion, ground subsidence, and an unending list of water quality issues in California and beyond, where has all of the fun gone for serious groundwater professionals? Serious gaming, or games with a purpose beyond pure entertainment, can bring back the fun and recruit others to join in developing, protecting, and managing groundwater, too.
To assuage the skeptical readers who think gaming is not serious business, consider that mathematician John Nash won the Nobel Prize in Economic Sciences for his work in game theory. The Nash equilibrium theory distinguished between cooperative games and non-cooperative games. And on a more serious note, serious gaming is serious business – an $11B industry or about 10% of the global games market.
Serious games have been developed to test the earliest environmental regulations in the US focusing on water, as well as playing ways to negotiate out of the oil crisis of 1970s (this might be a good time to brush the dust off this game given the current energy crisis). Nature-based serious games have evolved to address coastal and marine conservation, management, and adaptation, climate change, and pandemics.
Serious groundwater games were developed nearly 40 years ago by Harvard University's Program on Negotiation. Serious groundwater games come in many forms, ranging from role plays, board games, computer-assisted board games, online games, and escape room games. Serious games are typically interactive and provide realistic virtual environments in which players attempt to simultaneously “juggle” growing food, growing cities, sustaining the environment, and making a profit. But what about the technical jargon associated with the myth and mysteries of groundwater? Look no further than The Groundwater Term Game, which was developed by
Nebraska Public Media for school age children, and beyond, to level the playing field before sitting around the game table. The academies regularly add to the portfolio of serious games in water resources with the Water Message Game from IHE Delft, the Water Footprint Game by University of Twente, Save the Water Game developed by Zurich University of the Arts, The Edwards Aquifer Game by the Program for the Advancement of Research on Conflict and Collaboration at Syracuse University, and the Memory Mayhem - A Groundwater Puzzle game developed by the University of Massachusetts at Amherst. Over 40 water-related serious games used in Multi-Criteria Decision Analysis in environmental settings were reviewed by Swiss Federal Institute of Aquatic Science and Technology researchers. Development of serious games in California has focused on a broad spectrum of environmental issues. Delta Skelta is a game developed by the US Geological Survey to simulate long-term integrated environmental planning in the Sacramento-San Joaquin Delta. Several students from Delft University of Technology developed a Monopoly-like board game that centered on flood risks on Bethel Island, called “SimBethel.” In it Together is a game used for resiliency planning around the San Leandro Bay to adapt to sea level rise and flooding from rising groundwater.
And, of course, there are games to play with groundwater and SGMA! For a look at regional cooperation or competition for water, try the California Water Crisis game that plays NorCal vs. SoCal vs. the Central Valley. This is an interesting game for California water wonks as the game has three versions - the current situation playing with SGMA, a look back in time to the Bad Old Days playing the late 1800s to the early 20th century, and Looking Downstream to the mid 21st century. And unlike other competitive games where the winner is the

one with the most points, the region that "wins" is the one that reaches a 100% approval rating through social spending and allocating water to ecosystems. Cash, water and water rights can be given, sold, or traded at any time. The game is free and the pieces can be downloaded, but be forewarned, the time and expense associated with assembling the "free" game is worth more than the approximately $40 to purchase and ship a complete game.
The Groundwater Game developed by the Environmental Defense Fund (EDF) is a locally-focused simulation pitting an almond grower, alfalfa grower, broccoli grower, rural family, community water system, and urban water utility. Water users experiment with groundwater pumping and management strategies, including unregulated pumping and allocations and water trading, all of which is monitored by a facilitator using a spreadsheet that is included with the game. Like the California Water Crisis game, the game is free for downloading, but the estimated cost of materials is approximately $75. Testimonials from players about the game can be read on the EDF blog
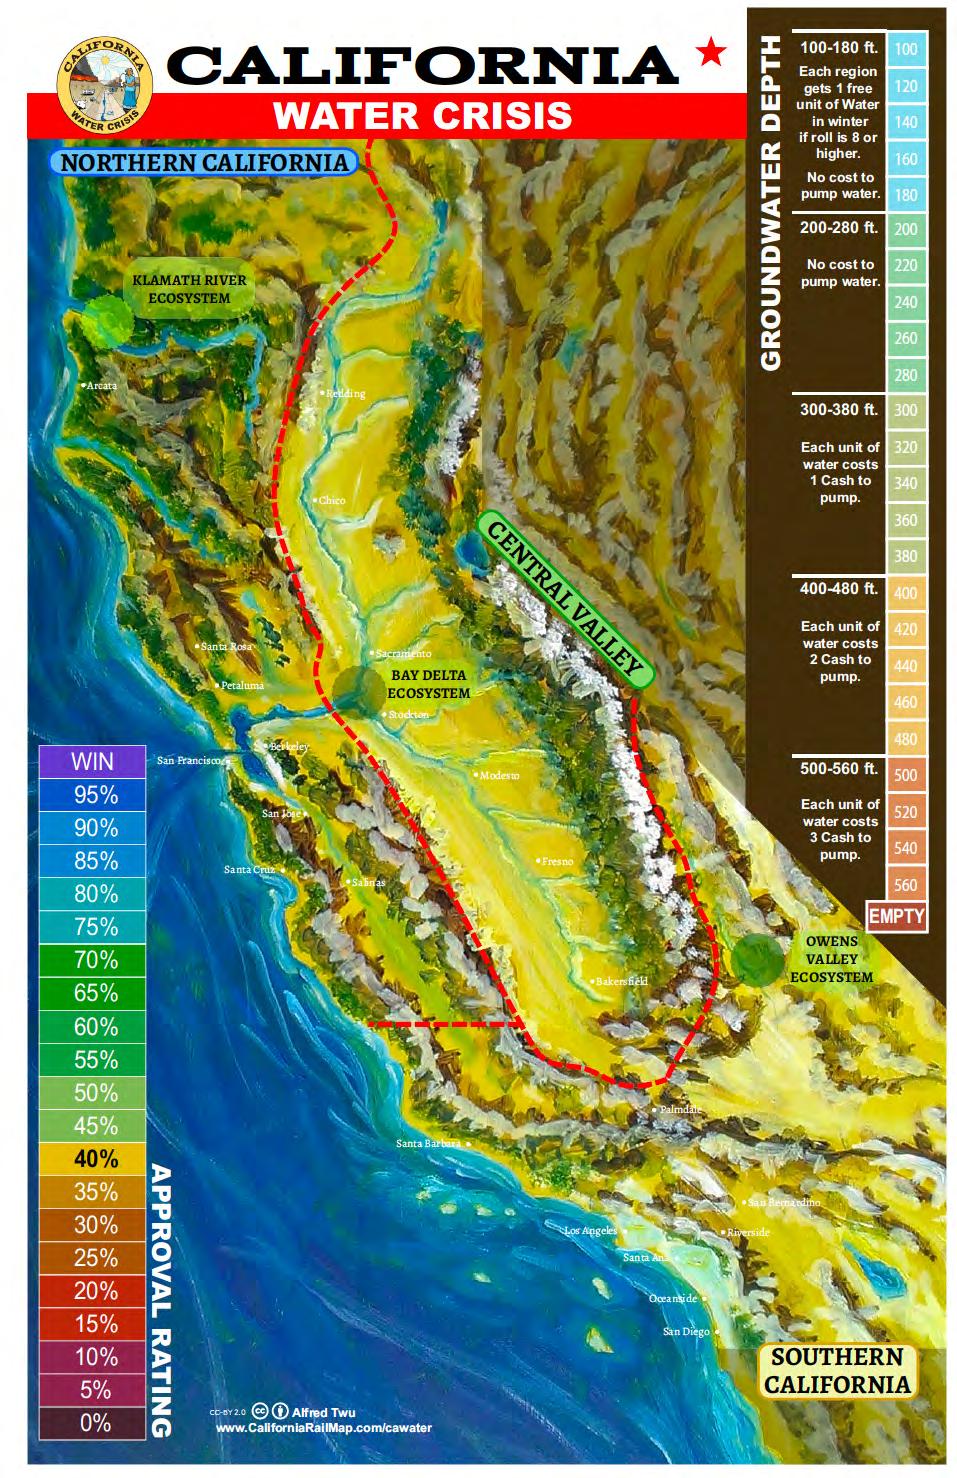
How will SGMA play out in your basin? Time to get your groundwater game face on and test the Nash equilibrium tool, or will a cooperative outcome prevail?
He is currently a Professor at Harvard Business School

"Failure doesn’t mean the game is over, it means try again with experience.”
~Leonard A. Schlesinger, American author, educator, and business leader.

Photograph of perennial Salt Creek, the Salt Creek Hills, and Tucki Mountain in Death Valley National Park. The principal streams discharging water, sediments, and salts into Death Valley are the Amargosa River, Salt Creek, and Furnace Creek. Salt Creek and groundwater in upgradient structural basins drain the northwestern area (about 1,600 square miles) of Death Valley, most of which is mountainous and composed largely of Paleozoic carbonate rocks. Salt Creek is a rare source of water that supports a unique ecosystem in Death Valley. The Salt Creek area provides an interesting opportunity to learn about the interactions of dynamic geologic, hydrologic, and biologic systems in an arid environment.
A faulted anticlinal uplift of impermeable beds of the Pliocene Furnace Creek Formation forms the Salt Creek Hills, which separate the Death Valley saltpan to the south from another broad deep structural basin under Mesquite Flat to the north. Groundwater ponded in Mesquite Flat discharges into Salt Creek, which has eroded a gorge through the Salt Creek Hills before flowing into the north end of the Death Valley saltpan. Salt Creek flows from a series of springs about 2 miles upstream of the Salt Creek Interpretive Trail parking area; the largest being McLean Spring (undrinkable). Only short stretches of Salt Creek are perennial. In addition to groundwater discharge, short-term surface flow in Salt Creek also depends on winter and summer-monsoonal storms. A historic 1960’s US Geological Survey report stated that discharge of Salt Creek varied from an estimated normal minimum of about 0.1 cubic feet per second (cfs) to a normal maximum of about 1.5 cfs.
Well-preserved fossil vertebrate tracks and trackways are preserved in Miocene and Pliocene lacustrine deposits of Death Valley National Park, including the Salt Creek Hills. Birds, camels, primitive horses, lion-sized cats, and mastodons waded into the lakes to drink, leaving tracks in the mud. The fossil tracks show not only which creatures inhabited the area but can also reveal their behavior and the interactions between species. Palm trees and reeds also lined the lake shores. Clays, silts, fine sands, and volcanic ash settled on the lake bottom, creating stratified deposits thousands of feet thick. Those ancient lakebed deposits have since been uplifted and eroded into colorful badlands.
Visitors to Salt Creek during the summer witness a dry landscape with brittle plant life, but a winter trip provides an entirely different experience. When the air temperature drops, flowing water returns to the dry bed of Salt Creek. Pickleweed and salt grass grows along the creek banks, birds can be seen in the shallows, and macroinvertebrates crawl and swim under the surface. Perhaps most exciting of all is the return of the Salt Creek Pupfish.
Salt Creek pupfish are endemic and specifically adapted to the unique habitat of Salt Creek and can tolerate salt concentrations several times that of sea water. Spawning takes place as the water temperature increases in late winter, usually peaking in March and April. The male fish flash brilliant blue as they defend their tiny territories. The springtime population may be as great as 1 million fish, yet most die as Salt Creek dries up during the heat of summer. By September the population is only a few thousand, with the survivors again restricted to the deep upstream pools. The average Salt Creek pup fish lives only for about six months.

available at: https://www.nps.gov/deva/index.htm
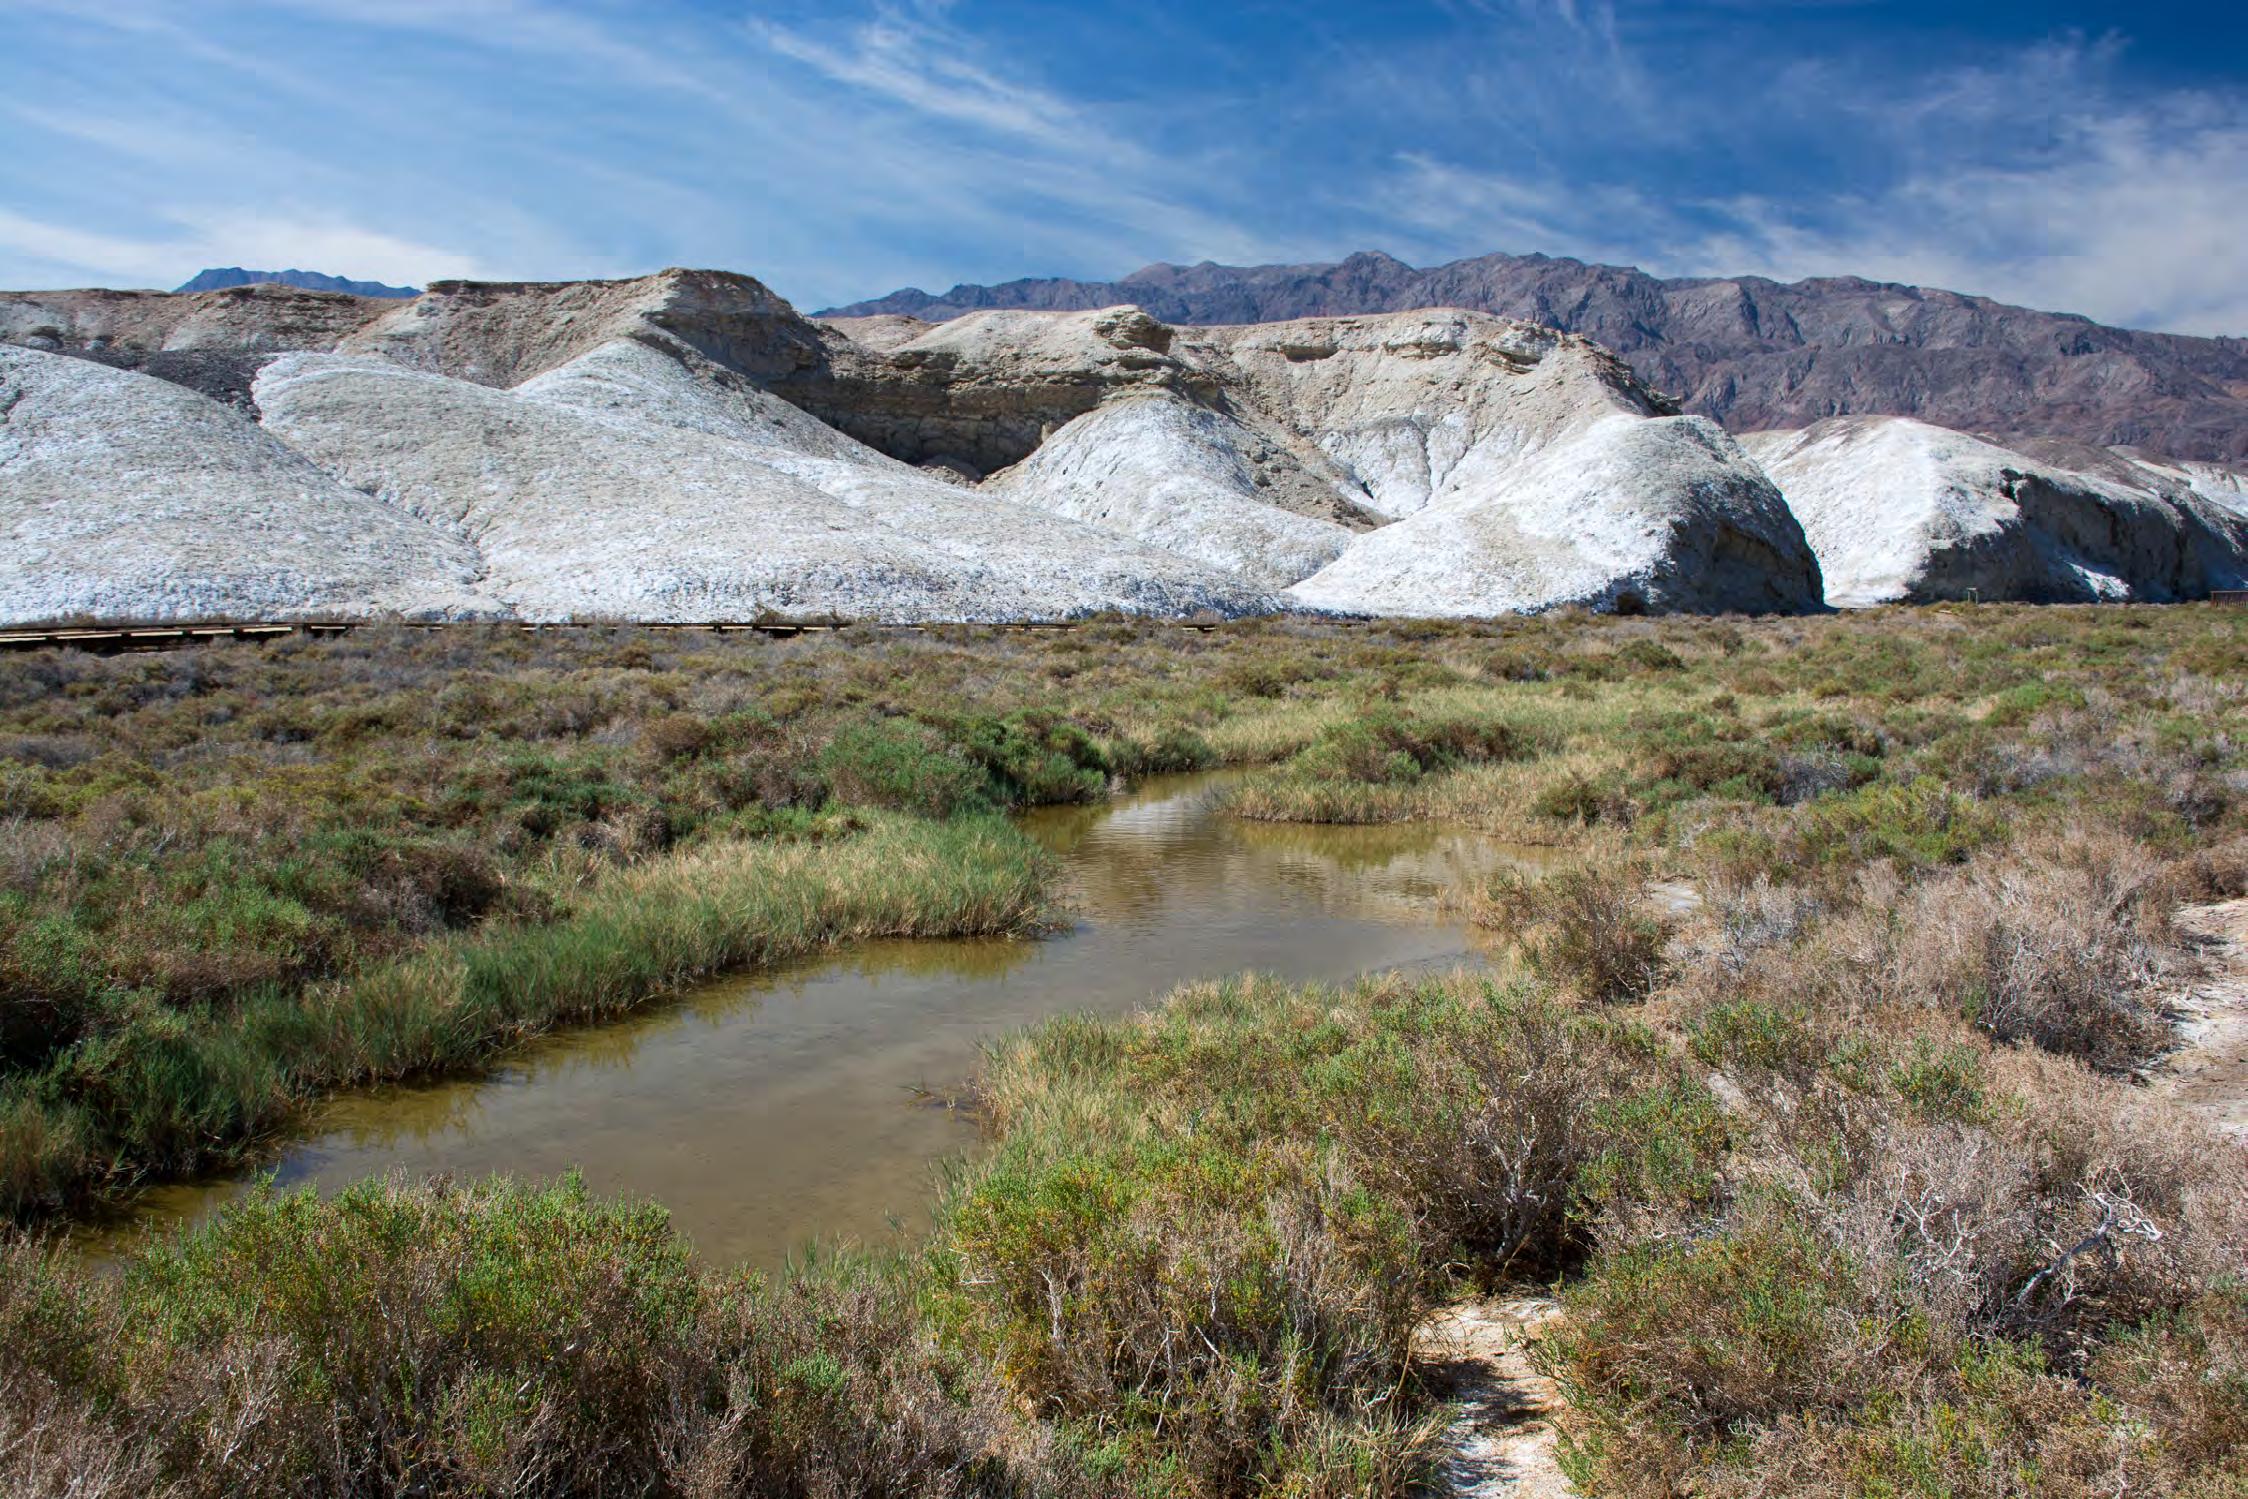
R.T. Van Valer
R.T. Van Valer has worked for Roscoe Moss Company, a leading manufacturer of water well casing, screen and water transmission pipe, since 2001. R.T. currently serves as the Product Manager and Director of Human Resources for the company. In his 11th year with GRA, R.T. has previously served in multiple executive offices, chaired committees and twice chaired the Western Groundwater Congress.
David W. Abbott, P.G., C.Hg., Consulting Geologist
David W. Abbott, P.G., C.Hg., Consulting Geologist, is a Geologist with 45+ years of applied experience in the exploration and development of groundwater supplies; well location services; installation and design of water supply wells; watershed studies; contamination investigations; geotechnical and groundwater problem solving; and protection of groundwater resources.
Chris Bonds, Sacramento Branch Member at Large Chris Bonds is a Senior Engineering Geologist (Specialist) with the California Department of Water Resources (DWR) in Sacramento. Since 2001, he has been involved in a variety of statewide projects including groundwater exploration, management, monitoring, modeling, policy, research, and water transfers. He has over 30 years of professional work experience in the private and public sectors in California, Hawaii, and Alaska and is a Professional Geologist and Certified Hydrogeologist. Chris received two Geology degrees from California State Universities. He has been a member of GRAC since 2010, a Sacramento Branch Officer since 2017, and has presented at numerous GRAC events since 2004.
Katherine Dlubac, PhD, PG PhD, PG and Statewide AEM Survey Project Manager, DWR Sustainable Groundwater Management Act (SGMA) Office
Abhishek Singh, PhD, PE
Dr. Abhishek Singh is a Principal Engineer with more than 20 years of experience and is President of INTERA’s Water Resources & Supply Line of Business (LoB), where he leads and manages operations, business development, strategic planning for the lob across the United States. He has authored several technical publications and journal articles on groundwater modeling and calibration, stochastic optimization techniques, uncertainty and risk analysis, climate change, and emerging contaminants. Dr. Singh is also the chair of the GRA technical committee and serves on the GRA board of directors.
Chris Petersen
California professional geologist (PG) and certified hydrogeologist (CHg) with GEI Consultants and task order manager for AEM Project
Julián Consoli, PG
PG with GEI Consultants and technical lead on compiling supporting data for AEM Project
Timothy Parker, PG, CHg
PG and CHg with Ramboll and lead reviewer for AEM Project, Tim is a Principal with Parker Groundwater in Sacramento, where his current practice focuses on strategic water resources planning and policy consulting, groundwater management planning and program implementation, and groundwater resources development.
Roohi Toosi, PE
President & Principal Engineer at APEX Environmental & Water
Resources Mr. Roohi Toosi, PE is a Board Director and a member of several committees at GRA. Mr. Toosi established APEX Environmental & Water Resources, LLC to utilize his accumulated experience for serving the clients more efficiently and cost-effectively. His background in petroleum engineering has equipped him with a broader knowledge of porous media and tools to solve subsurface complex issues. His expertise encompasses all aspects of environmental engineering and hydrogeology, with emphasis on subsurface investigation and remediation. Over the course of his career, Mr. Toosi has conducted and managed projects for utilities, school districts, municipalities, military bases, private developers, contractors, farmers, water districts, and large consulting firms.
William E. (Bill) Motzer
William E. (Bill) Motzer, PhD, PG, CHG, CPG is a somewhat semiretired forensic geochemist. Formerly with Todd Groundwater, he has more than 40 years of experience as a Professional Geologist and more than 35 years of experience in conducting surface, subsurface, and environmental forensic geochemical investigations. His particular expertise is in stable and other isotopic “fingerprinting” and age dating techniques and water quality/contaminant source identification geochemistry.
John Karachewski, PhD
John Karachewski is a geologist for the California EPA (DTSC) in Berkeley. He is an avid photographer and often teaches geology as an instructor and field trip leader.
Emery Coppola, Ph.D., PG
President and Principal Hydrologist at NOAH Global Solutions
Dr. Coppola is a co-founder of NOAH Global Solutions, a company that specializes in the application of AI and formal optimization to water management problems. A pioneer in this area, he has consulted to nations in Europe, Asia, Africa, Australia, and North America. His real-world AI groundwater applications include saltwater intrusion forecasting, groundwater elevation forecasting, and optimally balancing wellfield extraction with contaminant vulnerability to a nearby plume. His first application was optimizing management of the Parkway Wellfield, made famous by the Pulitzer Prize winning book “Toms River,” which led to NOAH’s patented AI-based decision support system.
Mary Poulton, Ph.D.
Vice President and Director of AI Modeling at NOAH Global Solutions
Dr. Poulton is a NOAH co-founder and co-developer of their patented decision support system. The former head of the Department of Geological and Mining Engineering at the University of Arizona, she has spent more than 35 years researching and developing neural network applications. She is an expert in AI architecture, algorithms and both proprietary and open-source software, which advances NOAH’s advanced AI modeling solutions. Her wide diversity of applications includes water resources, petroleum, and geophysics. Her research projects have taken her to many places around the world, including China, Mongolia, Australia, Peru, Chile, Mexico, Russia, Malta, and Canada.
Ferenc Szidarovszky, Ph.D.
Vice President and Director of Operations Research at NOAH Global Solutions
Dr. Szidarovszky is a NOAH co-founder and co-developer of their patented decision support system. He is an internationally renowned mathematician and economist with seminal contributions in both areas, as reflected by his extensive collaboration with Dr. Vernon Smith, co-recipient of the 2002 Nobel Prize in Economics. His work is not exclusively limited to theory, rather his methods have been applied to a large diversity of real-world problems, including water resources modeling and management. A former full professor at the University of Arizona with joint appointments in other departments, he develops advanced mathematical methods to support continued development of innovative methods and products for NOAH.
Ian Gottschalk, PhD
Ramboll, Applying geophysical solutions to address challenges in water management.
Paul Thorn
Senior Geologist, Ramboll
Thomas Harter
UC Davis, Thomas Harter holds the Nora S. Gustavsson Endowed Professorship in Water Resources at the University of California, Davis after serving as the Robert M. Hagan Endowed Chair for Water Policy and Management from 2007-2020. He has a joint appointment as Distinguished Professor and as Distinguished Professor in Cooperative Extension at the Department of Land, Air, and Water Resources, is currently chair of the Hydrologic Sciences Graduate Group, and, as Associate Director of the Center for Watershed Sciences, is a team partner for the World Water Center.
Vicki Kretsinger
Luhdorff & Scalmanini, President of Luhdorff & Scalmanini, Consulting Engineers (LSCE), Vicki has for many years been a champion for IAH and other groundwater related organisations, both within the US and worldwide.
Erik Cadaret, PG
West Yost, Erik is a hydrogeologist who has six years of experience. His work at WSC includes project management and technical tasks related to water resources management, SGMA, Prop 1 Groundwater Grant Programs, field supervision of well projects, geologic and hydrogeologic data interpretation, surface water modeling, and water quality evaluations. His professional background includes a mix of field, technical, and assistant management roles related to the environmental and water resources sector of the water industry. He provides innovative solutions to WSC clients and colleagues by leveraging knowledge of and accessibility to readily available technology. Erik became more involved in GRA since 2019 and ever since has thoroughly enjoyed each role he had on the Southern California leadership team. He believes that GRA is a special organization that has tremendous potential to usher in the next generation of water resources professionals.
Marina Deligiannis
Lake County, Deputy Director, Lake County Water Resources
Department / Board of Director, California Groundwater Resources Association
Karlee Liddy
Graduate student (MS) in Coastal Science & Policy Program at UC Santa Cruz. Repass-Rodgers Salmon Restoration Policy Fellow
Todd Jarvis
Institute for Water & Watersheds at Oregon State University, Todd has 30 years of experience as a hydrogeologist specializing in groundwater development and source water protection with emphasis in fractured rock and karst terranes. With professional licenses as a Certified Engineering Geologist, Certified Water Right Examiner, and Certified Mediator, his interests include transboundary aquifers, environmental conflict resolution, and education in water science and policy.
Jesse Scolavino, PE, GIT
Associate Water Resource Engineer, Brown and Caldwell
Clay Sorensen, PG, CHG Hydrogeologist at Balance Hydrolics, Inc.