THE DANISH PROPERTY FEDERATION MARKET STATISTICS – VACANCY COVERING THE PROFESSIONAL INVESTMENT PROPERTY MARKET IN DENMARK April 2016
WEB REPORT
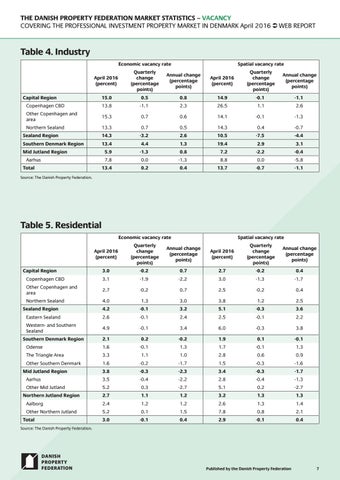
Table 4. Industry Economic vacancy rate
Spatial vacancy rate
April 2016 (percent)
Quarterly change (percentage points)
Annual change (percentage points)
April 2016 (percent)
Quarterly change (percentage points)
Annual change (percentage points)
15.0
0.5
0.8
14.9
-0.1
-1.1
Copenhagen CBD
13.8
-1.1
2.3
26.5
1.1
2.6
Other Copenhagen and area
15.3
0.7
0.6
14.1
-0.1
-1.3
Northern Sealand
13.3
0.7
0.5
14.3
0.4
-0.7
Sealand Region
14.3
-3.2
2.6
10.5
-7.5
-4.4
Southern Denmark Region
13.4
4.4
1.3
19.4
2.9
3.1
5.9
-1.3
0.8
7.2
-2.2
-0.4
7.8
0.0
-1.3
8.8
0.0
-5.8
13.4
0.2
0.4
13.7
-0.7
-1.1
Capital Region
Mid Jutland Region Aarhus Total Source: The Danish Property Federation.
Table 5. Residential Economic vacancy rate
Spatial vacancy rate
April 2016 (percent)
Quarterly change (percentage points)
Annual change (percentage points)
April 2016 (percent)
Quarterly change (percentage points)
Annual change (percentage points)
3.0
-0.2
0.7
2.7
-0.2
0.4
Copenhagen CBD
3.1
-1.9
-2.2
3.0
-1.3
-1.7
Other Copenhagen and area
2.7
-0.2
0.7
2.5
-0.2
0.4
Northern Sealand
4.0
1.3
3.0
3.8
1.2
2.5
Capital Region
Sealand Region
4.2
-0.1
3.2
5.1
-0.3
3.6
Eastern Sealand
2.6
-0.1
2.4
2.5
-0.1
2.2
Western- and Southern Sealand
4.9
-0.1
3.4
6.0
-0.3
3.8
Southern Denmark Region
2.1
0.2
-0.2
1.9
0.1
-0.1
Odense
1.6
-0.1
1.3
1.7
-0.1
1.3
The Triangle Area
3.3
1.1
1.0
2.8
0.6
0.9
Other Southern Denmark
1.6
-0.2
-1.7
1.5
-0.3
-1.6
3.8
-0.3
-2.3
3.4
-0.3
-1.7
Aarhus
3.5
-0.4
-2.2
2.8
-0.4
-1.3
Other Mid Jutland
5.2
0.3
-2.7
5.1
0.2
-2.7
Mid Jutland Region
Northern Jutland Region
2.7
1.1
1.2
3.2
1.3
1.3
Aalborg
2.4
1.2
1.2
2.6
1.3
1.4
Other Northern Jutland
5.2
0.1
1.5
7.8
0.8
2.1
3.0
-0.1
0.4
2.9
-0.1
0.4
Total Source: The Danish Property Federation.
Published by the Danish Udgivet Property af Ejendomsforeningen Federation Danmark 7