Market


Report GREENWICH Q3-2022

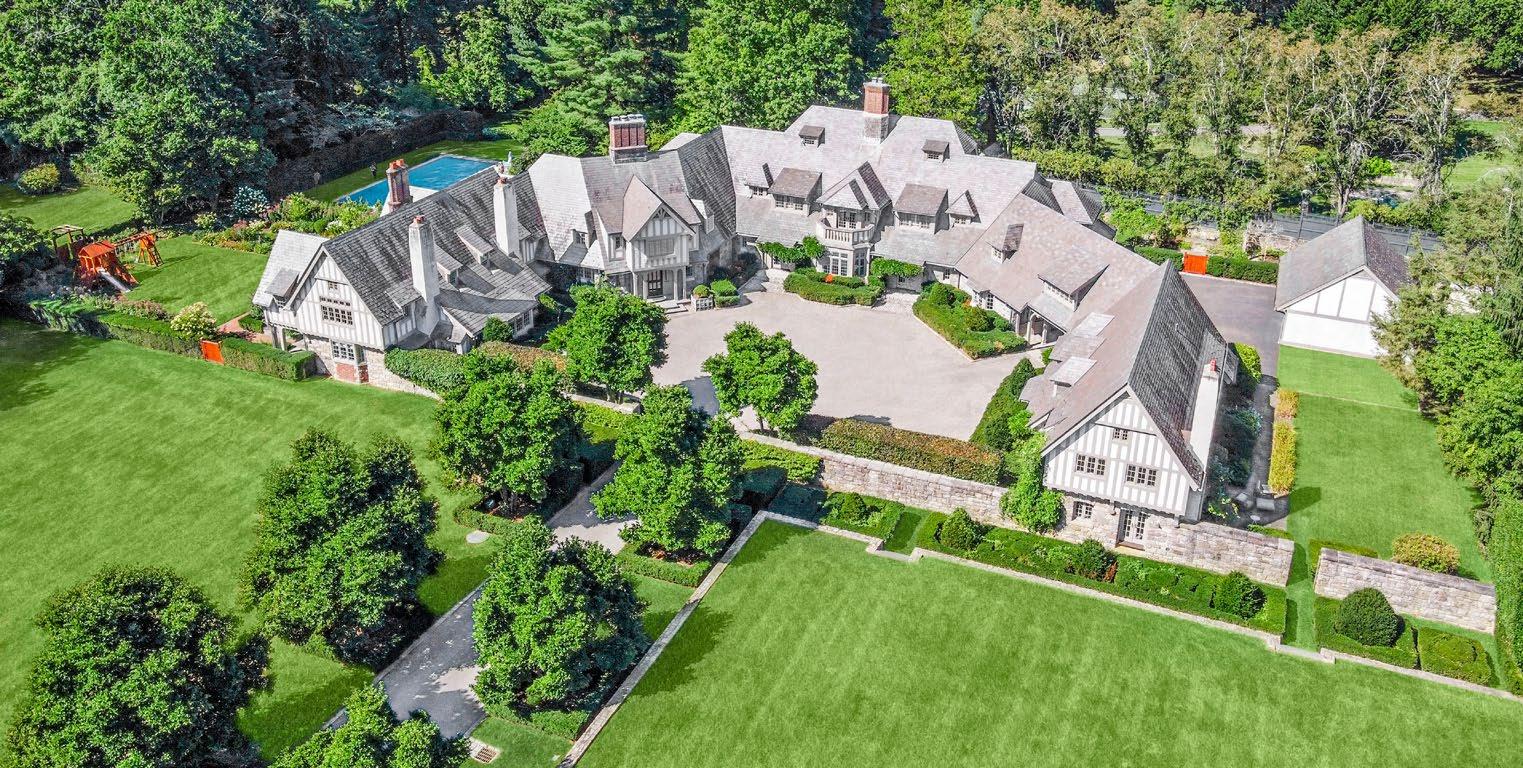
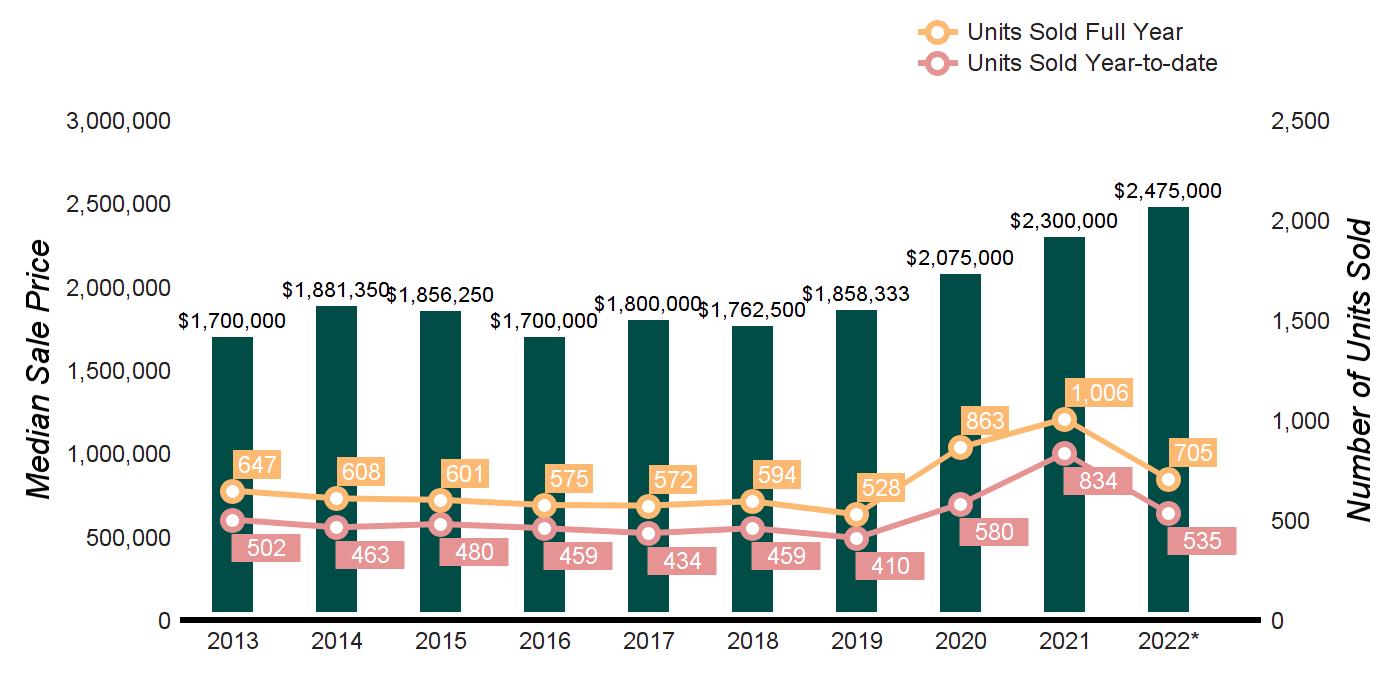
Buyer demand for homes in Greenwich, Connecticut, remained strong in the third quarter. A limited inventory of homes for buyers to choose from continued to be the headwind that constrained market performance. Although home sales declined 36% in the third quarter versus Q3 2021, they improved compared to Q2 2022. Also, the time it took to sell a home tightened to just 58 days on the market while median prices rose to more than $2.4M. Simply put, it remains an opportune time to sell a home in Greenwich.
The $5M - $6M price range was a highlight at the end of the quarter, with the distinction of being the only price category showing an increase in sales contracts versus 2021. The $10M+ market was the only price range showing an uptick in inventory, with 34 homes for sale compared to 20 a year ago.
So far this year, 535 single family homes have sold in Greenwich, Connecticut. Although less than in 2020 and 2021, this is a marked improvement from the seven years leading up to the pandemic.
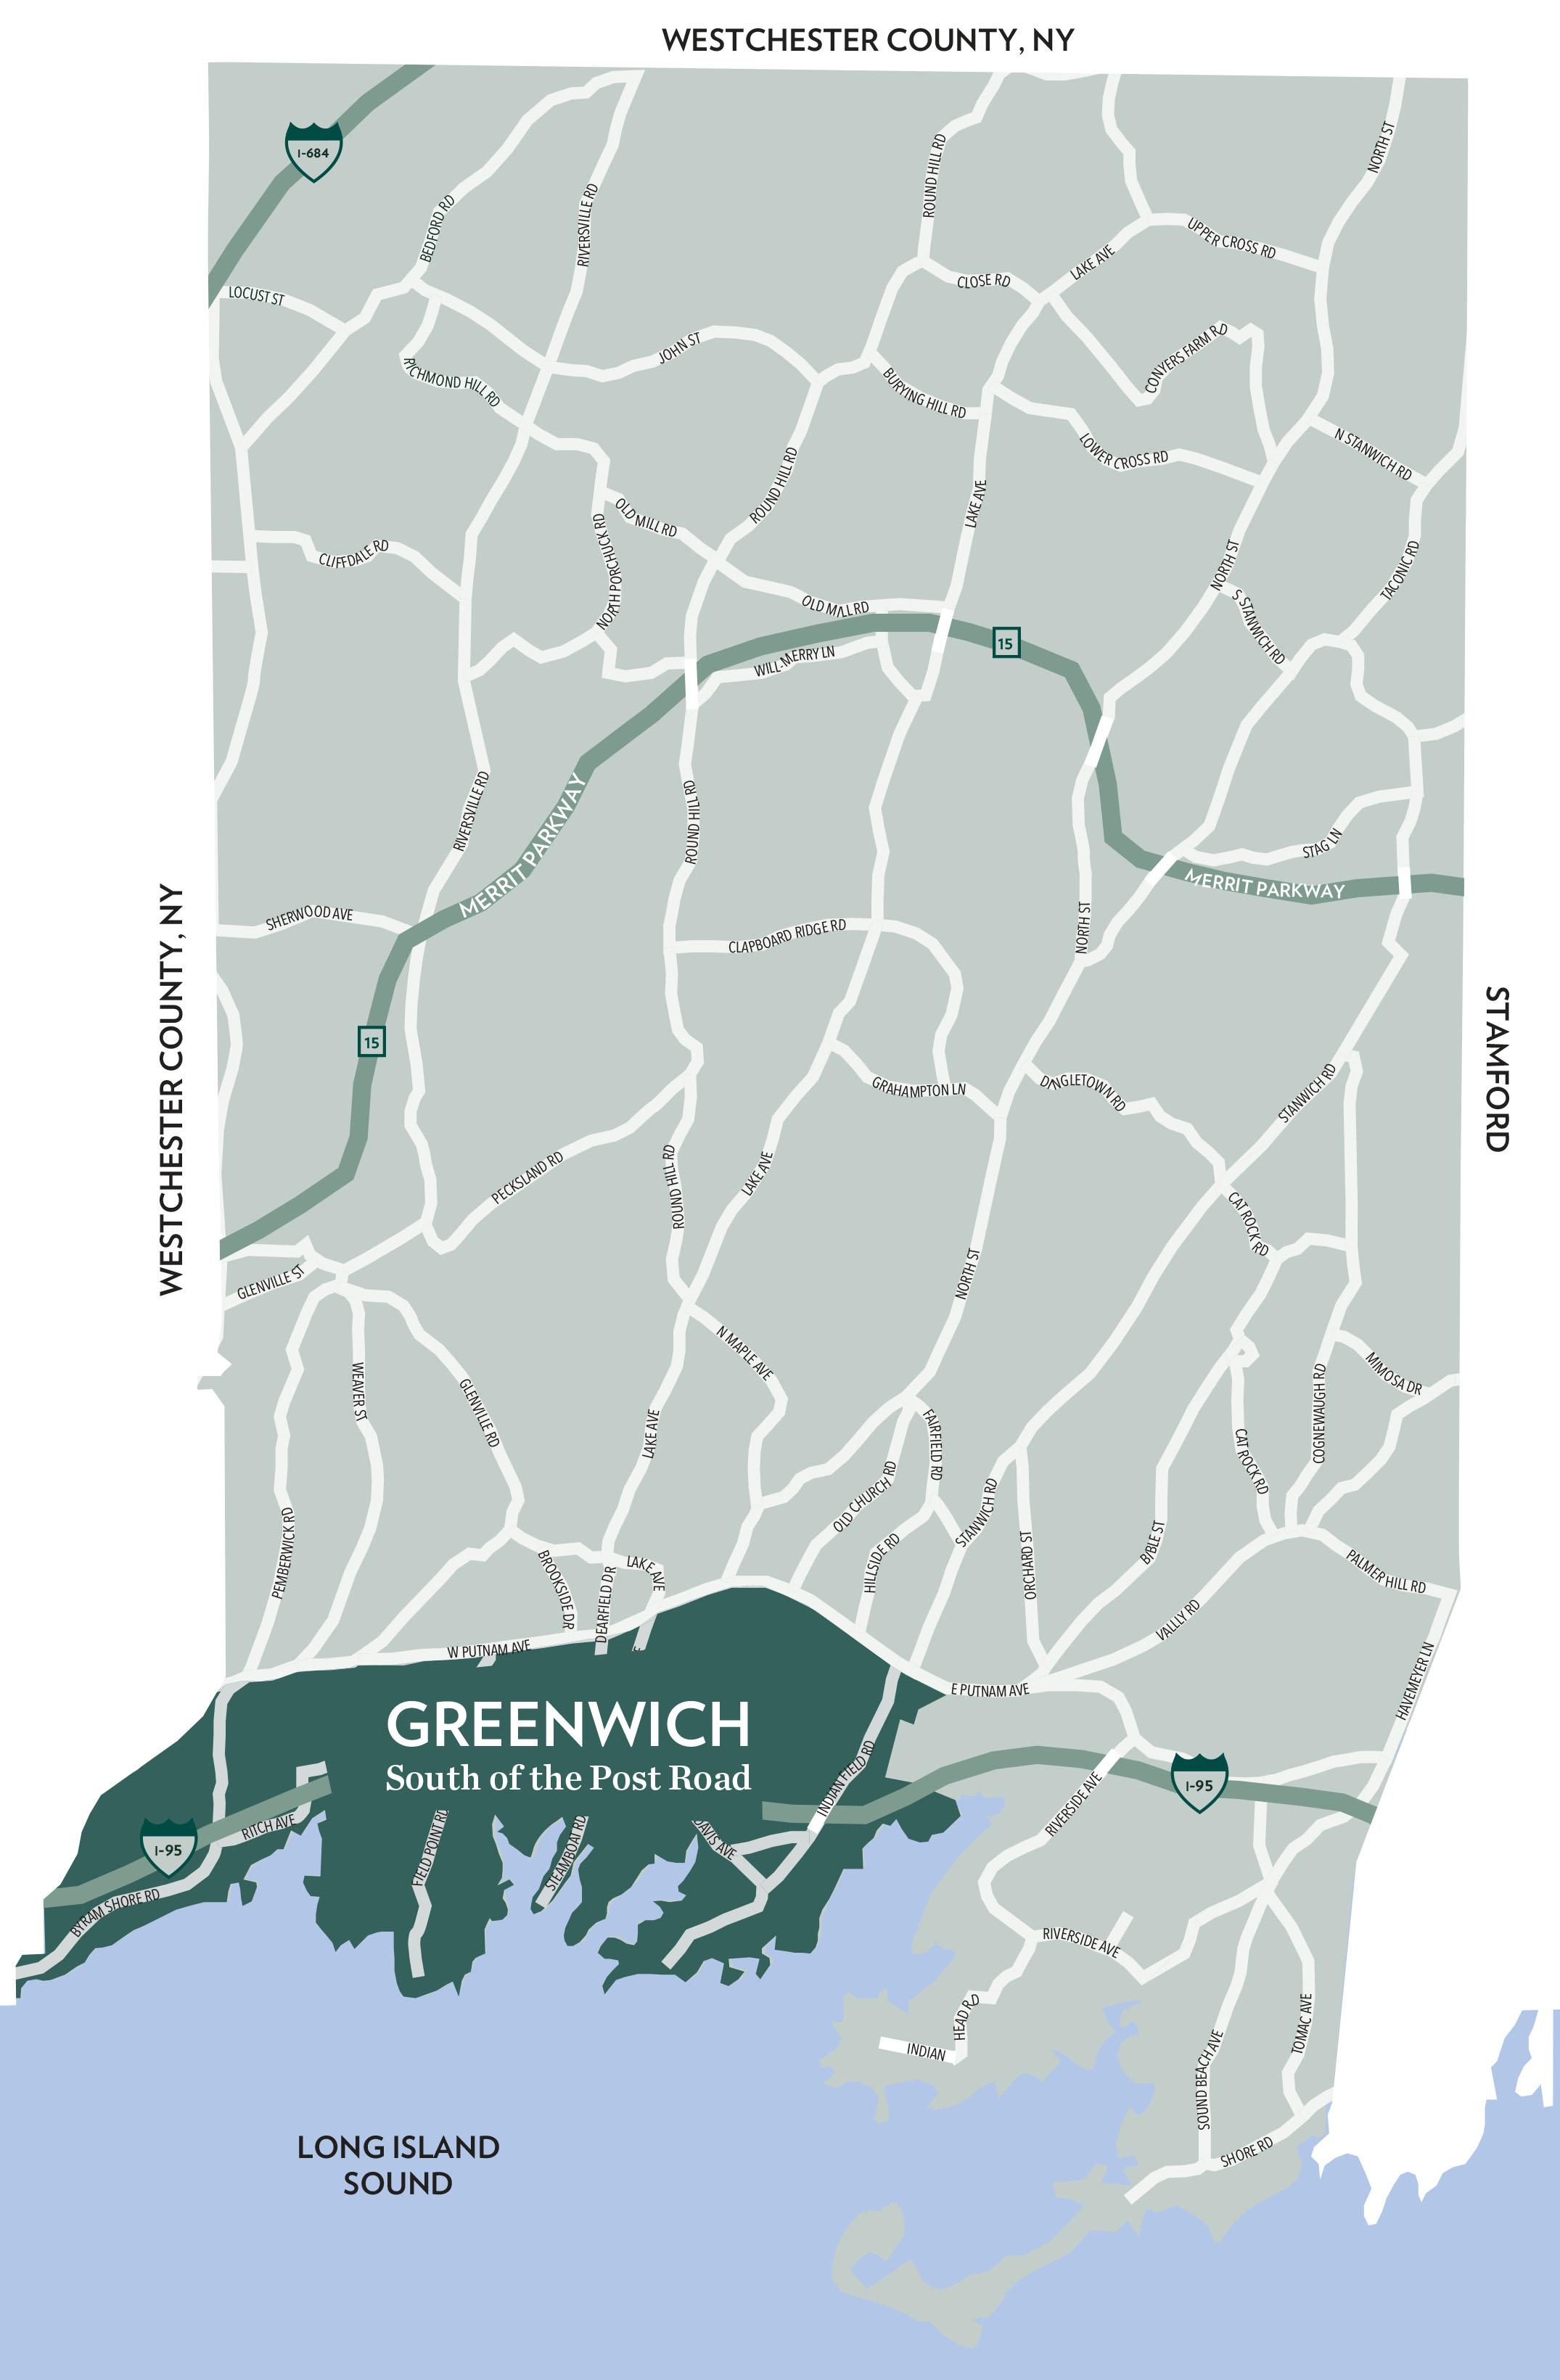
Four of our sub-market geographies in town averaged selling prices at or above the asking price in the third quar ter, including Mid-Country and South of the Post Road in Greenwich, Riverside, and Old Greenwich. Old Green wich was the standout, with homes selling at more than 4% over the asking price in the quarter. Strategic pricing can often result in interest from multiple buyers, which can help push prices higher.
Houlihan Lawrence remains the #1 real estate brokerage serving our destination hometown of Greenwich, Con necticut. We are grateful for our community, loyal clients, world-class agents, and support staff.
With Warm Regards, Liz Nunan President and CEO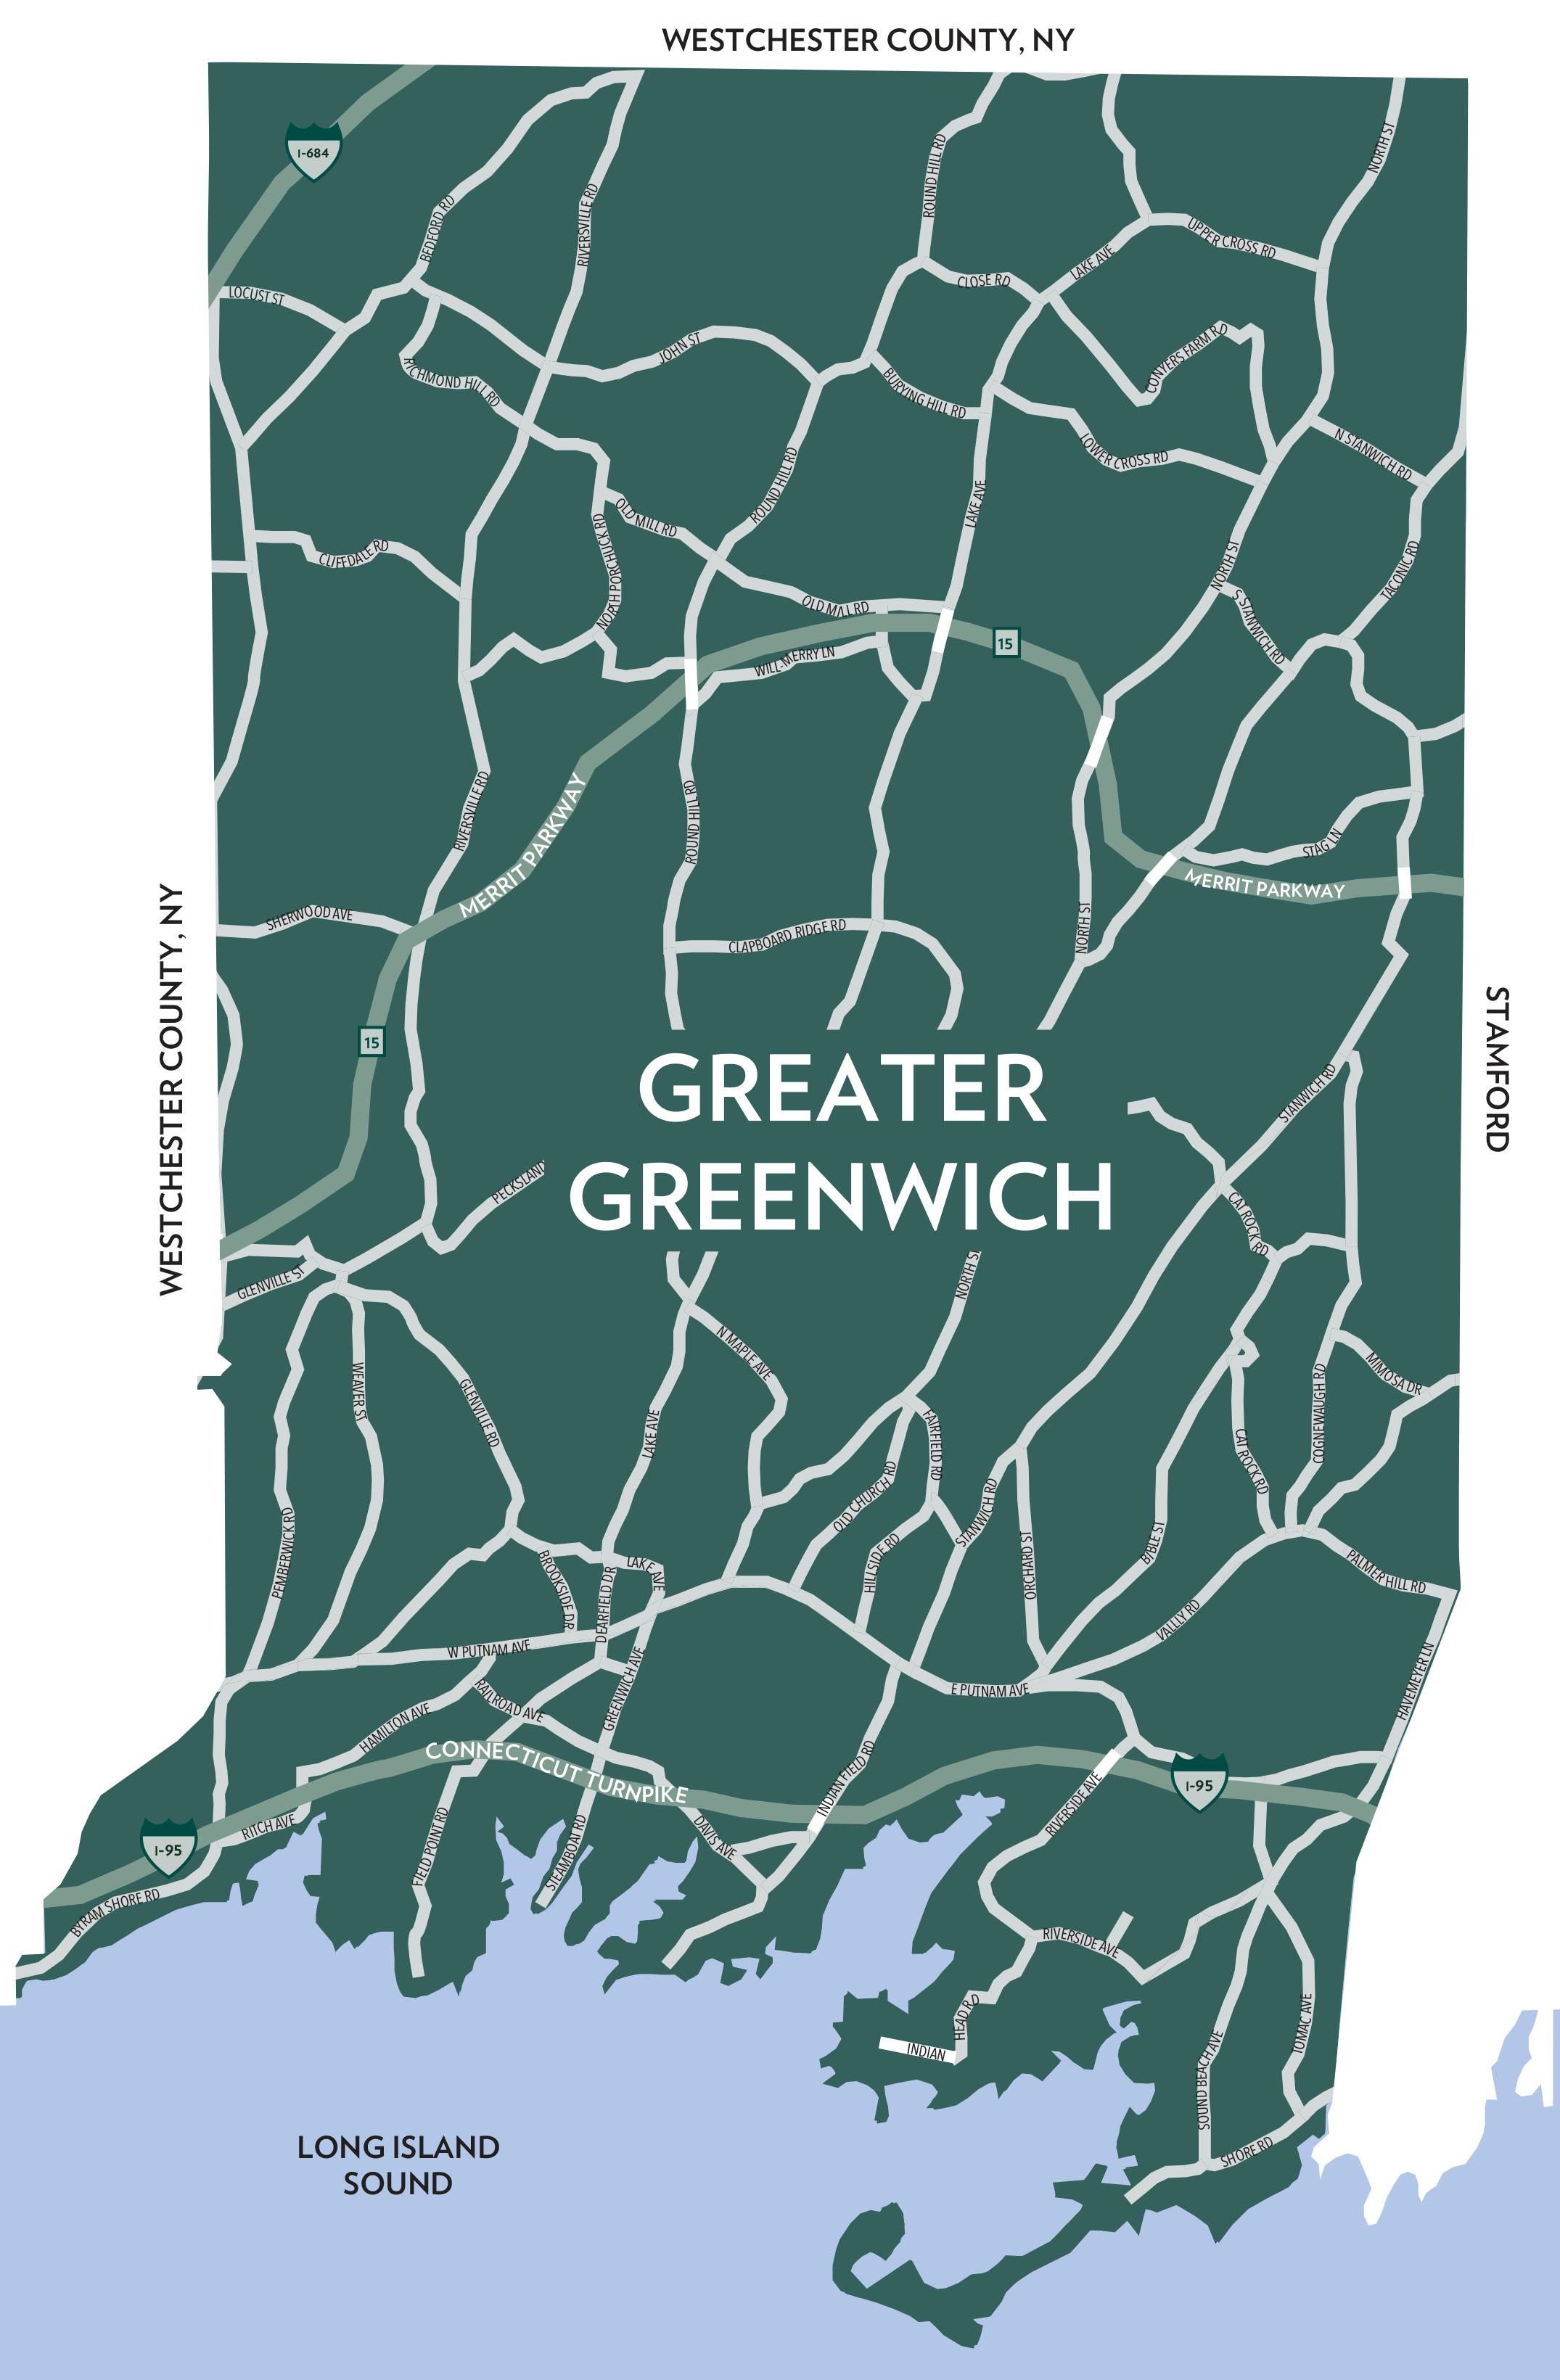
HOMES SOLD
Q3
% CHANGE YTD
YTD
% CHANGE
320 -36.3% 535 834 -35.9%
AVERAGE SALE PRICE $3,130,587 $2,940,366 6.5% $3,104,528 $2,974,497 4.4%
MEDIAN SALE PRICE $2,411,250 $2,297,500 5.0% $2,475,000 $2,300,000 7.6%
AVERAGE PRICE PER SQUARE FOOT $717 $653 9.8% $694 $631 10.0%
AVERAGE DAYS ON MARKET
83 -30.1% 79 111 -28.8%
% SALE PRICE TO LIST PRICE 100.5% 98.5% 2.0% 99.8% 97.6% 2.3%
sold
year-to-date.
AS OF SEPTEMBER 30, 2022
PRICE RANGE
SUPPLY: ACTIVE LISTINGS
DEMAND: PENDING SALES
AS OF SEPTEMBER 30, 2021 2022 vs. 2021
SUPPLY/ DEMAND RATIO*
SUPPLY: ACTIVE LISTINGS
DEMAND: PENDING SALES
SUPPLY/ DEMAND RATIO*
% CHANGE IN LISTINGS
% CHANGE IN PENDINGS
$0 - $999,999 11 4 3 20 13 2 -45.0% -69.2%
$1,000,000 - $1,999,999 43 11 4 57 32 2 -24.6% -65.6%
$2,000,000 - $2,999,999 36 18 2 47 19 2 -23.4% -5.3% $3,000,000 - $3,999,999 27 12 2 37 14 3 -27.0% -14.3% $4,000,000 - $4,999,999 28 5 6 29 8 4 -3.4% -37.5%
$5,000,000 - $5,999,999 18 7 3 18 3 6 0.0% 133.3%
$6,000,000 - $7,999,999 17 9 2 26 9 3 -34.6% 0.0%
$8,000,000 - $9,999,999 11
MarketTotals
01/01/202209/30/2022
$0 - $999,999
$1,000,000 - $1,999,999
70.0% -100.0%
3 -15.4% -75.0% $10,000,000 and up
-15.7% -35.0%
01/01/202109/30/2021 % CHANGE 2022/2021 10/01/202109/30/2022 10/01/202009/30/2021 % CHANGE 2022/2021
-40.4%
124 -41.1%
335 -37.9% $2,000,000 - $2,999,999 116
-34.6%
-46.0% 157 274 -42.7% $3,000,000 - $3,999,999
127 -44.9% 90 166 -45.8% $4,000,000 - $4,999,999
-3.4%
$5,000,000 - $5,999,999
74 -8.1%
0.0% $6,000,000 - $7,999,999
$8,000,000 - $9,999,999
2.9%
-36.0%
61 -34.4%
21 -28.6% $10,000,000 and up
-26.7%
-33.3% MarketTotals
GREATER GREENWICH -36.7%
Source:
-27.3%
-35.9%
Q3
HOMES SOLD
Q3
% CHANGE YTD
YTD
% CHANGE
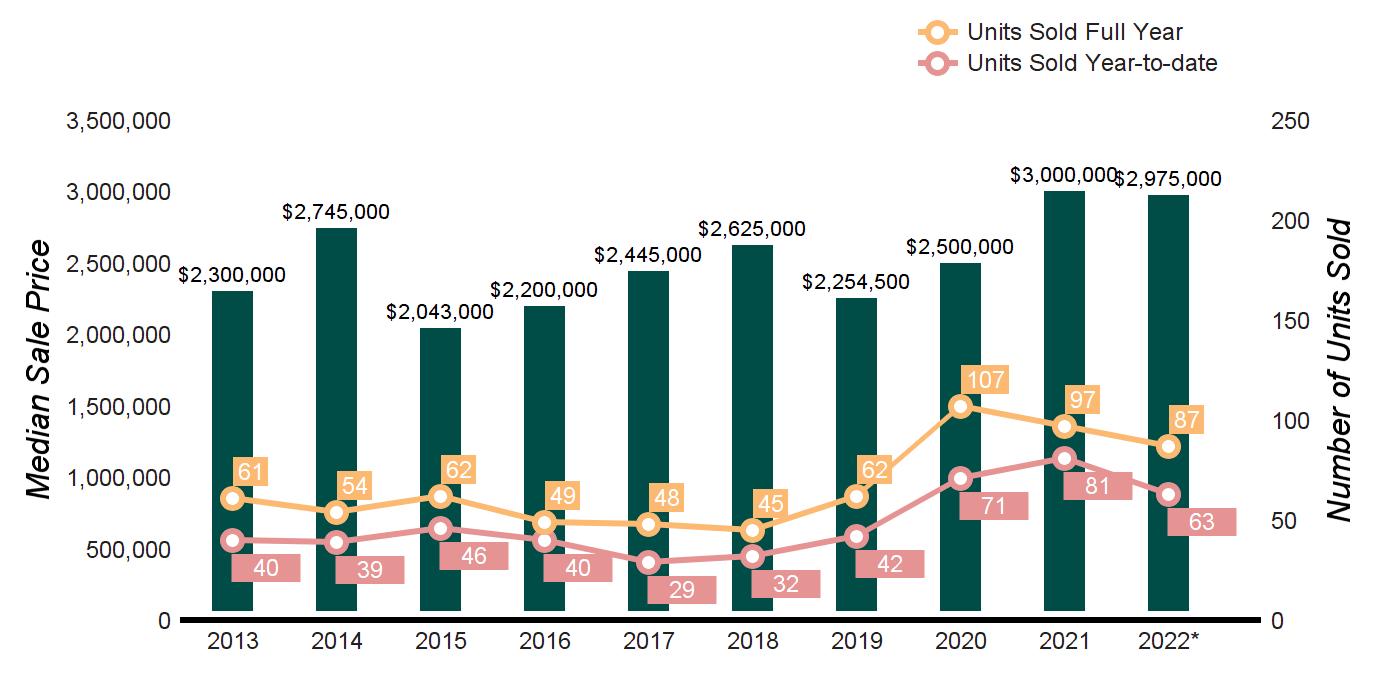
27 -7.4% 63 81 -22.2%
AVERAGE SALE PRICE $3,689,278 $4,135,212 -10.8% $3,605,774 $4,057,577 -11.1%
MEDIAN SALE PRICE $3,185,811 $3,100,000 2.8% $2,975,000 $3,000,000 -0.8%
AVERAGE PRICE PER SQUARE FOOT $631 $602 4.8% $606 $565 7.3%
AVERAGE DAYS ON MARKET
% SALE PRICE TO
212 -46.2% 111 168 -33.9%
PRICE 97.1% 97.1% 0.0% 96.6% 96.1% 0.5%
year-to-date.
AS OF SEPTEMBER 30, 2022
PRICE RANGE
$0 - $999,999
$1,000,000 - $1,999,999
SUPPLY: ACTIVE LISTINGS
DEMAND: PENDING SALES
$2,000,000 - $2,999,999
$4,000,000 - $4,999,999
$5,000,000 - $5,999,999
SUPPLY/ DEMAND RATIO*
AS OF SEPTEMBER 30, 2021
SUPPLY: ACTIVE LISTINGS
DEMAND: PENDING SALES
SUPPLY/ DEMAND RATIO*
2022 vs. 2021
% CHANGE IN LISTINGS
% CHANGE IN PENDINGS
0.0% 0.0%
Not Valid -44.4% 0.0%
-33.3% 0.0% $3,000,000 - $3,999,999
Not Valid
Not Valid
$6,000,000 - $7,999,999
$10,000,000 and up
$0 - $999,999
$1,000,000 - $1,999,999
YEAR-TO-DATE
01/01/202209/30/2022
-25.0% -33.3%
83.3% -100.0%
100.0% -100.0%
-28.6% 0.0% $8,000,000 - $9,999,999
Not Valid
Valid
Not Valid
20.0% -100.0%
01/01/202109/30/2021
CHANGE 2022/2021 10/01/202109/30/2022 10/01/202009/30/2021
-80.0%
87.5%
$2,000,000 - $2,999,999
CHANGE 2022/2021
-66.7%
19 -5.3%
-41.9% $3,000,000 - $3,999,999
$5,000,000 - $5,999,999
$6,000,000 - $7,999,999
-38.5%
-35.3%
-12.5%
-33.3%
100.0%
$8,000,000 - $9,999,999
-25.0%
-40.0% $4,000,000 - $4,999,999
-14.3%
100.0%
-100.0%
-50.0%
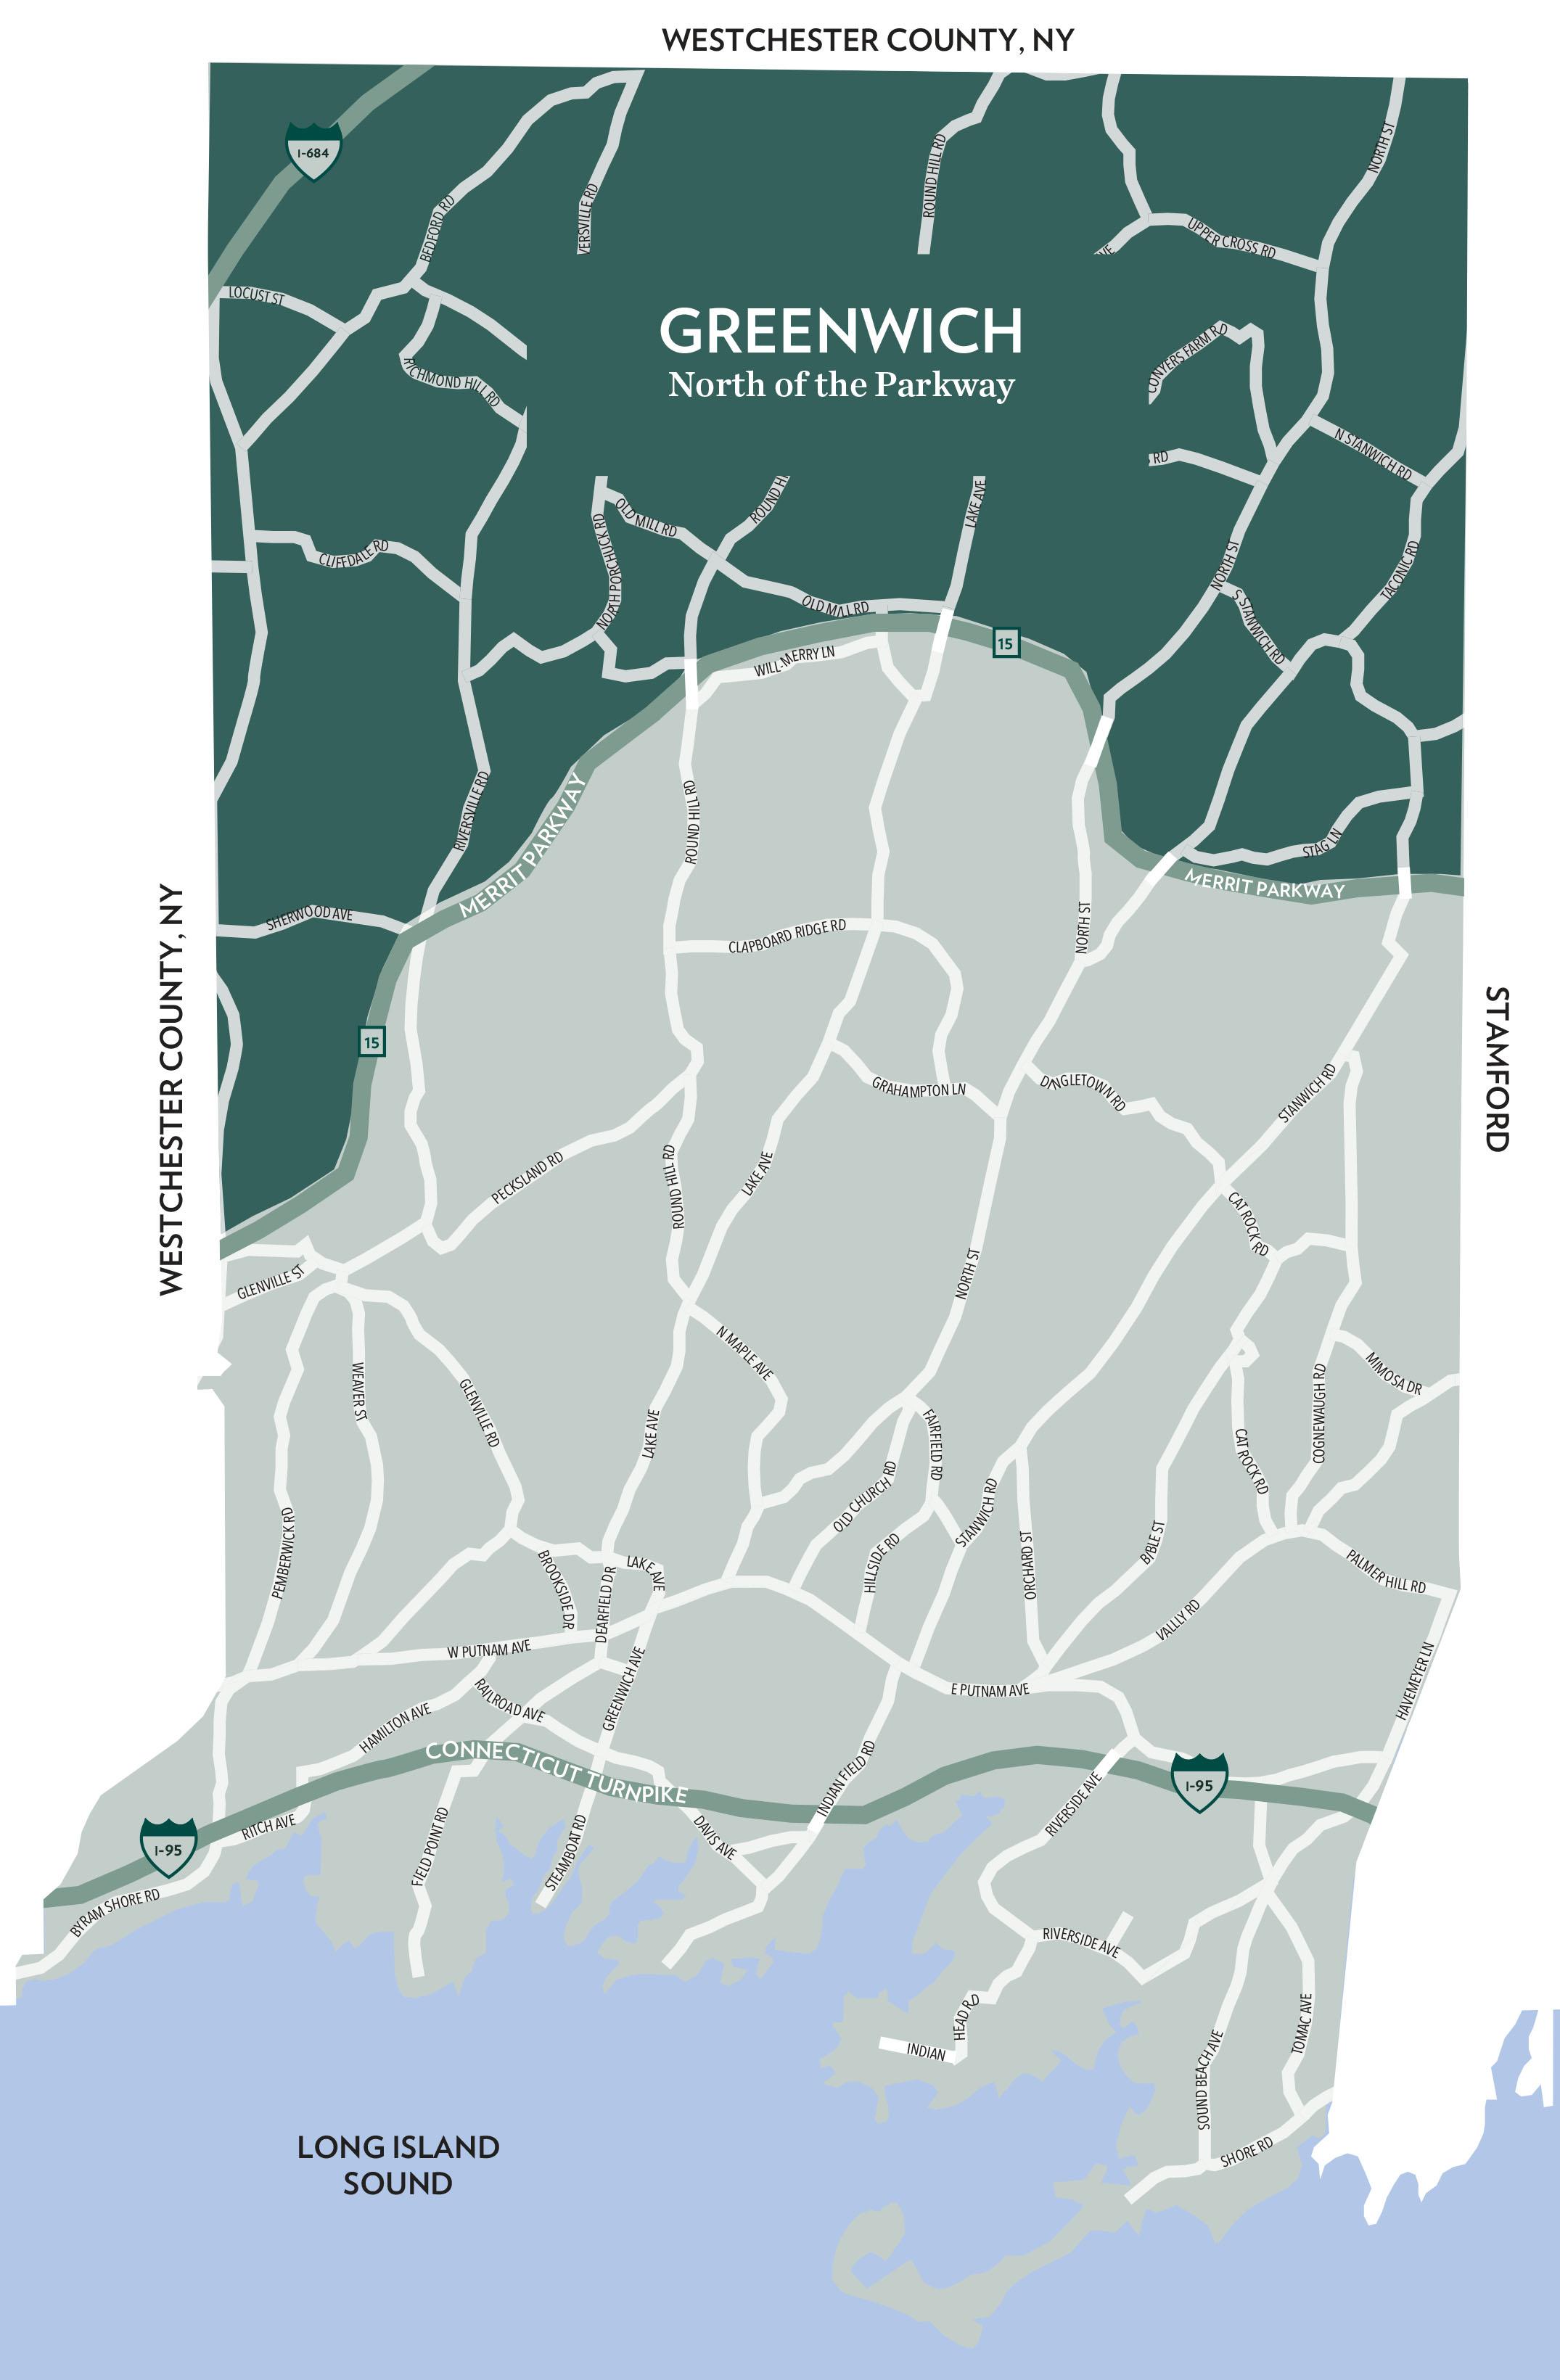
GREENWICH NORTH -22.2%
-66.7%
-85.7% $10,000,000 and
-32.5%
HOMES SOLD
Q3
Q3
% CHANGE YTD
YTD
% CHANGE
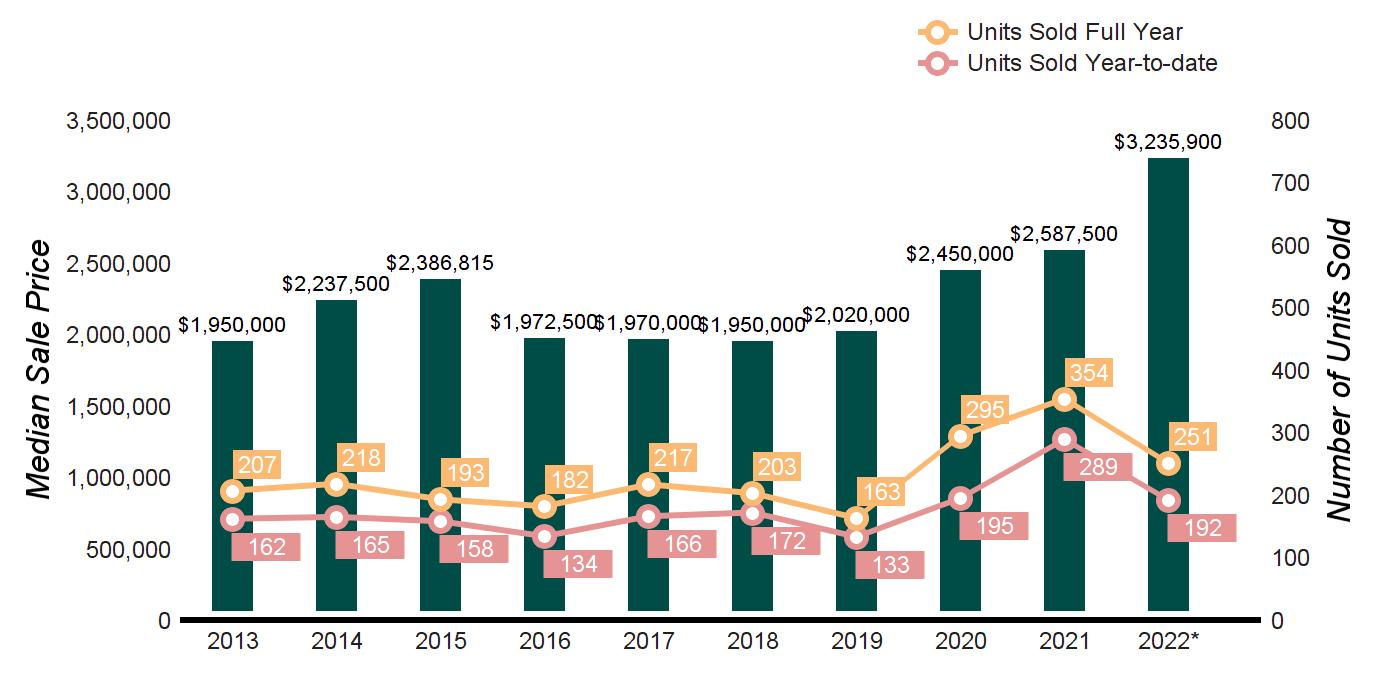
112 -37.5% 192 289 -33.6%
AVERAGE SALE PRICE $3,817,764 $3,201,436 19.3% $3,766,640 $3,292,439 14.4%
MEDIAN SALE PRICE $3,197,500 $2,500,000 27.9% $3,235,900 $2,750,000 17.7%
AVERAGE PRICE PER SQUARE FOOT $698 $609 14.6% $675 $591 14.2%
AVERAGE DAYS ON MARKET
95 -22.1% 99 130 -23.8%
% SALE PRICE TO LIST PRICE 100.1% 98.1% 2.0% 99.2% 97.1% 2.2%
year-to-date.
AS OF SEPTEMBER 30, 2022
PRICE RANGE
$0 - $999,999
$1,000,000 - $1,999,999
$2,000,000 - $2,999,999
$3,000,000 - $3,999,999
$4,000,000 - $4,999,999
$5,000,000 - $5,999,999
SUPPLY: ACTIVE LISTINGS
DEMAND: PENDING SALES
$6,000,000 - $7,999,999
$10,000,000 and up
YEAR-TO-DATE
01/01/202209/30/2022
SUPPLY/ DEMAND RATIO*
AS OF SEPTEMBER 30, 2021
SUPPLY: ACTIVE LISTINGS
$0 - $999,999
$1,000,000 - $1,999,999
DEMAND: PENDING SALES
SUPPLY/ DEMAND RATIO*
2022 vs. 2021
% CHANGE IN LISTINGS
% CHANGE IN PENDINGS
-42.9% -50.0%
-26.7% -50.0%
-23.1% -66.7%
-43.8% -37.5%
-7.7% -50.0%
-14.3% 200.0%
01/01/202109/30/2021 % CHANGE 2022/2021 10/01/202109/30/2022
-45.9%
-43.6%
-50.0% -66.7%
-57.1% 0.0% $8,000,000 - $9,999,999
-100.0%
10/01/202009/30/2021
CHANGE 2022/2021
45 -40.0%
87 -42.5% $2,000,000 - $2,999,999
-45.6% 55 96 -42.7% $3,000,000 - $3,999,999
$5,000,000 - $5,999,999
$6,000,000 - $7,999,999
-34.0% 40 58 -31.0% $4,000,000 - $4,999,999
-11.5%
11.8%
-34.6%
32 -12.5%
24 -16.7%
31 -35.5% $8,000,000 - $9,999,999
-10.0%
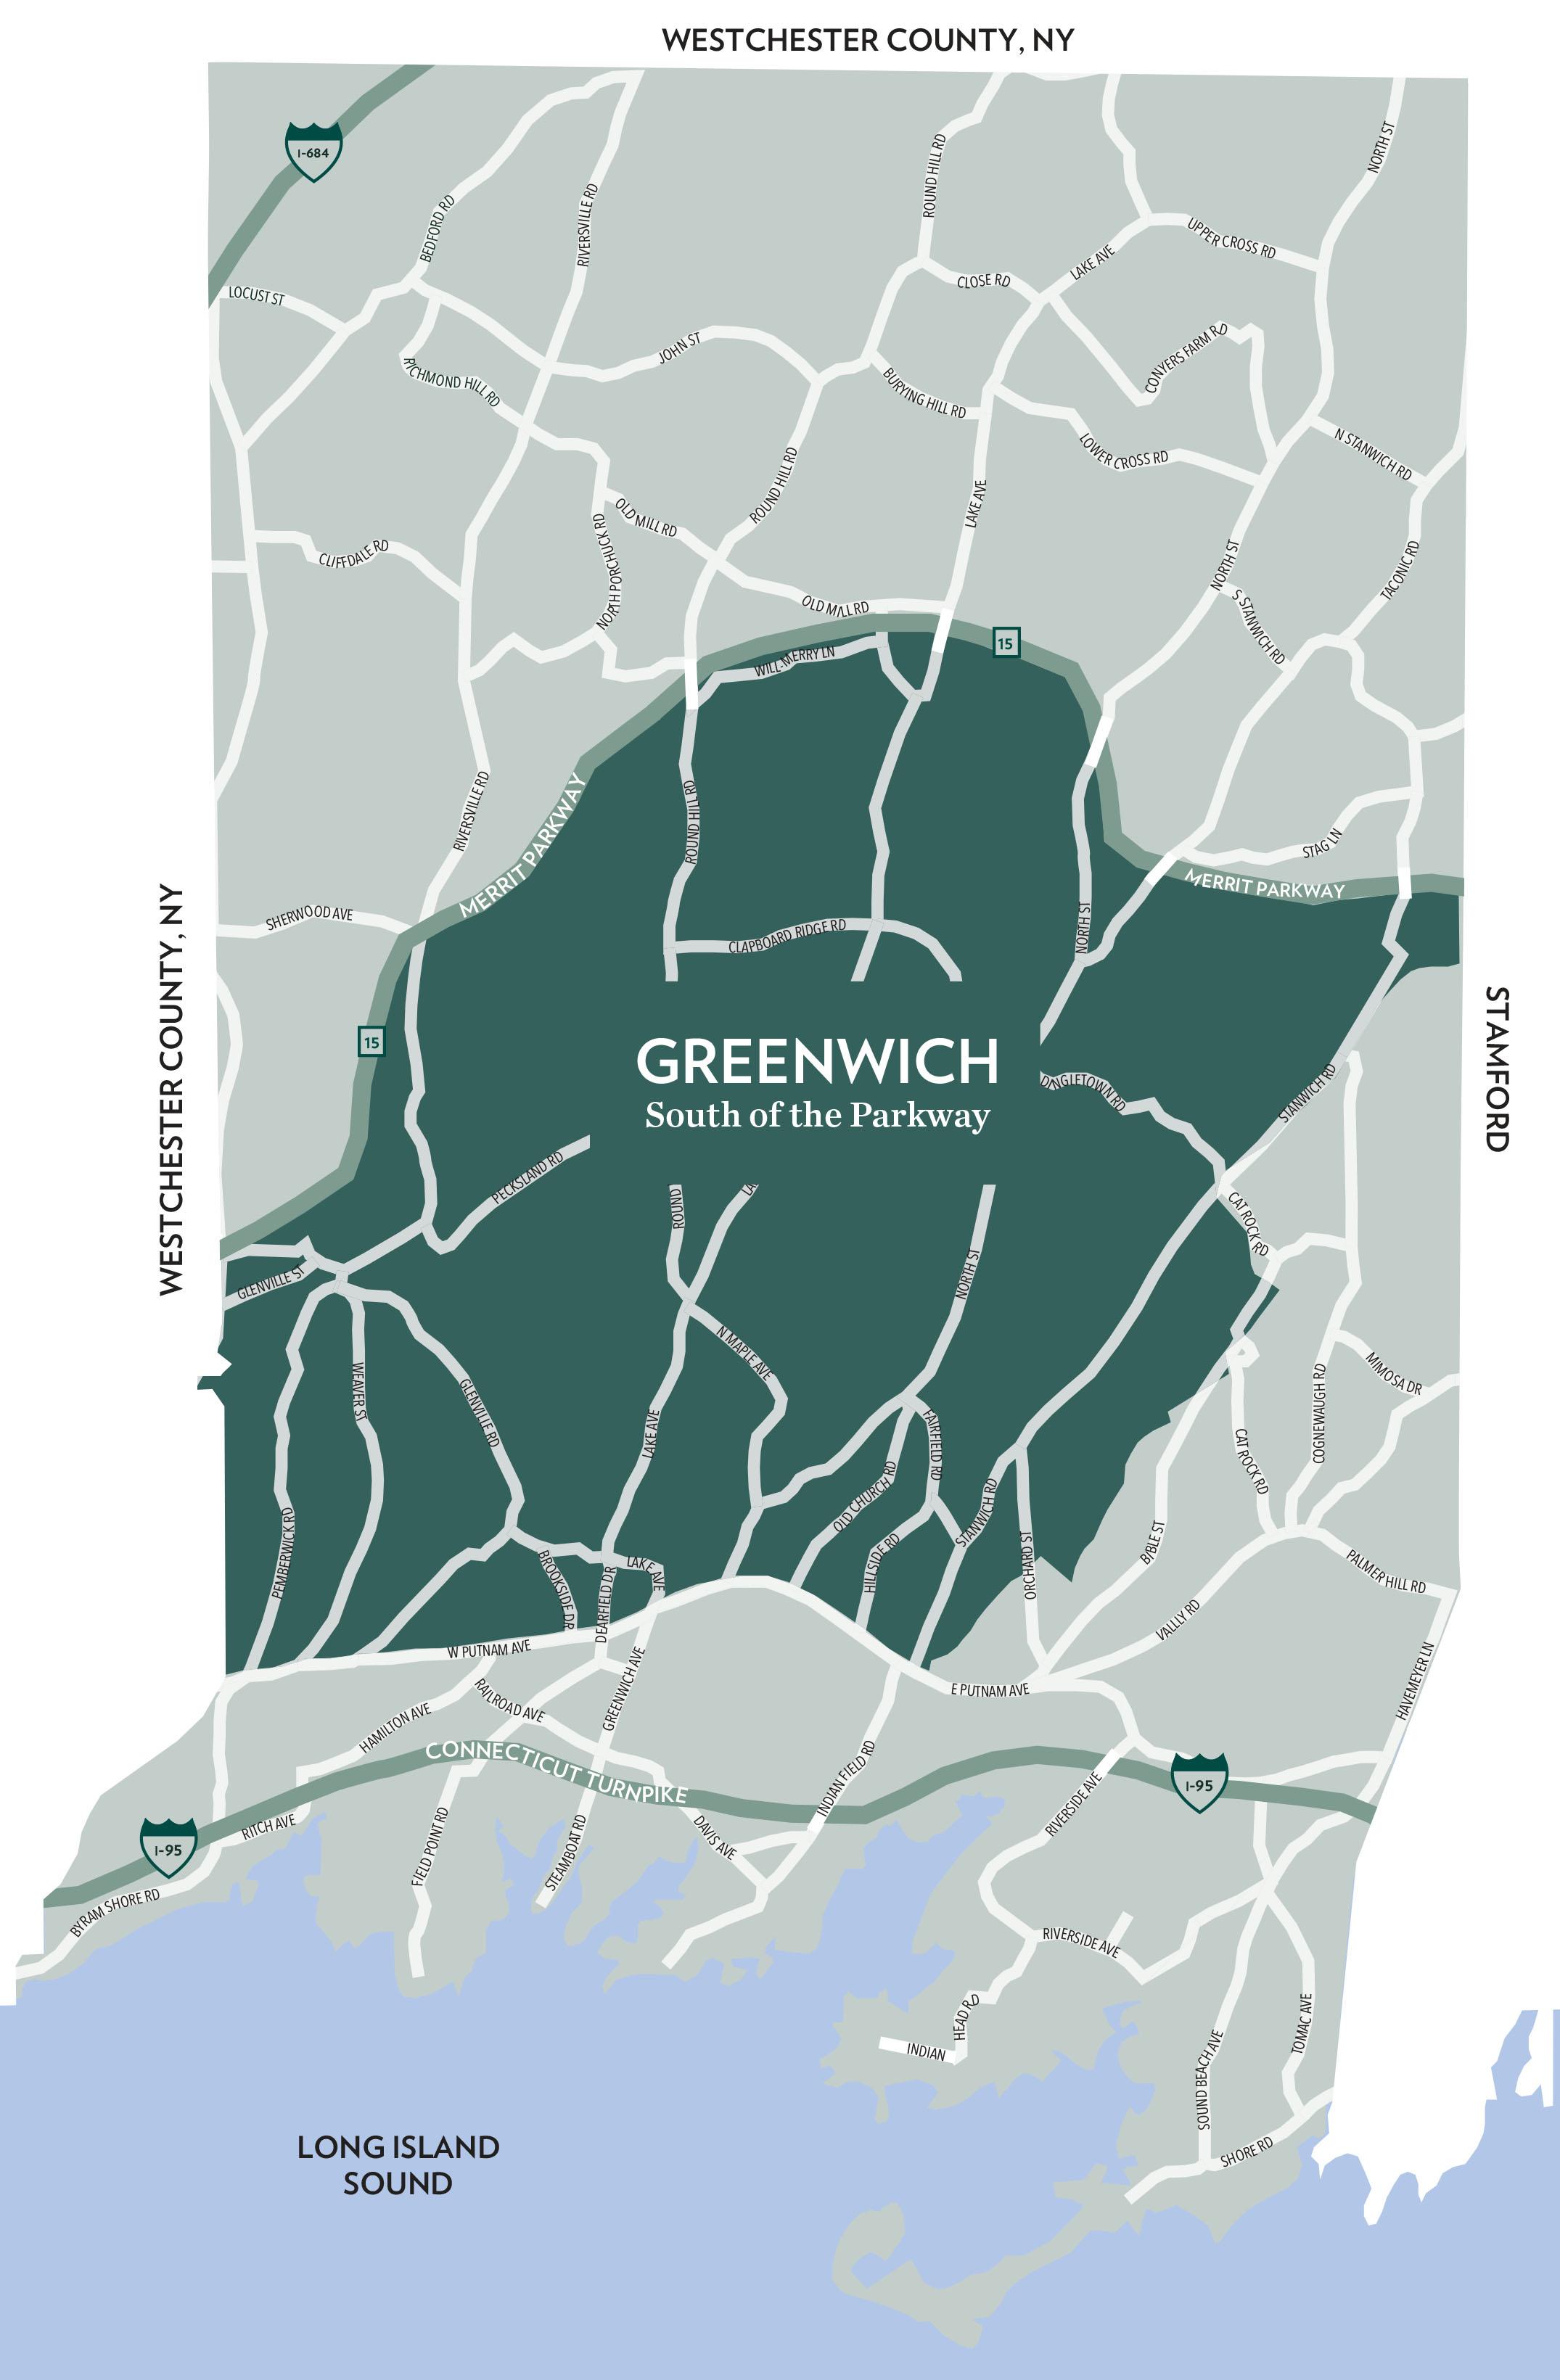
GREENWICH SOUTH -33.6%
12 -8.3% $10,000,000 and up
66.7%
50.0%
PARKWAY -33.9%
Q3 2022 Q3 2021 % CHANGE YTD 2022 YTD 2021 % CHANGE
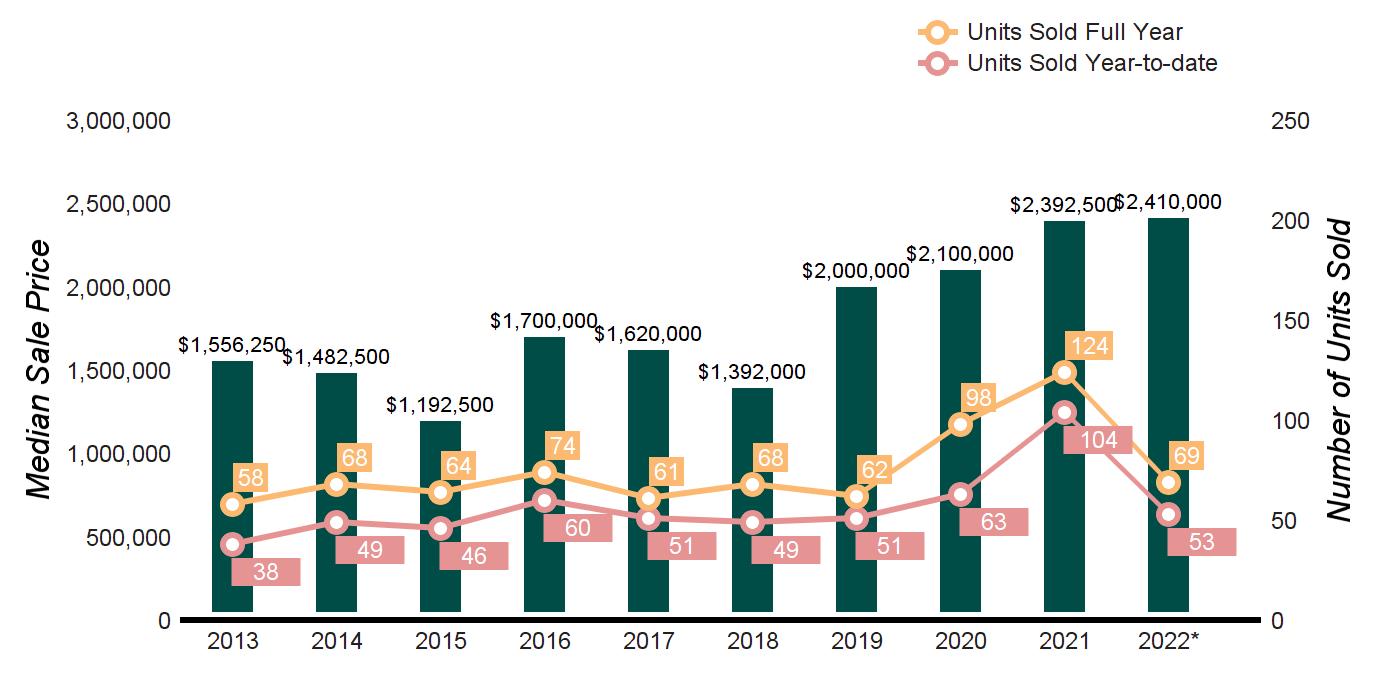
HOMES SOLD 15 34 -55.9% 53 104 -49.0%
AVERAGE SALE PRICE $3,757,800 $3,289,024 14.3% $3,209,018 $3,428,421 -6.4%
MEDIAN SALE PRICE $4,400,000 $2,247,500 95.8% $2,410,000 $2,362,500 2.0%
AVERAGE PRICE PER SQUARE FOOT $768 $688 11.6% $712 $704 1.1%
AVERAGE DAYS ON MARKET 35 84 -58.3% 92 140 -34.3%
% SALE PRICE TO LIST PRICE 100.2% 97.1% 3.2% 100.2% 96.4% 3.9%
sold for 2022 are annualized based
sales year-to-date.
PRICE RANGE
AS OF SEPTEMBER 30, 2022
SUPPLY: ACTIVE LISTINGS
DEMAND: PENDING SALES
$0 - $999,999 2 1 2
$1,000,000 - $1,999,999 3
$2,000,000 - $2,999,999
$4,000,000 - $4,999,999 1
$5,000,000 - $5,999,999 1
SUPPLY/ DEMAND RATIO*
Not Valid
AS OF SEPTEMBER 30, 2021
SUPPLY: ACTIVE LISTINGS
DEMAND: PENDING SALES
SUPPLY/ DEMAND RATIO*
2022 vs. 2021
% CHANGE IN LISTINGS
2
% CHANGE IN PENDINGS
2 -66.7% -66.7%
1 -50.0% -100.0%
2 5 -11.1% 0.0% $3,000,000 - $3,999,999 3
$6,000,000 - $7,999,999
$10,000,000 and up
$0 - $999,999
$1,000,000 - $1,999,999
YEAR-TO-DATE
01/01/202209/30/2022
-40.0% -50.0%
-66.7% 0.0%
Not Valid 0.0% 0.0%
300.0% 200.0% $8,000,000 - $9,999,999
Not Valid
01/01/202109/30/2021
Not Valid 0.0% 0.0%
Not Valid
CHANGE 2022/2021 10/01/202109/30/2022
-35.3%
-64.3%
$2,000,000 - $2,999,999
10/01/202009/30/2021
CHANGE 2022/2021
-48.0%
-60.0%
25 -56.0% $3,000,000 - $3,999,999
$5,000,000 - $5,999,999
-63.2%
-62.5% $4,000,000 - $4,999,999
$6,000,000 - $7,999,999
-63.6%
-11.1%
80.0%
0.0%
100.0%
-76.9% $8,000,000 - $9,999,999
-77.8%
Not Valid
100.0% $10,000,000 and
GREENWICH -55.6%
-83.3%
-47.5%
Q3 2022 Q3
% CHANGE YTD 2022 YTD
% CHANGE
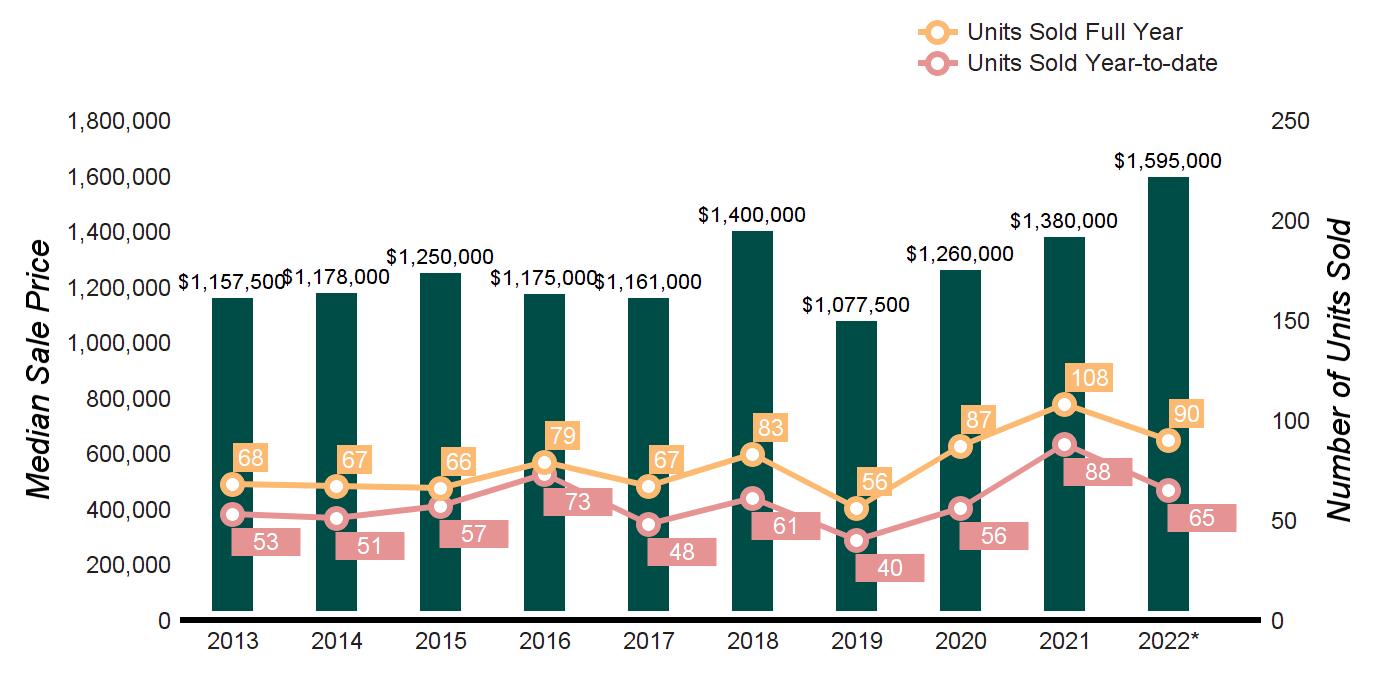
HOMES SOLD 19 39 -51.3% 65 88 -26.1%
AVERAGE SALE PRICE $1,647,296 $1,859,569 -11.4% $1,772,275 $1,678,275 5.6%
MEDIAN SALE PRICE $1,600,000 $1,895,000 -15.6% $1,595,000 $1,397,000 14.2%
AVERAGE PRICE PER SQUARE FOOT $580 $547 6.0% $581 $527 10.2%
AVERAGE DAYS ON MARKET 49 60 -18.3% 50 101 -50.5%
% SALE PRICE TO LIST PRICE 99.2% 98.4% 0.8% 101.4% 97.8% 3.7%
sold for 2022 are
based
sales year-to-date.
AS OF SEPTEMBER 30, 2022
PRICE RANGE
SUPPLY: ACTIVE LISTINGS
DEMAND: PENDING SALES
AS OF SEPTEMBER 30, 2021 2022 vs. 2021
SUPPLY/ DEMAND RATIO*
SUPPLY: ACTIVE LISTINGS
DEMAND: PENDING SALES
SUPPLY/ DEMAND RATIO*
% CHANGE IN LISTINGS
% CHANGE IN PENDINGS
$0 - $999,999 2 0 Not Valid 2 4 1 0.0% -100.0%
$1,000,000 - $1,999,999 17 0 Not Valid 15 7 2 13.3% -100.0%
$2,000,000 - $2,999,999 1 2 1 3 1 3 -66.7% 100.0% $3,000,000 - $3,999,999 2 1 2 2 0 Not Valid 0.0% 0.0% $4,000,000 - $4,999,999 0 0 Not Valid 0
$5,000,000 - $5,999,999
0 0 Not Valid 0
$6,000,000 - $7,999,999 0 0 Not Valid 0
Not Valid 0.0% 0.0%
Not Valid 0.0% 0.0%
Not Valid 0.0% 0.0%
$8,000,000 - $9,999,999
Not Valid
Not Valid
Not Valid 0.0% 0.0%
Not Valid 0.0% 0.0% $10,000,000 and up
0.0% -75.0%
$0 - $999,999
$1,000,000 - $1,999,999
$2,000,000 - $2,999,999
$3,000,000 - $3,999,999
$4,000,000 - $4,999,999
$5,000,000 - $5,999,999
$6,000,000 - $7,999,999
$8,000,000 - $9,999,999
$10,000,000 and up
YEAR-TO-DATE
01/01/202209/30/2022
01/01/202109/30/2021 % CHANGE 2022/2021 10/01/202109/30/2022 10/01/202009/30/2021 % CHANGE 2022/2021
-28.6%
-29.2%
-15.8%
-33.3%
0.0%
Not Valid
Not Valid
Not Valid
Not Valid
COS COB MarketTotals
-26.1%
22 -31.8%
65 -29.2%
25 -28.0%
6 -16.7%
0.0%
Not Valid
Not Valid
Not Valid
Not Valid
-28.6%
Q3 2022 Q3
% CHANGE YTD
YTD
% CHANGE
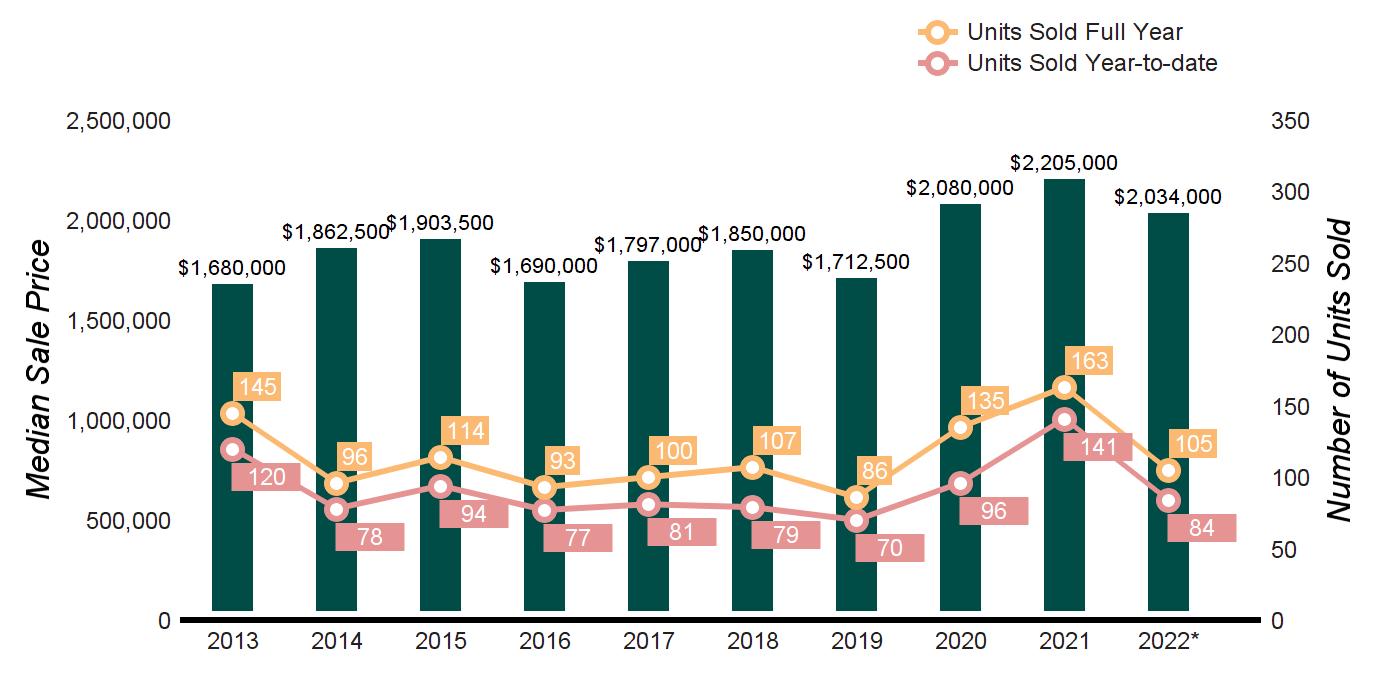
HOMES SOLD 36 51 -29.4% 84 141 -40.4%
AVERAGE SALE PRICE $2,570,152 $2,537,539 1.3% $2,521,627 $2,538,161 -0.7%
MEDIAN SALE PRICE $1,932,500 $2,195,000 -12.0% $2,034,000 $2,200,000 -7.5%
AVERAGE PRICE PER SQUARE FOOT $774 $691 12.0% $769 $663 16.0%
AVERAGE DAYS ON MARKET 38 56 -32.1% 53 76 -30.3%
% SALE PRICE TO LIST PRICE 102.0% 100.8% 1.2% 102.1% 99.8% 2.3%
sold
sales year-to-date.
AS OF SEPTEMBER 30, 2022
SUPPLY: ACTIVE LISTINGS
DEMAND: PENDING SALES
SUPPLY/ DEMAND RATIO*
AS OF SEPTEMBER 30, 2021 2022 vs. 2021
SUPPLY: ACTIVE LISTINGS
DEMAND: PENDING SALES
SUPPLY/ DEMAND RATIO*
% CHANGE IN LISTINGS
% CHANGE IN PENDINGS
$0 - $999,999 2 1 2 3 2 2 -33.3% -50.0%
$1,000,000 - $1,999,999 2 2 1 9 2 5 -77.8% 0.0%
$2,000,000 - $2,999,999 6 6 1 7 1 7 -14.3% 500.0% $3,000,000 - $3,999,999 5 1 5 5 1 5 0.0% 0.0% $4,000,000 - $4,999,999 2 2 1 3 1 3 -33.3% 100.0%
$5,000,000 - $5,999,999 0 2 0 2 1 2 -100.0% 100.0%
$6,000,000 - $7,999,999 1 0 Not Valid 0 1 0 0.0% -100.0%
$8,000,000 - $9,999,999
$0 - $999,999
$1,000,000 - $1,999,999
0.0% 0.0% $10,000,000 and up
01/01/202209/30/2022
01/01/202109/30/2021 % CHANGE 2022/2021 10/01/202109/30/2022 10/01/202009/30/2021 % CHANGE 2022/2021
-41.7%
-29.2%
$2,000,000 - $2,999,999
$4,000,000 - $4,999,999
$5,000,000 - $5,999,999
$6,000,000 - $7,999,999
$8,000,000 - $9,999,999
$10,000,000 and
15 -33.3%
-37.5%
-55.0%
-50.0%
28.6%
-66.7%
-75.0%
Not Valid
RIVERSIDE Not Valid
-40.4%
32 -56.3%
47 -53.2% $3,000,000 - $3,999,999
22.2%
-14.3%
-50.0%
Not Valid
-100.0%
-41.1%
Q3
Q3
% CHANGE YTD
YTD
% CHANGE
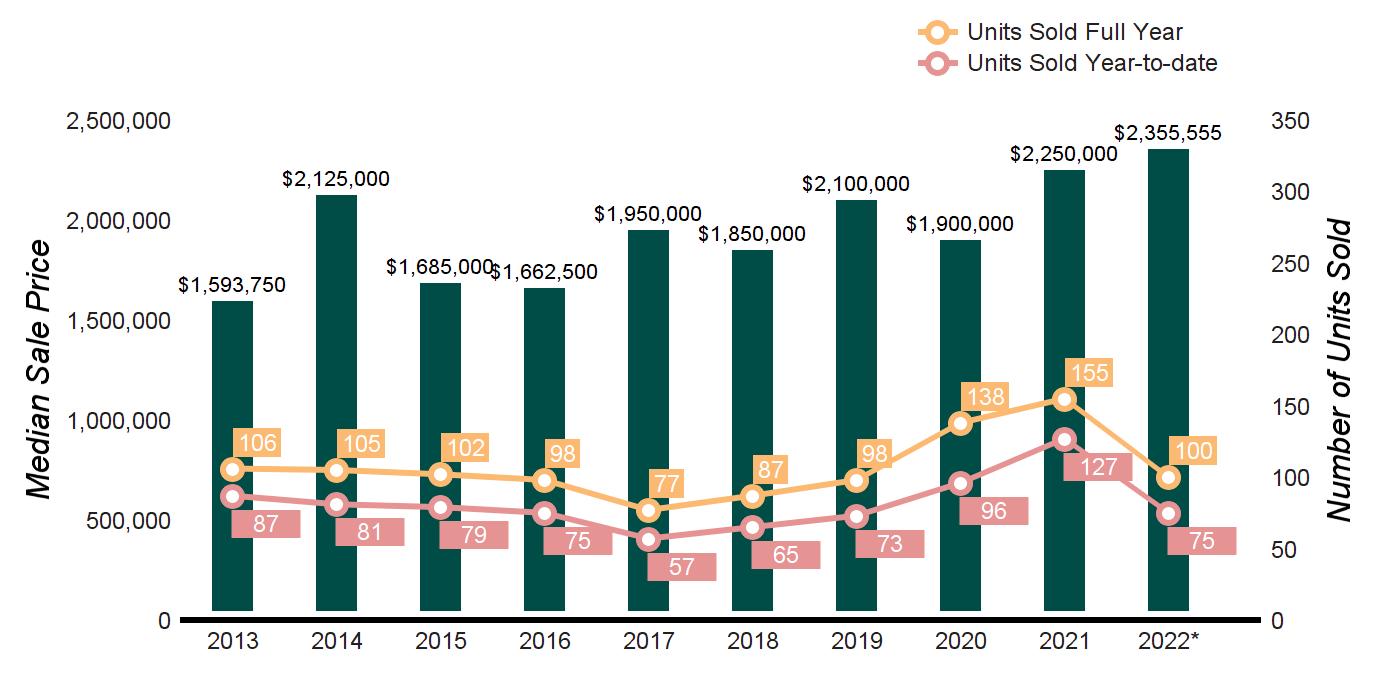
HOMES SOLD 37 57 -35.1% 75 127 -40.9%
AVERAGE SALE PRICE $2,597,357 $2,753,353 -5.7% $2,751,838 $2,609,975 5.4%
MEDIAN SALE PRICE $2,433,333 $2,250,000 8.1% $2,355,555 $2,250,000 4.7%
AVERAGE PRICE PER SQUARE FOOT $807 $789 2.3% $817 $747 9.4%
AVERAGE DAYS ON MARKET 23 38 -39.5% 45 58 -22.4%
% SALE PRICE TO LIST PRICE 104.1% 99.3% 4.8% 102.5% 99.1% 3.4%
sold
sales year-to-date.
AS OF SEPTEMBER 30, 2022
PRICE RANGE
$0 - $999,999
SUPPLY: ACTIVE LISTINGS
DEMAND: PENDING SALES
AS OF SEPTEMBER 30, 2021 2022 vs. 2021
SUPPLY/ DEMAND RATIO*
SUPPLY: ACTIVE LISTINGS
DEMAND: PENDING SALES
SUPPLY/ DEMAND RATIO*
% CHANGE IN LISTINGS
% CHANGE IN PENDINGS
1 0 Not Valid 2 0 Not Valid -50.0% 0.0%
$1,000,000 - $1,999,999 5 3 2 2 8 1 150.0% -62.5%
$2,000,000 - $2,999,999 3 4 1 3 5 1 0.0% -20.0% $3,000,000 - $3,999,999 2 2 1 1 0 Not Valid 100.0% 0.0% $4,000,000 - $4,999,999 2 0 Not Valid 4 0 Not Valid -50.0% 0.0%
$5,000,000 - $5,999,999
1 1 1 0 0 Not Valid 0.0% 0.0%
$6,000,000 - $7,999,999 1 0 Not Valid 4 1 4 -75.0% -100.0%
$8,000,000 - $9,999,999 0
$0 - $999,999
$1,000,000 - $1,999,999
YEAR-TO-DATE
01/01/202209/30/2022
Not Valid
Not Valid
Not Valid 0.0% 0.0%
Not Valid 0.0% 0.0% $10,000,000 and up 1
01/01/202109/30/2021 % CHANGE 2022/2021 10/01/202109/30/2022 10/01/202009/30/2021 % CHANGE 2022/2021
0.0%
-38.6%
8 -50.0%
62 -38.7%
$2,000,000 - $2,999,999
$4,000,000 - $4,999,999
-47.6%
-63.6%
0.0%
29 -65.5%
49 -32.7% $3,000,000 - $3,999,999
-20.0%
$5,000,000 - $5,999,999
$8,000,000 - $9,999,999
100.0%
-42.9%
Not Valid
OLD GREENWICH $10,000,000 and
Not
-22.2%
100.0% $6,000,000 - $7,999,999
-100.0%
Not Valid
HOMES
Q3
% CHANGE
YTD
% CHANGE
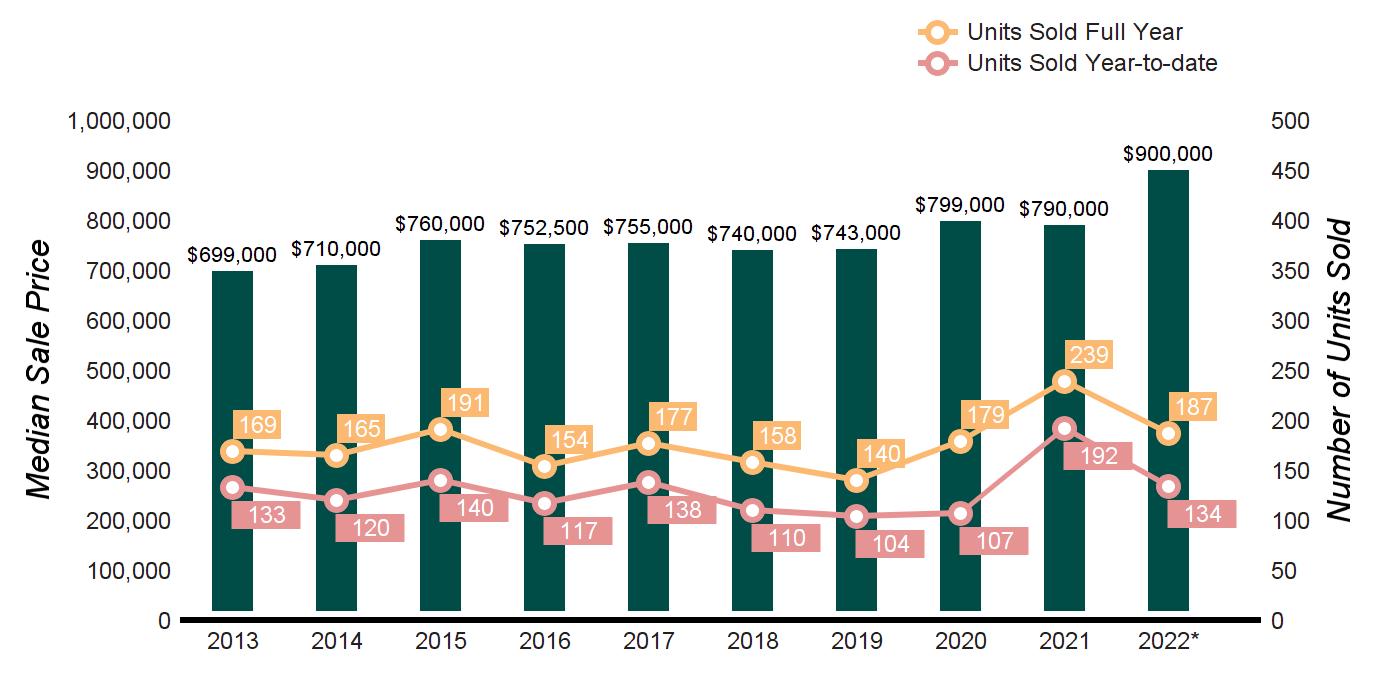
-42.9% 134 192 -30.2%
AVERAGE SALE PRICE $1,453,097 $1,138,967 27.6% $1,250,163 $1,062,445 17.7%
MEDIAN SALE PRICE $992,500 $780,000 27.2% $900,000 $771,625 16.6%
AVERAGE PRICE
AVERAGE DAYS
SQUARE FOOT $613 $583 5.1% $599 $541 10.7%
MARKET
112 -64.3% 61 117 -47.9%
98.3% 3.5% 101.8% 97.8% 4.1%
year-to-date.
AS OF SEPTEMBER 30, 2022
PRICE RANGE
$0 - $999,999
$1,000,000 - $1,999,999
$2,000,000 - $2,999,999
$3,000,000 - $3,999,999
$4,000,000 - $4,999,999
$5,000,000 - $5,999,999
SUPPLY: ACTIVE LISTINGS
DEMAND: PENDING SALES
AS OF SEPTEMBER 30, 2021
SUPPLY/ DEMAND RATIO*
SUPPLY: ACTIVE LISTINGS
DEMAND: PENDING SALES
SUPPLY/ DEMAND RATIO*
2022 vs. 2021
% CHANGE IN LISTINGS
% CHANGE IN PENDINGS
70.6% 30.8%
-42.9% 200.0%
-30.8% -75.0%
-16.7% 100.0%
Not Valid -100.0% 0.0%
Not Valid
Not Valid 0.0% 0.0%
$6,000,000 - $7,999,999
$10,000,000 and up
$0 - $999,999
$1,000,000 - $1,999,999
01/01/2022 -
Not Valid
Not Valid 0.0% 0.0% $8,000,000 - $9,999,999
Not Valid
Not Valid
01/01/2021 -
CHANGE 2022/2021 10/01/202109/30/2022 10/01/202009/30/2021
-43.9%
-5.1%
CHANGE 2022/2021
-43.2%
-9.1%
$2,000,000 - $2,999,999
44.4%
26.7% $3,000,000 - $3,999,999
$5,000,000 - $5,999,999
$6,000,000 - $7,999,999
$8,000,000 - $9,999,999
-30.0%
50.0%
Not Valid
Not Valid
Not Valid
Not Valid
50.0%
-43.8% $4,000,000 - $4,999,999
Not Valid
Not
GREATER GREENWICH CONDOMINIUMS Not Valid $10,000,000 and
Not
Leading Real Estates Companies of the World | Luxury Portfolio International Mayfair International Realty | Board of Regents Luxury Real Estate