Houlihan Lawrence Q2-2025 New Haven and Middlesex Counties Market Report
Q2-2025
EXECUTIVE SUMMARY
The real estate markets across New Haven and Middlesex Counties showed varied trends in the second quarter of 2025, reflecting a mix of steady demand and cautious buyer behavior.
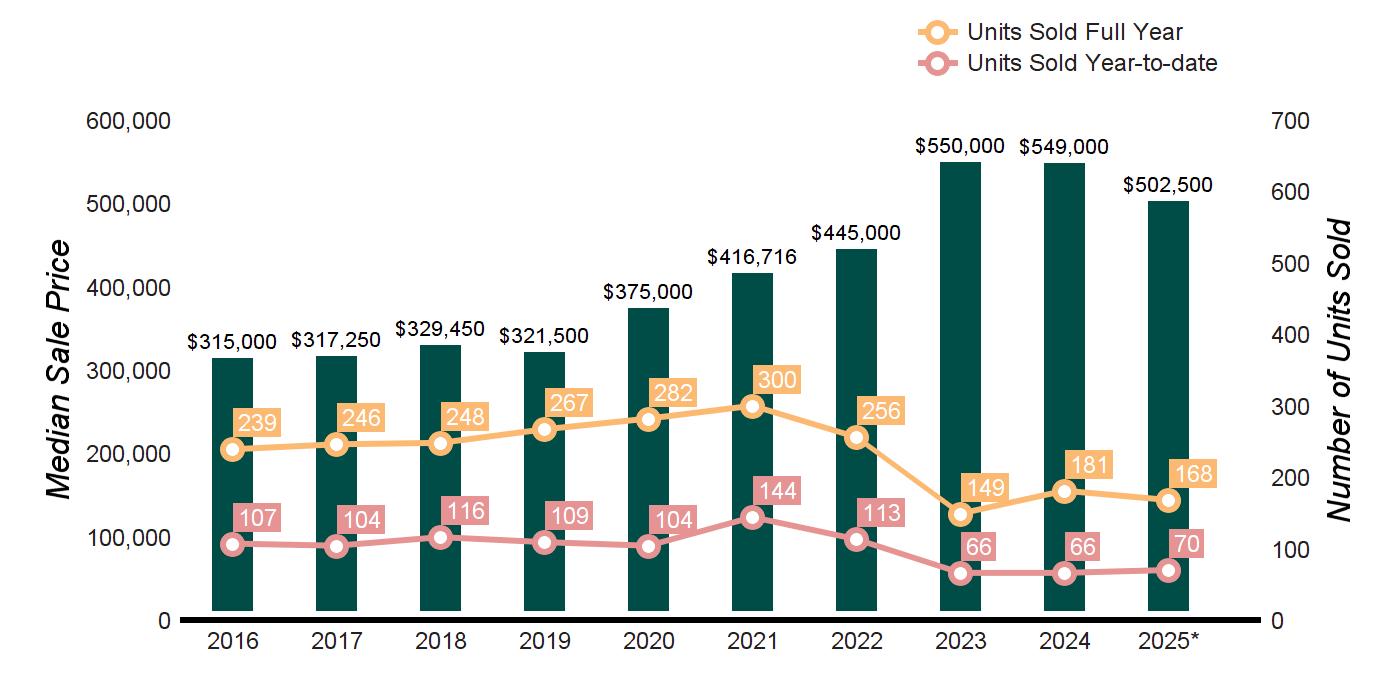
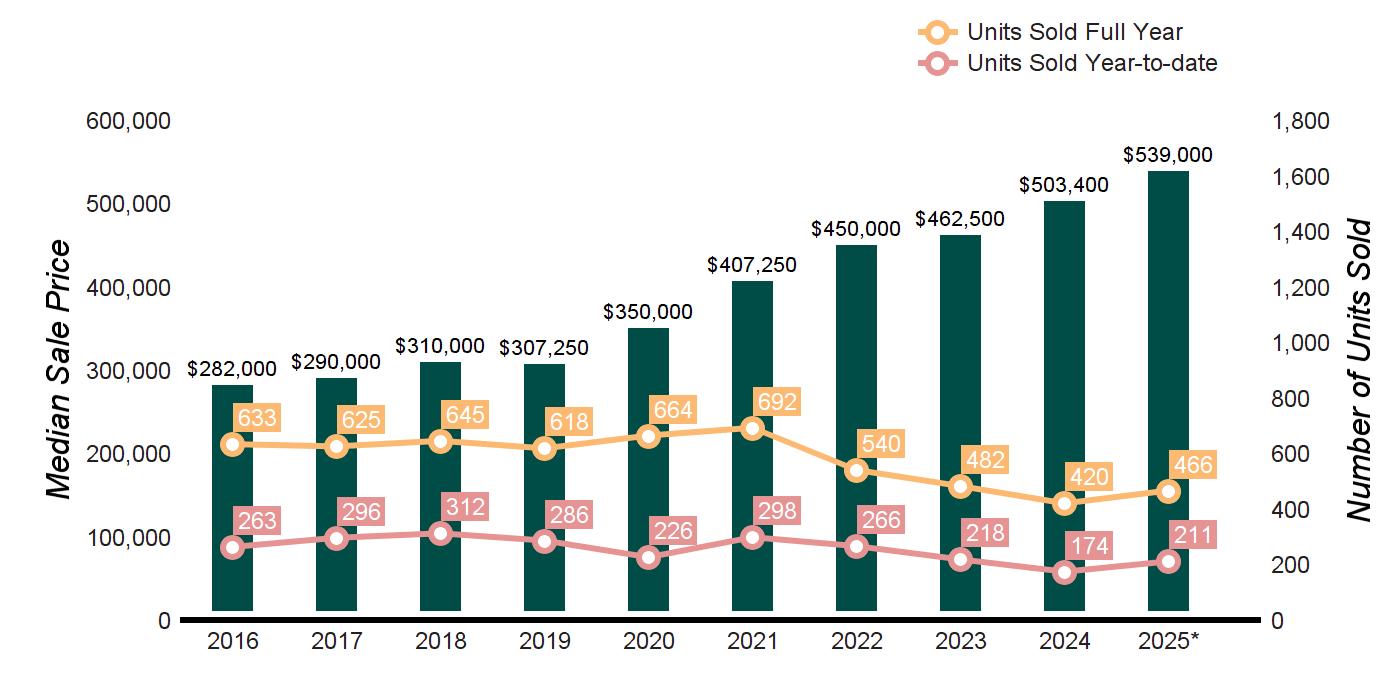
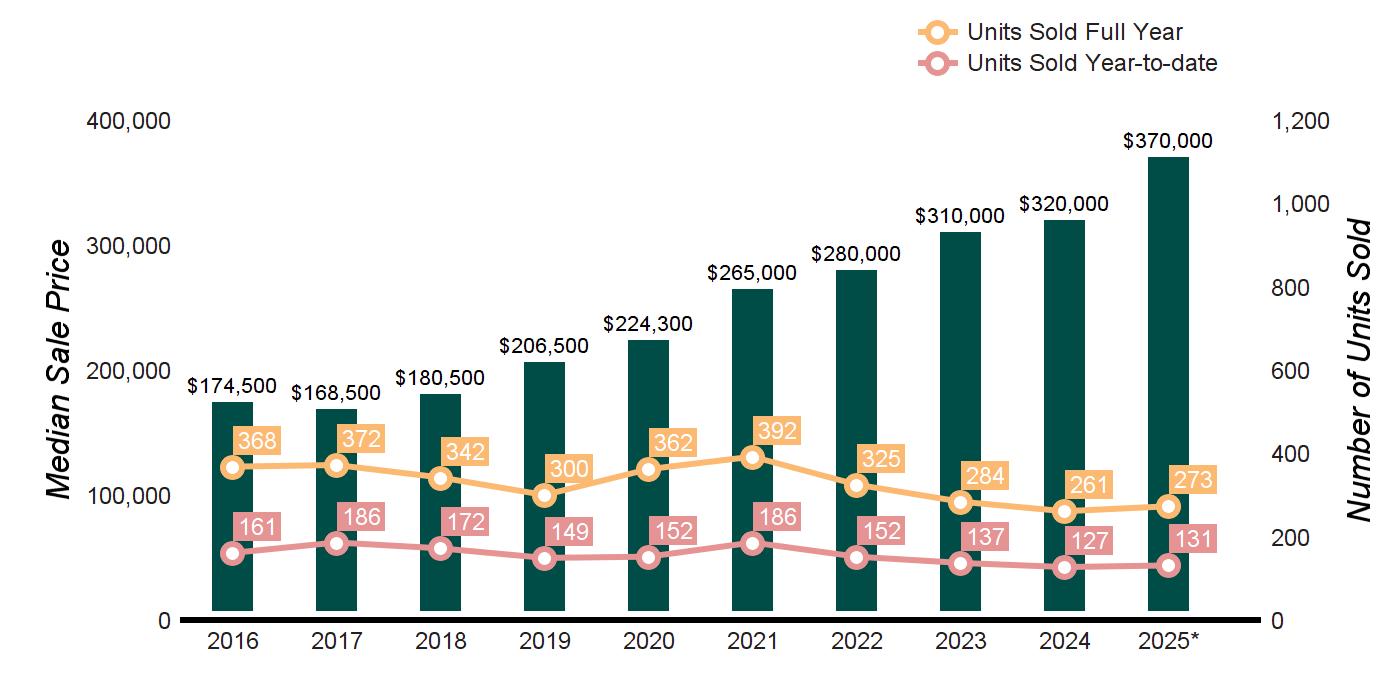
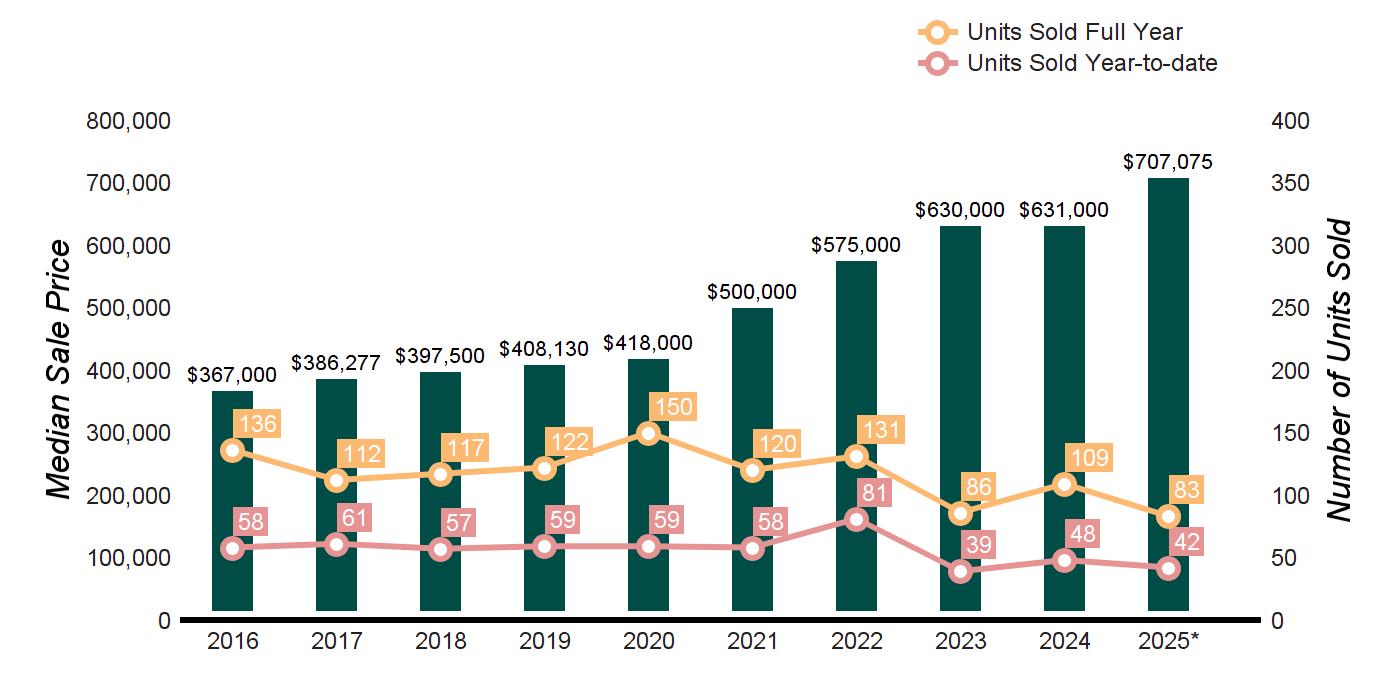
In New Haven County, Milford stands out with strong sales growth and steady price increases. Buyers remain active, and homes continue to sell near list price with quick turnaround times, indicating a balanced market with solid demand. Meanwhile, New Haven and Woodbridge experienced fewer sales but rising prices, especially in median values, suggesting that while transaction volume slowed, buyer interest remains focused on quality properties. Branford reported stable sales volume but a slight softening in prices and fewer pending contracts. This points to a market where buyers are becoming more selective, and pricing sensitivity is growing.
As we look ahead, we remain committed to guiding you through every step of your real estate journey. Sellers who price thoughtfully and present their homes well are continuing to see strong results. Buyers are still active but more selective, acting quickly on homes that are well located and move in ready. The market north of New York City is expected to keep rewarding quality, timing, and value.
With Warm Regards,
Liz Nunan President and CEO
TABLE OF CONTENTS
SECOND QUARTER 2025
NEW HAVEN COUNTY
Single Family Home Overview
ANSONIA BEACON FALLS BETHANY BRANFORD
CHESHIRE DERBY EAST HAVEN GUILFORD
HAMDEN MADISON MERIDEN MIDDLEBURY MILFORD NAUGATUCK NEW HAVEN NORTH BRANFORD
SEYMOUR
TABLE OF CONTENTS
SECOND QUARTER 2025
MIDDLESEX COUNTY
Single Family Homes Overview
DEEP RIVER DURHAM EAST HADDAM
EAST HAMPTON ESSEX HADDAM
KILLINGWORTH MIDDLEFIELD MIDDLETOWN
OLD SAYBROOK PORTLAND WESTBROOK
CHESTER CLINTON CROMWELL
BRANFORD
SECOND QUARTER 2025
QUARTERLY MARKET OVERVIEW
PENDING LISTINGS
MILFORD
SECOND QUARTER 2025
QUARTERLY MARKET OVERVIEW
MARKET HISTORY
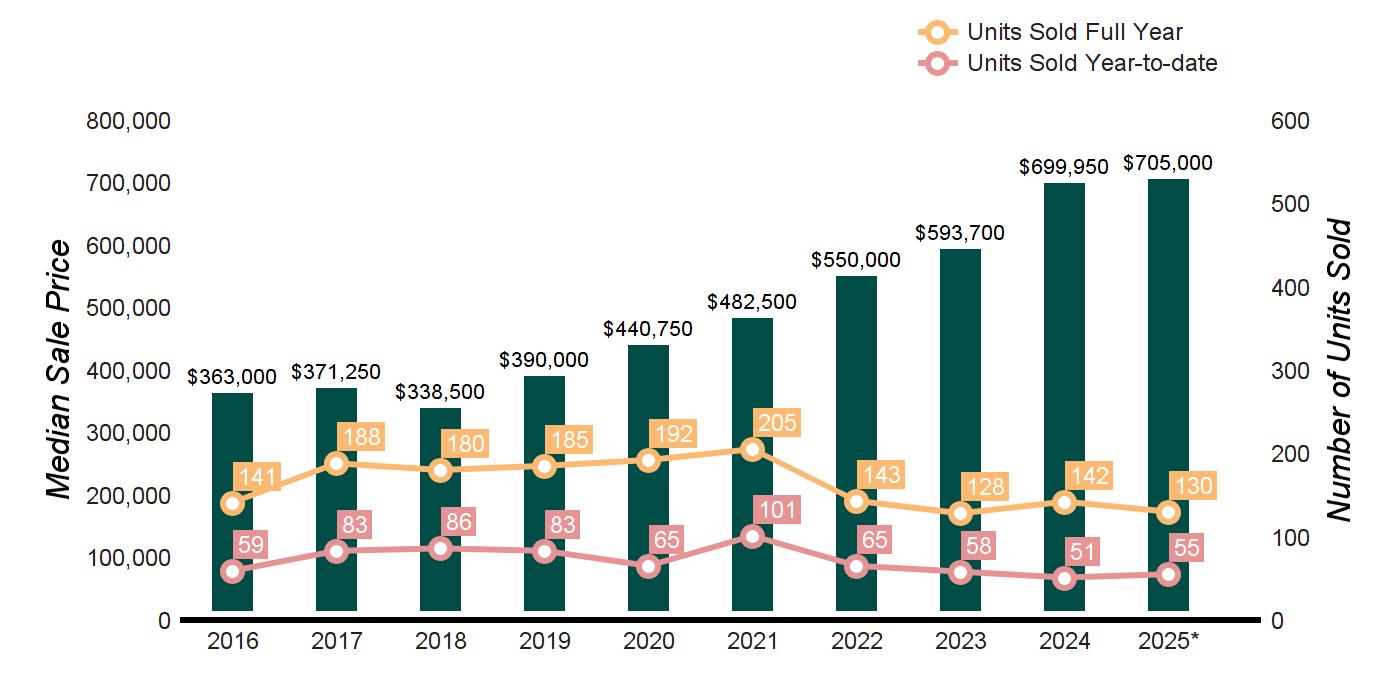
NEW HAVEN
SECOND QUARTER 2025
QUARTERLY MARKET OVERVIEW
WOODBRIDGE
SECOND QUARTER 2025
QUARTERLY MARKET OVERVIEW
PENDING
ANSONIA
QUARTERLY MARKET OVERVIEW
BEACON FALLS
ACTIVE LISTINGS
Q2- 2025 vs Q2- 2024 -41.7%
PENDING LISTINGS
Q2- 2025 vs Q2- 2024 50.0%
Q2- 2025 vs Q2- 2024 0.0%
EAST HAVEN
ACTIVE LISTINGS
Q2- 2025 vs Q2- 2024 25.7%
PENDING LISTINGS
Q2- 2025 vs Q2- 2024 -23.8%
LISTINGS
Q2- 2025 vs Q2- 2024 -6.9%
GUILFORD
QUARTERLY MARKET OVERVIEW
HAMDEN
ACTIVE LISTINGS
Q2- 2025 vs Q2- 2024 -26.9%
PENDING LISTINGS
Q2- 2025 vs Q2- 2024 9.8%
Q2- 2025 vs Q2- 2024 -14.8%
MADISON
QUARTERLY MARKET OVERVIEW
MERIDEN
ACTIVE LISTINGS
Q2- 2025 vs Q2- 2024 -20.9%
PENDING LISTINGS
Q2- 2025 vs Q2- 2024 -23.4%
Q2- 2025 vs Q2- 2024 41.3%
MIDDLEBURY
QUARTERLY MARKET OVERVIEW
NAUGATUCK
ACTIVE LISTINGS
Q2- 2025 vs Q2- 2024 7.5%
PENDING LISTINGS
Q2- 2025 vs Q2- 2024 -7.4% SOLD LISTINGS
Q2- 2025 vs Q2- 2024 0.0% Source : Smart MLS, Single Family For Sale
NORTH BRANFORD
QUARTERLY MARKET OVERVIEW
NORTH HAVEN
Q2- 2025 vs Q2- 2024 3.1%
PENDING LISTINGS
Q2- 2025 vs Q2- 2024 -13.6%
Q2- 2025 vs Q2- 2024 -13.0% Source : Smart MLS, Single Family For Sale
ORANGE
QUARTERLY MARKET OVERVIEW
OXFORD
ACTIVE LISTINGS
Q2- 2025 vs Q2- 2024 -14.3%
PENDING LISTINGS
Q2- 2025 vs Q2- 2024 8.3%
Q2- 2025 vs Q2- 2024 -13.3%
PROSPECT
QUARTERLY MARKET OVERVIEW
SEYMOUR
ACTIVE LISTINGS
Q2- 2025 vs Q2- 2024 30.4%
PENDING LISTINGS
Q2- 2025 vs Q2- 2024 25.0%
Q2- 2025 vs Q2- 2024 -10.7%
SOUTHBURY
QUARTERLY MARKET OVERVIEW
WALLINGFORD
Q2- 2025 vs Q2- 2024 18.8%
PENDING LISTINGS
Q2- 2025 vs Q2- 2024 12.5%
Q2- 2025 vs Q2- 2024 25.9%
WATERBURY
QUARTERLY MARKET OVERVIEW
WEST HAVEN
Q2- 2025 vs Q2- 2024 3.5%
PENDING LISTINGS
Q2- 2025 vs Q2- 2024 -17.9%
LISTINGS
Q2- 2025 vs Q2- 2024 28.9%
WOLCOTT
QUARTERLY MARKET OVERVIEW
Source : Smart MLS, Single Family For Sale
OLD SAYBROOK
SECOND QUARTER 2025
QUARTERLY MARKET OVERVIEW
MARKET HISTORY
CHESTER
QUARTERLY MARKET OVERVIEW
CLINTON
ACTIVE LISTINGS
Q2- 2025 vs Q2- 2024 -3.2%
PENDING LISTINGS
Q2- 2025 vs Q2- 2024 -11.1%
Q2- 2025 vs Q2- 2024 -11.9%
CROMWELL
QUARTERLY MARKET OVERVIEW
DEEP RIVER
ACTIVE LISTINGS
Q2- 2025 vs Q2- 2024 16.7%
PENDING LISTINGS
Q2- 2025 vs Q2- 2024 -60.0%
LISTINGS
Q2- 2025 vs Q2- 2024 50.0%
DURHAM
QUARTERLY MARKET OVERVIEW
EAST HADDAM
Q2- 2025 vs Q2- 2024
PENDING LISTINGS
Q2- 2025 vs Q2- 2024 7.1%
Q2- 2025 vs Q2- 2024 -3.7%
EAST HAMPTON
QUARTERLY MARKET OVERVIEW
ESSEX
QUARTERLY MARKET OVERVIEW
ACTIVE LISTINGS
Q2- 2025 vs Q2- 2024 -10.7%
PENDING LISTINGS
Q2- 2025 vs Q2- 2024 0.0%
Q2- 2025 vs Q2- 2024
3.7%
HADDAM
QUARTERLY MARKET OVERVIEW
KILLINGWORTH
ACTIVE LISTINGS
Q2- 2025 vs Q2- 2024 0.0%
PENDING LISTINGS
Q2- 2025 vs Q2- 2024 -50.0%
Q2- 2025 vs Q2- 2024 -20.0%
MIDDLEFIELD
QUARTERLY MARKET OVERVIEW
MIDDLETOWN
ACTIVE LISTINGS
Q2- 2025 vs Q2- 2024 20.8%
PENDING LISTINGS
Q2- 2025 vs Q2- 2024 55.0%
Q2- 2025 vs Q2- 2024 -1.4% Source : Smart MLS, Single Family For Sale