Q1-2025


Q1-2025
The first quarter of 2025 told a nuanced story across New Haven and Middlesex Counties. In a landscape shaped by rising costs and cautious optimism, some towns surged forward while others paused to catch their breath. But underneath the numbers, a clear theme emerged: buyers are still here, they’re just more focused, more selective, and more intentional in their decisions.
In New Haven County, energy shifted toward value-driven towns like Milford and Naugatuck, where affordability and location created momentum. Cheshire proved to be a standout, with strong pricing gains and a swift pace of sales, a signal that homes offering space and quality continue to resonate. Other markets, like Hamden and North Haven, showed signs of hesitancy. Price growth persisted, but fewer deals closed, suggesting buyers are pausing rather than disappearing.
In Middlesex County, towns along the river and shoreline captured attention. East Hampton’s near 50% surge in closed sales set the tone, and places like Chester and Deep River followed with similar vibrancy. Smaller towns such as Durham and Killingworth experienced sharp price growth, though with limited inventory. Across the board, properties that were move-in ready and appropriately priced often sold quickly, while others lingered as buyers took a more measured approach.
As the spring market unfolds, the message is less about volume and more about alignment. When pricing, presentation, and lifestyle fit come together, buyers are ready to move. But they’re also more willing to wait if those elements are missing.
At Houlihan Lawrence, we understand that success in today’s market isn’t about chasing momentum, it’s about guiding clients through it with clarity, confidence, and unmatched local insight.
With Warm Regards,
Liz Nunan President and CEO

FIRST QUARTER 2025

ANSONIA BEACON FALLS BETHANY BRANFORD
CHESHIRE DERBY EAST HAVEN GUILFORD
HAMDEN MADISON MERIDEN MIDDLEBURY MILFORD NAUGATUCK NEW HAVEN NORTH BRANFORD
SEYMOUR
FIRST QUARTER 2025

DEEP RIVER DURHAM EAST HADDAM
EAST HAMPTON ESSEX HADDAM
KILLINGWORTH MIDDLEFIELD MIDDLETOWN
OLD SAYBROOK PORTLAND WESTBROOK


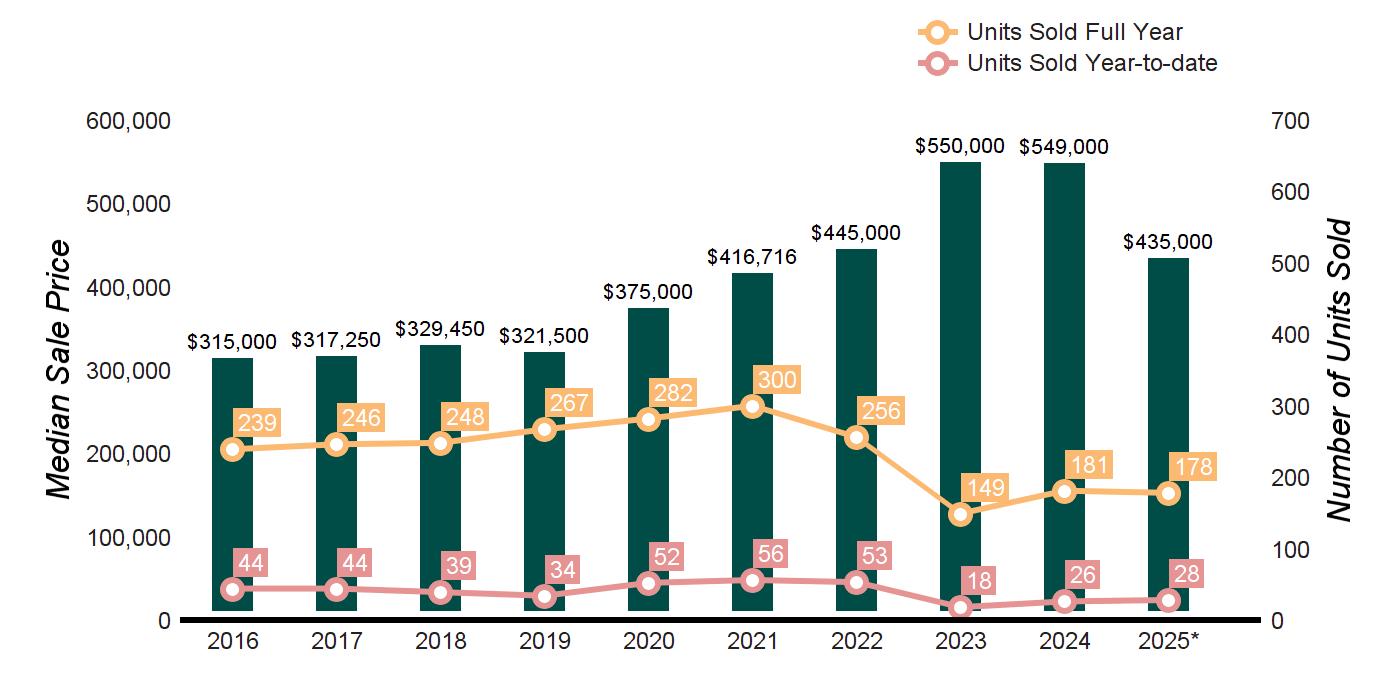

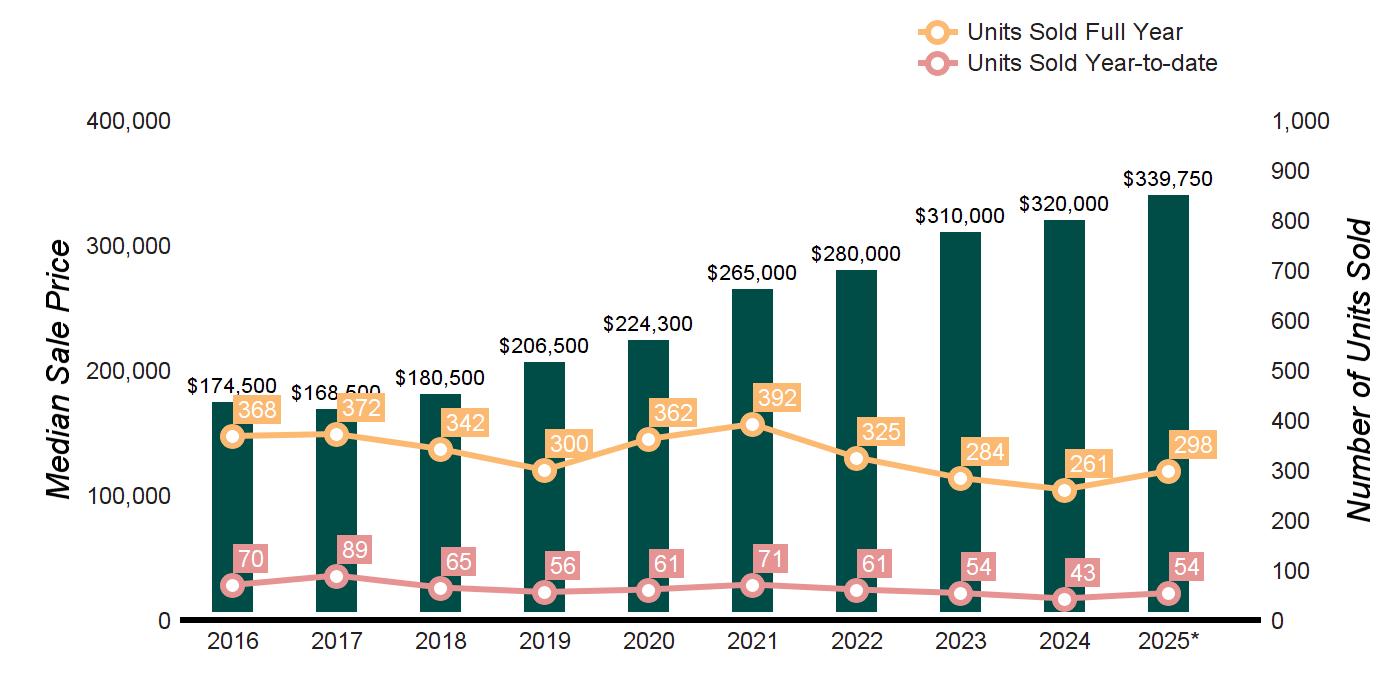
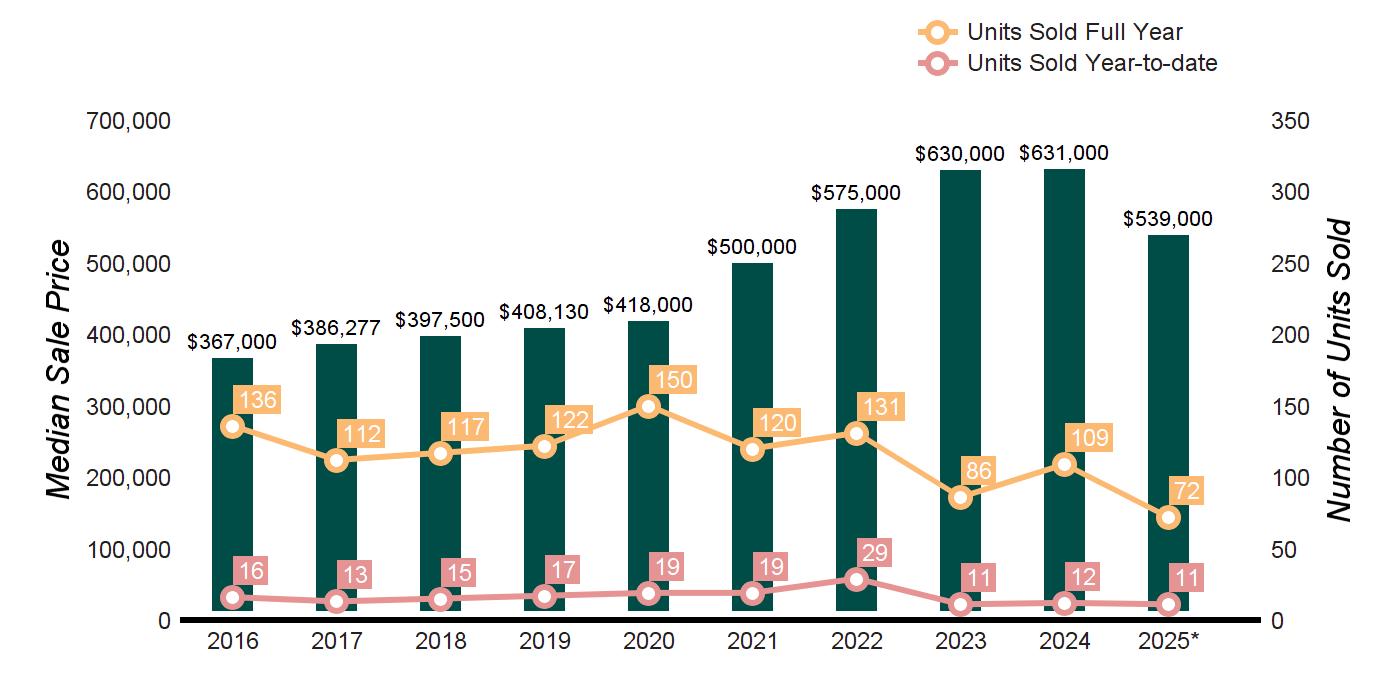
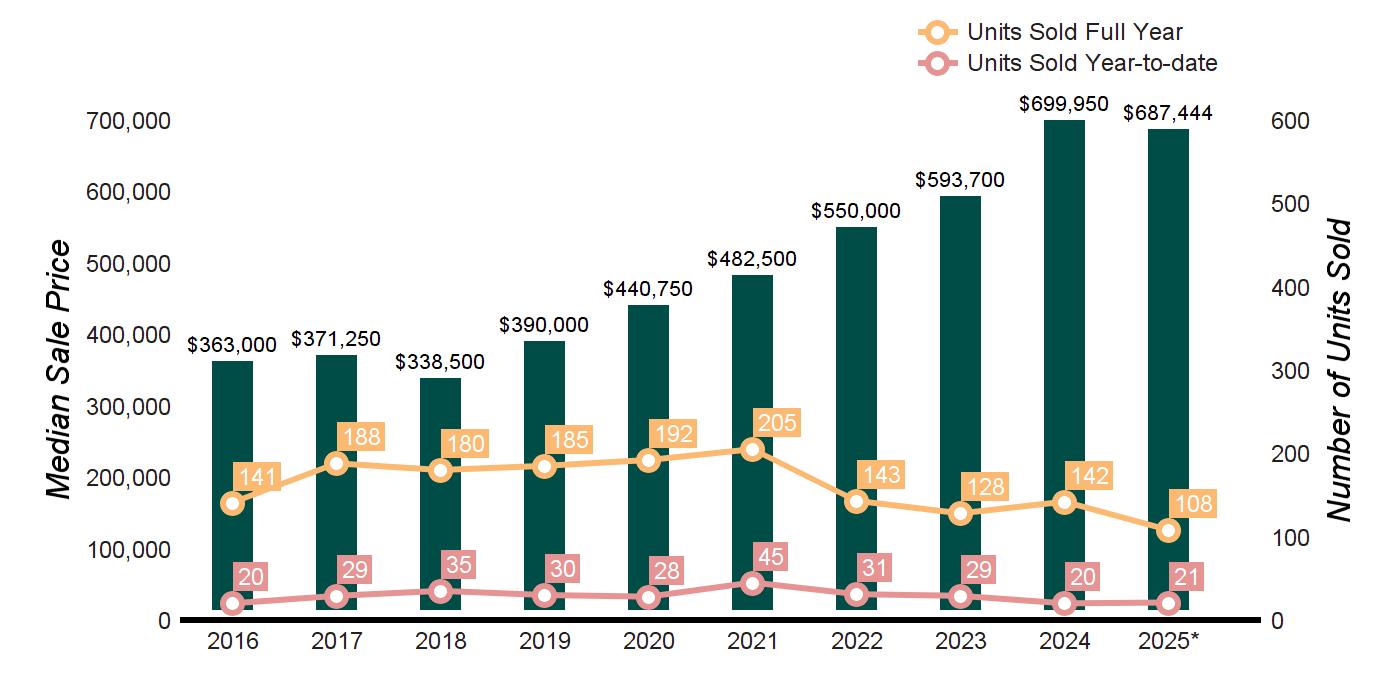
TEN-YEAR MARKET HISTORY
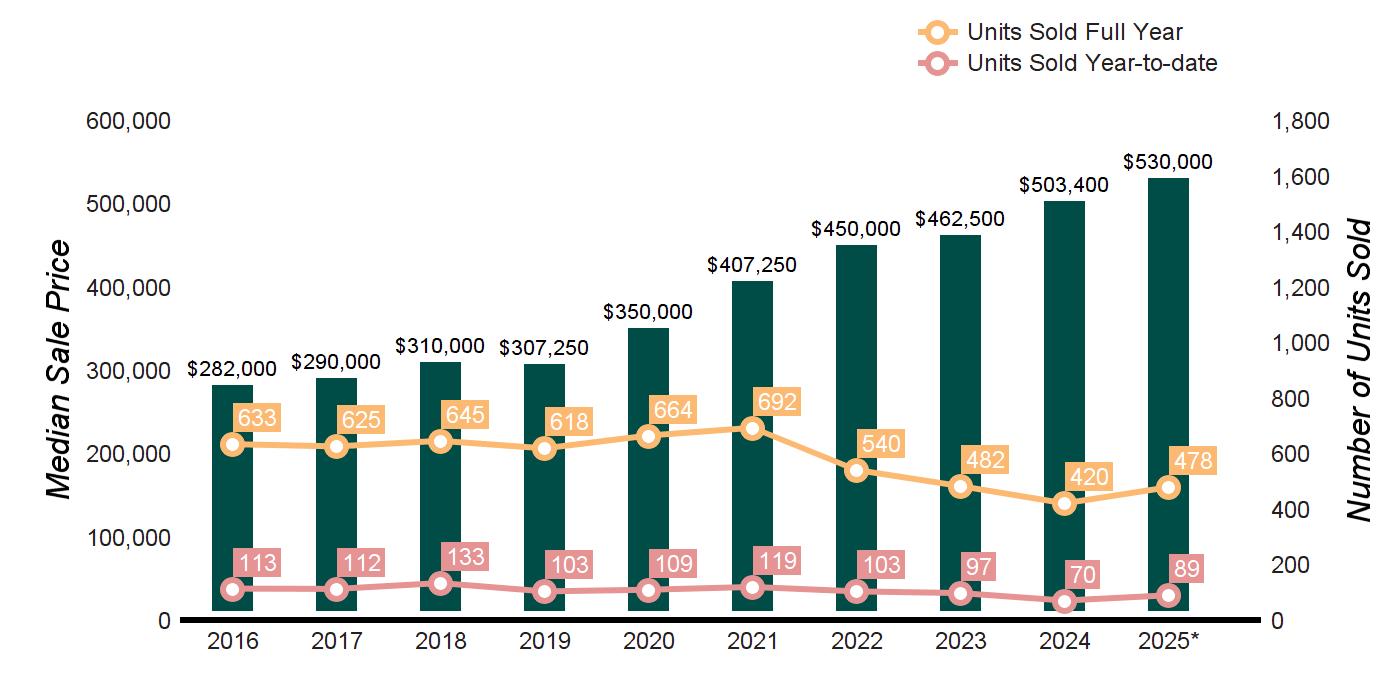

MARKET HISTORY


ACTIVE LISTINGS
Q1- 2025 vs Q1- 2024 -18.2%
PENDING LISTINGS
Q1- 2025 vs Q1- 2024 -50.0%
Q1- 2025 vs Q1- 2024 12.5%
QUARTERLY MARKET OVERVIEW


Q1- 2025 vs Q1- 2024 -26.7%
PENDING LISTINGS
Q1- 2025 vs Q1- 2024 -20.6%
Q1- 2025 vs Q1- 2024 22.2%


Q1- 2025 vs Q1- 2024 23.1%
PENDING LISTINGS
Q1- 2025 vs Q1- 2024 -15.0%
Q1- 2025 vs Q1- 2024 6.1% Source : Smart MLS, Single Family For Sale
QUARTERLY MARKET OVERVIEW


ACTIVE LISTINGS
Q1- 2025 vs Q1- 2024 -37.0%
PENDING LISTINGS
Q1- 2025 vs Q1- 2024 -29.4%
LISTINGS
Q1- 2025 vs Q1- 2024 -21.9%
QUARTERLY MARKET OVERVIEW


ACTIVE LISTINGS
Q1- 2025 vs Q1- 2024 4.8%
PENDING LISTINGS
Q1- 2025 vs Q1- 2024 56.0%
Q1- 2025 vs Q1- 2024 -19.1% Source : Smart MLS, Single Family For Sale
QUARTERLY MARKET OVERVIEW


ACTIVE LISTINGS
Q1- 2025 vs Q1- 2024 25.7%
PENDING LISTINGS
Q1- 2025 vs Q1- 2024 -18.8%
LISTINGS
Q1- 2025 vs Q1- 2024 22.2%
QUARTERLY MARKET OVERVIEW


ACTIVE LISTINGS
Q1- 2025 vs Q1- 2024 60.0%
PENDING LISTINGS
Q1- 2025 vs Q1- 2024 35.7%
Q1- 2025 vs Q1- 2024 -29.7%


ACTIVE LISTINGS
Q1- 2025 vs Q1- 2024 -31.8%
PENDING LISTINGS
Q1- 2025 vs Q1- 2024 11.1%
Q1- 2025 vs Q1- 2024 -20.0%
QUARTERLY MARKET OVERVIEW


Q1- 2025 vs Q1- 2024
PENDING LISTINGS
Q1- 2025 vs Q1- 2024 -36.4%
Q1- 2025 vs Q1- 2024 -42.3%
QUARTERLY MARKET OVERVIEW


Q1- 2025 vs Q1- 2024 17.4%
PENDING LISTINGS
Q1- 2025 vs Q1- 2024 0.0%
Q1- 2025 vs Q1- 2024 -5.9%


ACTIVE LISTINGS
Q1- 2025 vs Q1- 2024
20.9%
PENDING LISTINGS
Q1- 2025 vs Q1- 2024 28.6%
Q1- 2025 vs Q1- 2024 -6.9%

23.3%
Source : Smart MLS, Single Family For Sale

TEN-YEAR MARKET HISTORY
QUARTERLY MARKET OVERVIEW


ACTIVE LISTINGS
Q1- 2025 vs Q1- 2024
52.6%
PENDING LISTINGS
Q1- 2025 vs Q1- 2024 -30.0%
LISTINGS
Q1- 2025 vs Q1- 2024
20.0%
QUARTERLY MARKET OVERVIEW


Q1- 2025 vs Q1- 2024 60.0%
PENDING LISTINGS
Q1- 2025 vs Q1- 2024 300.0%
Q1- 2025 vs Q1- 2024 50.0%
QUARTERLY MARKET OVERVIEW


ACTIVE LISTINGS
Q1- 2025 vs Q1- 2024 -11.5%
PENDING LISTINGS
Q1- 2025 vs Q1- 2024 200.0%
LISTINGS
Q1- 2025 vs Q1- 2024 6.7%
QUARTERLY MARKET OVERVIEW


ACTIVE LISTINGS
Q1- 2025 vs Q1- 2024 -4.5%
PENDING LISTINGS
Q1- 2025 vs Q1- 2024 -42.9%
Q1- 2025 vs Q1- 2024 -13.3%
QUARTERLY MARKET OVERVIEW


ACTIVE LISTINGS
Q1- 2025 vs Q1- 2024 -16.7%
PENDING LISTINGS
Q1- 2025 vs Q1- 2024 0.0%
Q1- 2025 vs Q1- 2024 -23.1%
QUARTERLY MARKET OVERVIEW


Q1- 2025 vs Q1- 2024 45.2%
PENDING LISTINGS
Q1- 2025 vs Q1- 2024 23.8%
Q1- 2025 vs Q1- 2024 5.0% Source : Smart MLS, Single Family For Sale
QUARTERLY MARKET OVERVIEW


ACTIVE LISTINGS
Q1- 2025 vs Q1- 2024 52.9%
PENDING LISTINGS
Q1- 2025 vs Q1- 2024 -75.0%
Q1- 2025 vs Q1- 2024 -50.0%