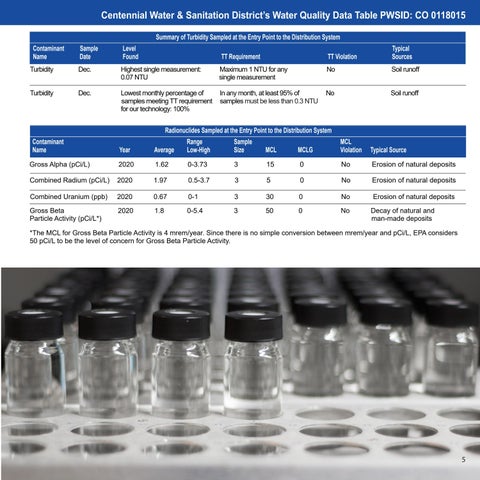
Centennial Water & Sanitation District’s Water Quality Data Table PWSID: CO 0118015 Summary of Turbidity Sampled at the Entry Point to the Distribution System Contaminant Name Turbidity
Sample Date
Level Found TT Requirement TT Violation
Dec.
Highest single measurement: Maximum 1 NTU for any No 0.07 NTU single measurement Turbidity Dec. Lowest monthly percentage of In any month, at least 95% of No samples meeting TT requirement samples must be less than 0.3 NTU for our technology: 100%
Typical Sources Soil runoff Soil runoff
Radionuclides Sampled at the Entry Point to the Distribution System Contaminant Name Year
Average
Range Low-High
Sample Size
MCL
MCLG
MCL Violation
Typical Source
Gross Alpha (pCi/L)
2020
1.62
0-3.73
3
15
0
No
Erosion of natural deposits
Combined Radium (pCi/L)
2020
1.97
0.5-3.7
3
5
0
No
Erosion of natural deposits
Combined Uranium (ppb)
2020
0.67
0-1
3
30
0
No
Erosion of natural deposits
0
No
Gross Beta 2020 1.8 0-5.4 3 50 Particle Activity (pCi/L*)
Decay of natural and man-made deposits
*The MCL for Gross Beta Particle Activity is 4 mrem/year. Since there is no simple conversion between mrem/year and pCi/L, EPA considers 50 pCi/L to be the level of concern for Gross Beta Particle Activity.
5


