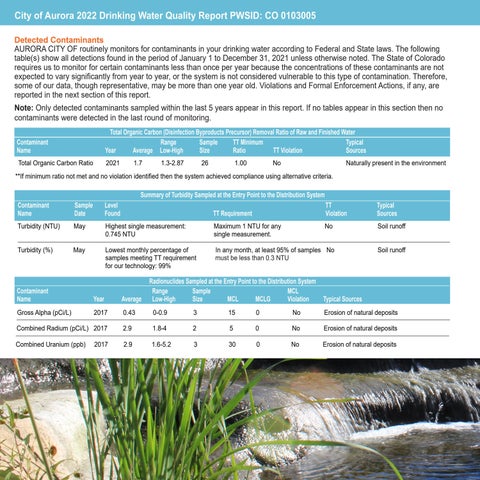
City City of of Aurora Aurora 2022 2022 Drinking Drinking Water Water Quality Quality Report Report PWSID: PWSID: CO CO 0103005 0103005 Detected Contaminants AURORA CITY OF routinely monitors for contaminants in your drinking water according to Federal and State laws. The following table(s) show all detections found in the period of January 1 to December 31, 2021 unless otherwise noted. The State of Colorado requires us to monitor for certain contaminants less than once per year because the concentrations of these contaminants are not expected to vary significantly from year to year, or the system is not considered vulnerable to this type of contamination. Therefore, some of our data, though representative, may be more than one year old. Violations and Formal Enforcement Actions, if any, are reported in the next section of this report. Note: Only detected contaminants sampled within the last 5 years appear in this report. If no tables appear in this section then no contaminants were detected in the last round of monitoring. Total Organic Carbon (Disinfection Byproducts Precursor) Removal Ratio of Raw and Finished Water Contaminant Range Sample TT Minimum Typical Name Year Average Low-High Size Ratio TT Violation Sources Total Organic Carbon Ratio
2021
1.7
1.3-2.87
26
1.00
No
Naturally present in the environment
**If minimum ratio not met and no violation identified then the system achieved compliance using alternative criteria.
Contaminant Name
Sample Date
Turbidity (NTU)
May
Summary of Turbidity Sampled at the Entry Point to the Distribution System Level TT Found TT Requirement Violation
Highest single measurement: 0.745 NTU Turbidity (%) May Lowest monthly percentage of samples meeting TT requirement for our technology: 99%
Maximum 1 NTU for any single measurement.
Typical Sources
No
Soil runoff
In any month, at least 95% of samples No must be less than 0.3 NTU
Soil runoff
Radionuclides Sampled at the Entry Point to the Distribution System Range Sample MCL Low-High Size MCL MCLG Violation Typical Sources
Contaminant Name Year
Average
Gross Alpha (pCi/L)
0.43
0-0.9
3
15
0
No
Erosion of natural deposits
Combined Radium (pCi/L) 2017
2.9
1.8-4
2
5
0
No
Erosion of natural deposits
Combined Uranium (ppb)
2.9
1.6-5.2
3
30
0
No
Erosion of natural deposits
2017
2017


