23 minute read
QRSS-Rx

from CC_259-2012
by Hiba Dweib

FEATUREARTICLE
by Clayton Gumbrell (Australia)
Advertisement
QRSS-Rx
A Network for Radio Communication
The QRSS-Rx features an mbed at the core of a QRSS receiver, which is an RF receiver that can digitize a small bandwidth of RF signals and send them to a server for processing into a spectrum image for real-time display on a website. This project is intended to improve the QRSS grabber system.
hat is QRSS? QRSS is one of many modes of communication and experimentation used byW radio amateurs. It is the transmission and reception of very slow-speed Morse transmissions at very low-power levels—typically less than 1 W, and often a lot less.
The term QRSS comes from the QRS Q-code (a message encoding system, or a brevity code, used by radio amateurs among others) meaning, “please send slower.” Due to the extreme slowness of this mode, QRS is adapted to QRSS. Morse speeds are usually specified in words per minute (WPM), but for QRSS speed is instead expressed in the period of a Morse dot. The commonly used speed of QRSS3 means a dot lasting for three seconds. This equates to about 0.4 WPM.
Due to the very slow speed—and using the magic of digital signal processing (DSP)—these transmissions can be extracted from below the noise and picked up from thousands of kilometers away. Reception is performed using “grabbers.” Audio from a receiver is fed into a computer sound card where software processes it to produce a spectrum image of a small portion of the radio spectrum, typically 100-Hz wide. This image is made available on a website, providing almost real-time access to how a signal is being received across the globe (see Photo 1).
The hardware involved with a grabber receive system is not insignificant. It requires a frequency-stable radio receiver, a PC (with soundcard), and an Internet connection. The receiver audio is fed into the PC soundcard. Software then converts the audio to an image. Additional software makes these images available on a webpage. There is a variety of different software configurations used, with each grabber having its own look and feel.
Each grabber is hosted on its own webpage—although there are some websites that will aggregate a number of grabbers onto the same page. Finding your signal can therefore require the inspection of a number of websites.
Dealing with such a small RF spectrum requires the grabber receiver to be precisely tuned to the frequency. Typically, a receiver will drift, so keeping a grabber on frequency can be challenging. Because of the challenges and required resources, there are few grabber stations operating, with only about a dozen grabbers commonly available.
ENTER THE QRSS-Rx
This project—the QRSS-Rx—is designed to improve the QRSS grabber system by putting together a “QRSS Network.”
Photo 1—An example of a QRSS grabber image. This image represents 10 minutes of spectrum activity. Note that some signals are sent as slow Morse, but others are graphical where the transmitted signal varies in frequency to create symbols or text in the spectrum image. (Photo courtesy of Peter Mulhare, ZL2IK)
Loose coupling to RF input Test OSC OSC Enable (digital OP)
10-MHz Bandpass filter
SoftRock SDR Quadrature
mixer
3.375 MHz 0° and 90°
Divide by 4
13.5 MHz I
Amps
Q Stereo
ADC I2S interface
13.5 MHz/384 35.156 ksps mbed (software)
Complex
multiply
FIR filter & decimator × 2 549 SPS UDP socket Ethernet
Sin lookup
Cos lookup
13.5-MHz Clock
Divide by 4,096
GPS NCO Timer UART
Capture Inputs
1 Pulse per second
NMEA (position data)
Figure 1—A block diagram of the QRSS-Rx. Signals come in the antenna, through the RF front-end, and are converted to digital. DSP software then processes the data before sending it out over Ethernet. A GPS module provides frequency calibration.
This network has a central server supported by a worldwide network of QRSS-Rx devices. The server manages the QRSS-Rx devices, accepts their data, and makes it available through a website as spectrum images. Spectrum data can therefore be presented in a synchronized and consistent manner, with a single webpage showing world-wide QRSS activity in almost real time.
The QRSS-Rx is the key to the construction of the QRSS network. The QRSS-Rx is small enough and inexpensive enough that it is likely to be more widely installed than the current grabber installation base. All that’s needed for a QRSS-Rx receive station is the QRSS-Rx, an Internet connection, an antenna, and power. The data rate from a single QRSS-Rx is relatively low—currently about 35 kbps—but it could be reduced a lot lower than this. It is unlikely to be noticeable in a user’s broadband capacity.
Once installed, the QRSS-Rx can operate completely automatically. Calibration, configuration, and even software updates can be managed from the server.
A grabber doesn’t need to tie up expensive radio and PC equipment and won’t require constant maintenance. This should encourage the grabber density to improve.
THE QRSS-RxDESIGN
The prototype QRSS-Rx is designed to be an inexpensive, simple, and self-contained unit (see Figure 1). It is based on the mbed NXP Semiconductors LPC1768 prototype printed circuit board (PCB). The NXP LPC1768 has an ARM Cortex-M3 Core running at 96 MHz, 512-KB flash, 64-KB RAM and lots of interfaces including Ethernet, universal serial bus (USB), serial peripheral interface (SPI), integrated interchip sound (I2S), and other I/O. The mbed is supported by an online development system including the compiler and a many libraries.
The RF front-end is a SoftRock receiver. This is a software-defined radio receiver available as a kit from radio amateur Tony Park (callsign KB9YIG). The SoftRock does the initial down convert from RF frequencies (at a center frequency of 10.125 MHz in this case) to audio frequencies. This is a quadrature converter. There are two mixers happening—one with the local oscillator (LO) and the other with a phase-shifted (by 90°) LO. The two outputs are referred to as the I (in-phase) and Q (quadrature phase) outputs. By generating both of these signals further processing can be used to distinguish the two sidebands (i.e., signals above the LO in frequency and signals below the LO in frequency). Without the two outputs, the audio would be a mixture of both sidebands with no way to separate them.
The SoftRock actually performs another trick called undersampling. Normally, the LO should operate at the 10.125 MHz central frequency, which would mean an oscillator frequency of four times this (40.5 MHz) to generate the quadrature clocks. This frequency is getting a bit high for the simple SoftRock hardware. Since we have a band-limited input (the RF input includes a 10-MHz band-pass filter), we February 2012 – Issue 259

Photo 2—The QRSS-Rx construction makes use of prototype printed circuit boards (PCBs), manually cut PCB tracks, and direct wiring.
can instead use undersampling and operate the LO at one third of what would otherwise be required (3.375 MHz).
Normally, the SoftRock output signals would be fed into a stereo PC soundcard where software implements a normal radio receiver. In the case of the QRSS-Rx, the signals feed directly into an analog-to-digital converter (ADC) device. A 24-bit stereo ADC with an I2S interface is used, compatible with the mbed I2S port. Using 24 bits enables us to support signals over a large dynamic range. To avoid the need for another oscillator, the converter is clocked by the SoftRock’s 3.375-MHz clock. The ADC sample rate is therefore 35.156 kilo samples per second (ksps). With this sample rate, the Nyquist sampling theorem tells us that we can capture signals up to 17.578 kHz (i.e., half the sample rate). With the quadrature down converter we can therefore capture signals within 17.578 kHz of the SoftRock central frequency of 10.125 Hz—or from about 10.107 MHz to 10.143 MHz. The primary QRSS band at 10.140 MHz is within this range.
Once the signal is sampled into the digital world, DSP takes over. Our frequency range of interest is from 10,140,000 Hz to 10,140,100 Hz—just 100-Hz wide. This is 15 kHz away from the 10.125-MHz central frequency. A DSP down convert operation is therefore performed. The I/Q data is treated as complex numbers (i.e., as a real and imaginary component). This enables the DSP to perform a frequency shift by doing a complex multiply between the signal samples and the software-generated oscillator (operating at 15 kHz) to bring the frequency band of interest down to 0 Hz. The down-converted output is then filtered with a software low-pass FIR filter having a cut-off frequency of about 200 Hz. Again, the Nyquist sampling theorem helps us. As we no longer have any signals above 200 Hz, only 400 samples per second are required. We can therefore decimate the samples by discarding samples above this Nyquist rate. The QRSS-Rx software actually decimates at a ratio of 1:64—only one sample per 64 is kept. This gives an output sample rate of 549 complex samples per second. The FIR filter uses 511 taps (i.e., it scales and sums up 511 samples); however, since most of the samples are discarded, it only needs to perform this calculation once for every 64 samples. Although this may still seem like a lot of calculations, the ARM processor running at 96 MHz easily performs it. The filter operation consists of 511 multiplies and 511 additions, 549 times per second, for each of the I and Q values. This is only about 1 million operations per second. The processed samples are then sent to the QRSS server over Ethernet using the user datagram protocol (UDP).
The prototype QRSS-Rx also includes a 10.14-MHz test oscillator. The CPU can turn this on and off, under instruction from the server. The oscillator output is loosely coupled to the RF input of the SoftRock by a wire loosely wrapped around the RF input. This oscillator is included to provide a signal to test the system performance.
KEEPING ON FREQUENCY
With such a small band of interest (100 Hz), frequency accuracy is important. The QRSS-Rx therefore includes an interface for a GPS receiver for calibration purposes. An inexpensive GPS module (eBay is your friend) provides GPS time

Figure 2—The QRSS-Rx circuit diagram
and location over a serial port and a precise timing pulse as a one pulse per second (1 pps) signal.
The QRSS-Rx software parses the serial port data to extract time and position information. The GPS 1-pps signal is connected to the LPC1768 internal timer capture input to capture the timer value at the 1-pps pulse. With this data, we can calculate the exact operating frequency of the CPU clock (96 MHz). In a similar way, the SoftRock LO frequency (3.375 MHz) is measured. The LO is divided by 16,384 (4 in the SoftRock itself, and 4,096 in a counter chip) to about 824 Hz and then fed to a CPU capture input. The software is interrupted every second by the 1 pps, and stores away the captured timer value for the 1 pps and the last LO capture. These values are passed up to the server where they can be used to determine the CPU clock frequency and thus the SoftRock LO frequency. Even though only every 824 LO captures are recorded (and captured asynchronously, so there may in fact be only 823 cycles), we can make assumptions on the clock accuracy and still get an accurate measure of the SoftRock LO frequency.
The server performs the necessary calculations to determine the CPU frequency of the QRSS-Rx and the true operating frequency of the SoftRock LO. Since the ADC is clocked from the SoftRock LO, the exact sample rate can also be determined. The server can then calculate the exact value for the DSP software oscillator to tune to the desired receive frequency. This setting is passed to the QRSS-Rx in a UDP message.
The GPS module also reports position. This is useful additional information for the QRSS server to position the receiver on the planet.
BUILD IT!
The QRSS-Rx prototype is assembled on a piece of blank double-sided PCB (see Photo 2). The PCB was hand-routed using a rotary tool and a dental bit to cut islands of copper in the board. Islands are cut for the mbed socket—a small pad for each mbed pin. Additional islands are cut for some of the powersupply circuits and the GPS connections. Other components are mounted on various prototype PCBs. All interconnections are then made using thin wire-wrap wire. The SoftRock RF PCB is mounted on the PCB and directly wired as necessary into the circuit.
The power regulator requires a heatsink. This is bolted down to the PCB and the regulator is mounted to it. A separate power supply (5 V and 3.3 V) is implemented for the ADC device and clock buffer to minimize noise into these devices.
The GPS module used has a 20-way
Poll Message—sent every six seconds from the QRSS-Rx to the server Offset Name Details 0 Poll message ID 10 4 Message protocol version 1 8 Hardware ID identifying the hardware structure type 1 12 Software version—the version of
QRSS-Rx software 1
16 GPS quality identified 0 = offline, 1 = online 20 GPS satellite count 24 GPS Time seconds since midnight UTC 28 Latitude millionths of a degree units, Negative = south 32 Longitude millionths of a degree units, Negative = west 36 Altitude meters 40 Nominal CPU reference clock 96,000,000 44 Nominal RF mixer clock 10,125,000 48 Nominal sample clockrate 13,500,000 52 Output sample rate divider (from 24,576 (i.e., 384 × 64) ADC divider and sample clockrate) decimation rate 56 1-pps capture values The last eight capture timer values newest to oldest
88 Divided RF mixer/sample clocks capture values The last eight capture timer values newest to oldest
120 QRSS-Rx unique name 10 ASCII characters
Command Message—sent from the server to the QRSS-RX in response to a poll message Offset Name Details 0 Command message ID 11 4 Message protocol version 1 8 Command code 0 = stop, 1 = start 12 DSP Oscillator rate Numerically controlled oscillator (NCO) phase increment value 16 – 19 Test oscillator state 0 = off, 1 = on
Data Message—sent from the QRSS-RX to the receiver when it is running (started) Offset Name Details 0 Data message ID 12 4 Timestamp CPU timer value at first sample 8 – 519 Data – 64 samples 32-bit Q data followed by 32-bit I data, signed (two’s compliment), little endian Table 1—The three messages are used. All fields are 32-bit words sent in network byte order (high byte first). Note the use of a Version field to enable the message protocol to be adapted but for the server to still easily identify the message type.
pin header. The connection to this is made with a length of ribbon cable and a header plug. The ribbon cable wires are split, stripped, and connected to PCB islands which are then connected to the signals required. A GPS antenna connects directly to the GPS module.
The Ethernet connection (which includes the Ethernet magnetics) is secured to the PCB by soldering it down upside down. Its pins are then direct wired to the mbed. A USB connector is also added to the PCB and connected to only five volts. It is there to power an Ethernet-to-Wi-Fi adapter that was used during testing (see Figure 2).
COMMUNICATIONS
QRSS-Rx-to-server communications use UDP datagrams. A very simple custom message protocol was developed.
The QRSS-Rx is hard coded with the server DNS name. A DNS lookup is used to translate from the server name to its IP address. Every 6 s the QRSS-Rx sends a “poll” message to the server. This message identifies the QRSS-Rx device and passes GPS data, captured timing registers (for the calibration of the CPU and LO clocks), and some information about the QRSS-Rx hardware. This additional information is included, ready for when there are other designs of QRSS-Rx devices operating on different frequency bands.
The server may then command the QRSS-Rx to start receiving. In this command, it also includes the configuration for the DSP oscillator, as calculated using the calibration information from the QRSS-Rx. The command also includes an option to enable or disable the test oscillator.
Once commanded to start, the QRSS-Rx sends processed sample data packets. Each packet contains 64 samples and a timestamp. The timestamp is the CPU timer value at the first sample of the packet. Since this timer is the same as is used for the calibration data, it enables the server to precisely synchronize the samples to real time (see Table 1).
THE SOFTWARE
The software is written in C++. Extensive use is made of the libraries from the mbed online compiler. The mbed library provides access to the basic ports (serial ports, digital IO) and runs software timers. The NetServices library handles the Ethernet and UDP communications. A DNSResolver library is used for DNS lookup, to determine where to send the poll message to.
A set of buffer classes was developed to handle the data samples. Each sample consists of a pair of ADC values—the I value and the Q value. The buffer system defines a sample-set February 2012 – Issue 259
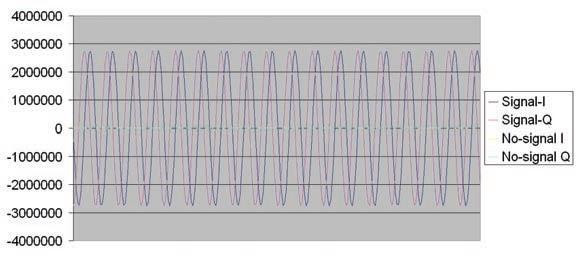
oscillator is a numerically controlled oscillator (NCO), which, with each sample, adds a phase value (this determines the NCO frequency) into a phase accumulator. The accumulator is then used to look up a table and obtain a cosine and sine value. This value pair is treated as a complex number, and is multiplied (as a complex multiply operation) with the data sample. This has the effect of frequency shifting the samples. The server sets the frequency of the NCO so that the band of interest is shifted close to zero Figure 3—Graphed sample data received by the server showing samples with the test oscillator enabled and disabled frequency. The filter function performs a low-pass filter (LPF) and decimator (reduction in samples) operation. A FIR filter is used. The filter is applied to buffer class to hold a set of sample data. It has a buffer-han- the I and the Q data separately. It sums up 511 scaled dler class, which can “hold” a sample-set buffer object. samples (each one scaled based on the filter coefficients) Also implemented is a buffer-queue class that can be used to produce one output. As the samples are then decimatto queue up sets of sample data. Finally, a buffer-pool class ed 1:64, this operation only needs to be performed on is defined. This is a queue for unused buffers—new buffers every 64 samples—that sample being the result of 511 are created from a pool. When a buffer is done with, it is other samples. The coefficients for this filter were automatically returned to the pool. obtained from an online calculator.[1] The DSP class out-
The buffer system is set up for a sample-set size of 512 put is an array of eight sample sets for each data buffer samples. Since each sample is 8 bytes (two 32-bit words) processed. This size is derived from the buffer size—512 each buffer is 4-KB long. There is only room for four buffers samples with 64:1 decimation, giving eight output samin the system, but this seems to be enough and can cope ples. The DSP class maintains the interim FIR filter with the various delays in the system processing. totals between one sample set and the next.
The ADC interface uses an I2S interface which is sup- A C “main” routine pulls all the classes together. It runs ported by the mbed hardware. An I2S driver needed to be the main processing loop which handles the transfer of written—the I2SReceiver class. It uses DMA transfers to data between the ADC receiver, through the DSP processread I2S data into a sample-set buffer object. As each ing, and to the communications module. It also handles buffer is filled, the DMA interrupt occurs. The buffer is the debug console (the serial port), accepting keystrokes then queued and a new one is obtained from the pool for and executing the appropriate test routine. more data.
A GPS controller class handles the data TESTING from the GPS serial port, and performs This article is about the QRSS-Rx the 1-pps capture operation. The serial device, and not about the server it condata from the GPS hardware is parsed to nects to. However, for testing purposes, a extract the GPS status, number of satel- server was required. A simple implementalites, position (latitude, longitude, and tion of the server was developed in C in a altitude), and time. “cygwin” environment. Initial testing
The communications class handles all involved the server simply receiving and communication over the Ethernet. It man- outputting sample data that could then be ages the Ethernet initialization and the captured and processed separately. The sending of the UDP poll messages to the results in Figure 3 show a graph of capnamed server. It accepts commands from tured data with the test oscillator operatthis server, along with parameters, to start ing which was then graphed in Excel. and stop the receiver. When started, it For further testing, the wfft library was handles the transfer of sample sets to the included in the server application to perserver. form the FFT processing to generate fre-
Sample processing is performed by the quency data from the received samples. The DSP class. This class is inherited from the resulting data was then used to build up a buffer-handler class. It adds two functions bitmap image that could then be displayed to the handler to perform DSP operations (see Photo 3). on the sample-set buffer held—a mixer function and a filter function. Photo 3—A server-generated NEXT STEPS
The mixer function is to mix a soft- spectrum image of an incoming The mbed environment proved to be ware oscillator with the samples. The signal an excellent platform for this project,

LabWorX: Straight from the Lab to your Brain Mastering the I²C Bus
Mastering the I²C Bus is the fi rst book in the LabWorX collection. It takes you on an exploratory journey of the I²C Bus and its applications. Besides the Bus protocol plenty of attention is given to the practical applications and designing a solid system. The most common I²C compatible chip classes are covered in detail. Two experimentation boards are available that allow for rapid prototype development. These are completed by a USB to I²C probe and a software framework to control I²C devices from your computer.
248 pages • ISBN 978-0-905705-98-9 • $47.60
Bestseller!
Creative solutions for all areas of electronics 311 Circuits
This book contains circuits, design ideas, tips and tricks from all areas of electronics: audio & video, computers & microcontrollers, radio, hobby & modelling, home & garden, power supplies & batteries, test & measurement, software, not forgetting a section ‘miscellaneous’ for everything that doesn’t fit in one of the other categories. 311 Circuits offers many complete solutions as well as useful starting points for your own projects. Both categories and anything in between represent a veritable fountain of inspiration for cultivating your own ideas and learning about electronics.
420 pages • ISBN 978-1-907920-08-0 • $47.60
Talk with your computer Design your own PC Voice Control System
This book guides you through prac tical speech recognition, speech annunciation and control of really useful peripherals. It details a project which will enable you to instruct your computer using your voice and get it to control electrical devices, tell you the time, check your share values, get the weather forecast, etc. and speak it all back to you in a natural human voice. If you are interested in the practical techno logy of interfacing with machines using voice, then this book is your guide!
216 pages • ISBN 978-1-907920-07-3 • £29.50
Elektor is more than just your favorite electronics magazine. It’s your one-stop shop for Elektor Books, CDs, DVDs, Kits & Modules and much more! www.elektor.com/shop
Elektor US PO Box 180 Vernon, CT 06066 USA Phone: 860-875-2199 Fax: 860-871-0411 E-mail: order@elektor.com
Bestseller!
Improved Radiation Meter
This device can be used with different sensors to measure gamma and alpha radiation. It is particularly suitable for long-term measurements and for examining weakly radioactive samples. The photodiode has a smaller sensitive area than a Geiger-Müller tube and so has a lower background count rate, which in turn means that the radiation from a small sample is easier to detect against the background. A further advantage of a semiconductor sensor is that is offers the possibility of measuring the energy of each particle, allowing a more detailed investigation of the characteristics of a sample. The optional PC-based software displays the energy spectrum, permitting a very detailed analysis to be carried out.
Art.# 110538-71 • $57.30


USB Long-Term Weather Logger
This stand-alone data logger displays pressure, temperature and humidity readings generated by I2C bus sensors on an LCD panel, and can run for six to eight weeks on three AA batteries. The stored readings can be read out over USB and plotted on a PC using gnuplot. Digital sensor modules keep the hardware simple and no calibration is required.
Art.# 100888-73 • $50.20 Kits & Modules
Elektor Shop


The world of electronics at your fi ngertips! Bestseller! Elektor’s Components Database CD ECD 6 This CD-ROM gives you easy access to design data for over 70,000 components! The program package consists of eight databanks covering ICs, transistors, diodes and optocouplers. A further eleven applications cover the calculation of, for example, zener diode series resistors, voltage regulators, voltage dividers and AMV’s. A colour band decoder is included for determining resistor and inductor values. All databank applications are fully interactive, allowing the user to add, edit and complete component data. This CD-ROM is a must-have for all electronics enthusiasts!
ISBN 978-90-5381-258-7 • $40.20
This DVD and more are available at www.elektor.com/shop
CD/DVD-ROMs
Packs 1.2 gigabytes worth of tools and documents DVD Wireless Toolbox
On this DVD-ROM you’ll fi nd a number of technical documents and tools that will enable you to add wireless data exchange to your electronics systems. The choice of equipment depends on the transmission distance: a few centimetres using Near Field Communication (NFC) or Radio Frequency Identifi cation (RFID), tens of metres with the Bluetooth, Wi-Fi or ZigBee systems, or indeed thousands of kilometres using a module for receiving GPS data. In accordance with the principle of our Toolbox series, we’ve brought together technical documentation (spec. sheets, application notes, user guides, etc.) on various devices according to the frequency and/or protocol used. All of the documents are PDF fi les (in English). Browsing around the DVD is made easy by an HTML menu. Finally, this Wireless Toolbox DVD contains a collection of articles on this topic (RFID, xBee, DCF77, GPS, infrared, etc.) that have appeared in Elektor magazine.
Circuits, ideas, tips and tricks from Elektor CD 1001 Circuits
This CD-ROM contains more than 1000 circuits, ideas, tips and tricks from the Summer Circuits issues 2001-2010 of Elektor, supplemented with various other small projects, including all circuit diagrams, descriptions, component lists and full-sized layouts. The articles are grouped alphabetically in nine different sections: audio & video, computer & microcontroller, hobby & modelling, home & garden, high frequency, power supply, robotics, test & measurement and of course a section miscellaneous for everything that didn’t fit in one of the other sections. Texts and component lists may be searched with the search function of Adobe Reader.