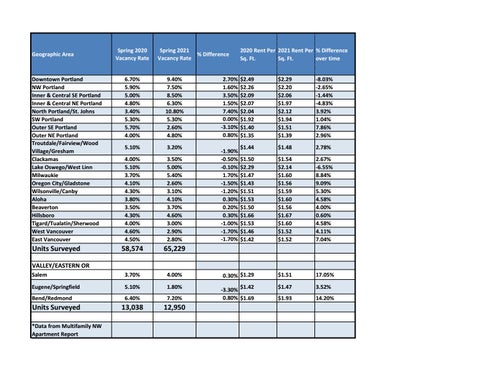
Geographic Area
Downtown Portland NW Portland Inner & Central SE Portland Inner & Central NE Portland North Portland/St. Johns SW Portland Outer SE Portland Outer NE Portland Troutdale/Fairview/Wood Village/Gresham Clackamas Lake Oswego/West Linn Milwaukie Oregon City/Gladstone Wilsonville/Canby Aloha Beaverton Hillsboro Tigard/Tualatin/Sherwood West Vancouver East Vancouver
Units Surveyed
Spring 2020 Vacancy Rate
Spring 2021 % Difference Vacancy Rate
6.70% 5.90% 5.00% 4.80% 3.40% 5.30% 5.70% 4.00%
9.40% 7.50% 8.50% 6.30% 10.80% 5.30% 2.60% 4.80%
5.10%
3.20%
4.00% 5.10% 3.70% 4.10% 4.30% 3.80% 3.50% 4.30% 4.00% 4.60% 4.50%
3.50% 5.00% 5.40% 2.60% 3.10% 4.10% 3.70% 4.60% 3.00% 2.90% 2.80%
2.70% 1.60% 3.50% 1.50% 7.40% 0.00% -3.10% 0.80% -1.90% -0.50% -0.10% 1.70% -1.50% -1.20% 0.30% 0.20% 0.30% -1.00% -1.70% -1.70%
2020 Rent Per 2021 Rent Per % Difference over time Sq. Ft. Sq. Ft. $2.49 $2.26 $2.09 $2.07 $2.04 $1.92 $1.40 $1.35
$2.29 $2.20 $2.06 $1.97 $2.12 $1.94 $1.51 $1.39
-8.03% -2.65% -1.44% -4.83% 3.92% 1.04% 7.86% 2.96%
$1.44
$1.48
2.78%
$1.50 $2.29 $1.47 $1.43 $1.51 $1.53 $1.50 $1.66 $1.53 $1.46 $1.42
$1.54 $2.14 $1.60 $1.56 $1.59 $1.60 $1.56 $1.67 $1.60 $1.52 $1.52
2.67% -6.55% 8.84% 9.09% 5.30% 4.58% 4.00% 0.60% 4.58% 4.11% 7.04%
58,574
65,229
Salem
3.70%
4.00%
0.30% $1.29
$1.51
17.05%
Eugene/Springfield
5.10%
1.80%
$1.47
3.52%
Bend/Redmond
6.40%
7.20%
$1.42 -3.30% 0.80% $1.69
$1.93
14.20%
VALLEY/EASTERN OR
Units Surveyed
*Data from Multifamily NW Apartment Report
13,038
12,950