December 31 (dollars in thousands)
2013
2012
Balance
% of total
2011
Balance
% of total
2010
Balance
% of total
2009
Balance
% of total
Balance
% of total
Real estate loans: 1 Residential 1-4 family
$ 2,006,007
48.2
$ 1,866,450
49.2
$ 1,926,774
52.2
$ 2,087,813
58.9
$ 2,332,763
62.9
Commercial real estate
440,443
10.6
375,677
9.9
331,931
9.0
300,689
8.5
255,716
6.9
Home equity line of credit
739,331
17.8
630,175
16.6
535,481
14.5
416,453
11.7
326,896
8.8
Residential land
16,176
0.4
25,815
0.7
45,392
1.2
65,599
1.8
96,515
2.6
Commercial construction
52,112
1.3
43,988
1.2
41,950
1.1
38,079
1.1
68,174
1.9
Residential construction
12,774
0.3
6,171
0.2
3,327
0.1
5,602
0.2
16,705
0.5
Total real estate loans, net
3,266,843
78.6
2,948,276
77.8
2,884,855
78.1
2,914,235
82.2
3,096,769
83.6
Commercial loans
783,388
18.8
721,349
19.0
716,427
19.4
551,683
15.5
545,622
14.7
Consumer loans
108,722
2.6
121,231
3.2
93,253
2.5
80,138
2.3
64,360
1.7
4,158,953
100.0
3,790,856
100.0
3,694,535
100.0
3,546,056
100.0
3,706,751
100.0
Less: Deferred fees and discounts Allowance for loan losses Total loans, net
(8,724) (40,116) $ 4,110,113
Total loans as a % of assets 1
78.4%
(11,638)
(13,811)
(41,985) $ 3,737,233
(37,906) $ 3,642,818
74.1%
74.2%
(15,530) (40,646) $ 3,489,880 72.8%
(19,494) (41,679) $ 3,645,578 73.8%
Includes renegotiated loans.
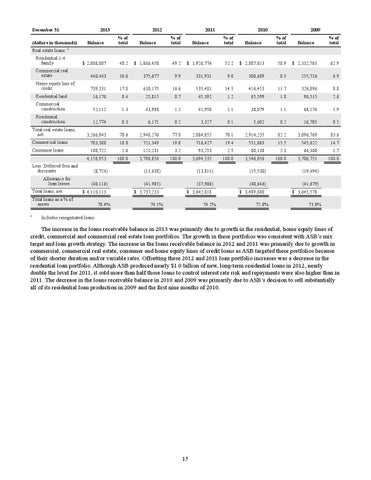
The increase in the loans receivable balance in 2013 was primarily due to growth in the residential, home equity lines of credit, commercial and commercial real estate loan portfolios. The growth in these portfolios was consistent with ASB’s mix target and loan growth strategy. The increase in the loans receivable balance in 2012 and 2011 was primarily due to growth in commercial, commercial real estate, consumer and home equity lines of credit loans as ASB targeted these portfolios because of their shorter duration and/or variable rates. Offsetting these 2012 and 2011 loan portfolio increases was a decrease in the residential loan portfolio. Although ASB produced nearly $1.0 billion of new, long-term residential loans in 2012, nearly double the level for 2011, it sold more than half those loans to control interest rate risk and repayments were also higher than in 2011. The decrease in the loans receivable balance in 2010 and 2009 was primarily due to ASB’s decision to sell substantially all of its residential loan production in 2009 and the first nine months of 2010.
15