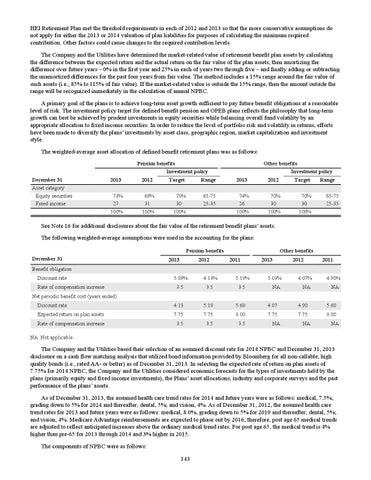
HEI Retirement Plan met the threshold requirements in each of 2012 and 2013 so that the more conservative assumptions do not apply for either the 2013 or 2014 valuation of plan liabilities for purposes of calculating the minimum required contribution. Other factors could cause changes to the required contribution levels. The Company and the Utilities have determined the market-related value of retirement benefit plan assets by calculating the difference between the expected return and the actual return on the fair value of the plan assets, then amortizing the difference over future years – 0% in the first year and 25% in each of years two through five – and finally adding or subtracting the unamortized differences for the past four years from fair value. The method includes a 15% range around the fair value of such assets (i.e., 85% to 115% of fair value). If the market-related value is outside the 15% range, then the amount outside the range will be recognized immediately in the calculation of annual NPBC. A primary goal of the plans is to achieve long-term asset growth sufficient to pay future benefit obligations at a reasonable level of risk. The investment policy target for defined benefit pension and OPEB plans reflects the philosophy that long-term growth can best be achieved by prudent investments in equity securities while balancing overall fund volatility by an appropriate allocation to fixed income securities. In order to reduce the level of portfolio risk and volatility in returns, efforts have been made to diversify the plans’ investments by asset class, geographic region, market capitalization and investment style. The weighted-average asset allocation of defined benefit retirement plans was as follows: Pension benefits Investment policy December 31 Asset category Equity securities Fixed income
2013
2012
73% 27 100%
69% 31 100%
Other benefits Investment policy
Target
Range
2013
2012
Target
70% 30 100%
65-75 25-35
74% 26 100%
70% 30 100%
70% 30 100%
Range 65-75 25-35
See Note 16 for additional disclosures about the fair value of the retirement benefit plans’ assets. The following weighted-average assumptions were used in the accounting for the plans: Pension benefits December 31
2013
2012
Other benefits 2011
2013
2012
2011
Benefit obligation Discount rate
5.09%
4.13%
5.19%
5.03%
4.07%
4.90%
3.5
3.5
3.5
NA
NA
NA
Discount rate
4.13
5.19
5.68
4.07
4.90
5.60
Expected return on plan assets
7.75
7.75
8.00
7.75
7.75
8.00
Rate of compensation increase
3.5
3.5
3.5
Rate of compensation increase Net periodic benefit cost (years ended)
NA
NA
NA
NA Not applicable
The Company and the Utilities based their selection of an assumed discount rate for 2014 NPBC and December 31, 2013 disclosure on a cash flow matching analysis that utilized bond information provided by Bloomberg for all non-callable, high quality bonds (i.e., rated AA- or better) as of December 31, 2013. In selecting the expected rate of return on plan assets of 7.75% for 2014 NPBC, the Company and the Utilities considered economic forecasts for the types of investments held by the plans (primarily equity and fixed income investments), the Plans’ asset allocations, industry and corporate surveys and the past performance of the plans’ assets. As of December 31, 2013, the assumed health care trend rates for 2014 and future years were as follows: medical, 7.5%, grading down to 5% for 2024 and thereafter; dental, 5%; and vision, 4%. As of December 31, 2012, the assumed health care trend rates for 2013 and future years were as follows: medical, 8.0%, grading down to 5% for 2019 and thereafter; dental, 5%; and vision, 4%. Medicare Advantage reimbursements are expected to phase out by 2016; therefore, post age 65 medical trends are adjusted to reflect anticipated increases above the ordinary medical trend rates. For post age 65, the medical trend is 4% higher than pre-65 for 2013 through 2014 and 3% higher in 2015. The components of NPBC were as follows: 143