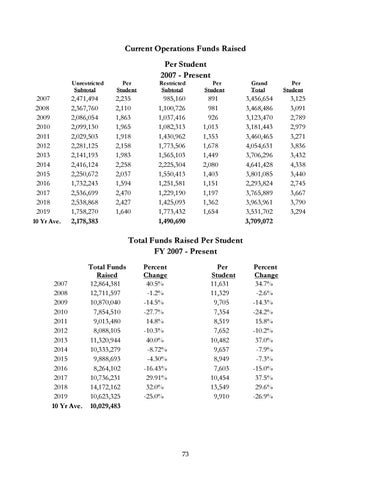
Current Operations Funds Raised
2007 2008 2009 2010 2011 2012 2013 2014 2015 2016 2017 2018 2019 10 Yr Ave.
Per Student 2007 - Present
Unrestricted Subtotal
Per Student
Restricted Subtotal
Per Student
2,471,494 2,367,760 2,086,054 2,099,130 2,029,503 2,281,125 2,141,193 2,416,124 2,250,672 1,732,243 2,536,699 2,538,868 1,758,270 2,178,383
2,235 2,110 1,863 1,965 1,918 2,158 1,983 2,258 2,037 1,594 2,470 2,427 1,640
985,160 1,100,726 1,037,416 1,082,313 1,430,962 1,773,506 1,565,103 2,225,304 1,550,413 1,251,581 1,229,190 1,425,093 1,773,432 1,490,690
891 981 926 1,013 1,353 1,678 1,449 2,080 1,403 1,151 1,197 1,362 1,654
Grand Total
3,456,654 3,468,486 3,123,470 3,181,443 3,460,465 4,054,631 3,706,296 4,641,428 3,801,085 2,293,824 3,765,889 3,963,961 3,531,702 3,709,072
Total Funds Raised Per Student FY 2007 - Present Total Funds Raised 2007 12,864,381 2008 12,711,597 2009 10,870,040 2010 7,854,510 2011 9,013,480 2012 8,088,105 2013 11,320,944 2014 10,333,279 2015 9,888,693 2016 8,264,102 2017 10,736,231 2018 14,172,162 2019 10,623,325 10 Yr Ave. 10,029,483
Percent Change 40.5% -1.2% -14.5% -27.7% 14.8% -10.3% 40.0% -8.72% -4.30% -16.43% 29.91% 32.0% -25.0%
Per Student 11,631 11,329 9,705 7,354 8,519 7,652 10,482 9,657 8,949 7,603 10,454 13,549 9,910
73
Percent Change 34.7% -2.6% -14.3% -24.2% 15.8% -10.2% 37.0% -7.9% -7.3% -15.0% 37.5% 29.6% -26.9%
Per Student
3,125 3,091 2,789 2,979 3,271 3,836 3,432 4,338 3,440 2,745 3,667 3,790 3,294