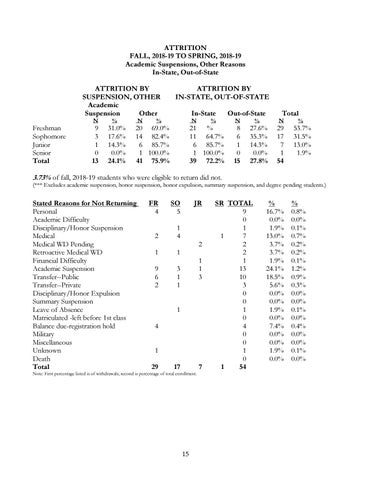
ATTRITION FALL, 2018-19 TO SPRING, 2018-19 Academic Suspensions, Other Reasons In-State, Out-of-State ATTRITION BY SUSPENSION, OTHER Academic Suspension Other Freshman Sophomore Junior Senior Total
N
9 3 1 0 13
%
31.0% 17.6% 14.3% 0.0% 24.1%
N
ATTRITION BY IN-STATE, OUT-OF-STATE In-State
%
N
20 69.0% 14 82.4% 6 85.7% 1 100.0% 41 75.9%
%
21 % 11 64.7% 6 85.7% 1 100.0% 39 72.2%
Out-of-State N
8 6 1 0 15
%
Total
27.6% 35.3% 14.3% 0.0% 27.8%
N
29 17 7 1 54
%
53.7% 31.5% 13.0% 1.9%
3.73% of fall, 2018-19 students who were eligible to return did not.
(*** Excludes academic suspension, honor suspension, honor expulsion, summary suspension, and degree pending students.)
Stated Reasons for Not Returning Personal Academic Difficulty Disciplinary/Honor Suspension Medical Medical WD Pending Retroactive Medical WD Financial Difficulty Academic Suspension Transfer--Public Transfer--Private Disciplinary/Honor Expulsion Summary Suspension Leave of Absence Matriculated -left before 1st class Balance due-registration hold Military Miscellaneous Unknown Death Total
FR 4
SO 5
2
1 4
1
1
9 6 2
3 1 1
JR
2 1 1 3
1 4 1 29
17
7
Note: First percentage listed is of withdrawals; second is percentage of total enrollment.
15
SR TOTAL 9 0 1 1 7 2 2 1 13 10 3 0 0 1 0 4 0 0 1 0 1 54
% 16.7% 0.0% 1.9% 13.0% 3.7% 3.7% 1.9% 24.1% 18.5% 5.6% 0.0% 0.0% 1.9% 0.0% 7.4% 0.0% 0.0% 1.9% 0.0%
% 0.8% 0.0% 0.1% 0.7% 0.2% 0.2% 0.1% 1.2% 0.9% 0.3% 0.0% 0.0% 0.1% 0.0% 0.4% 0.0% 0.0% 0.1% 0.0%