Accreditation
Hampden Sydney is accredited by the Southern Association of Colleges and Schools Commission on Colleges (SACSCOC), which can be reached at 1866 Southern Lane, Decatur, Georgia 30033 4097; 404 679 4500. Hampden Sydney was first accredited by SACSCOC in 1919, and in 2017 our accreditation was reaffirmed through 2027.
The Fact Book supports the following standards of the Southern Association of Colleges and Schools Commission on Colleges, The Principles of Accreditation: Foundations for Quality Enhancement (2017 Edition):
Standard 3.1.c: An institution seeking to gain or maintain accredited status is in operation and has students enrolled in degree programs. (Continuous operation) [CR]
Standard 7.3.: The institution identifies expected outcomes of its administrative support services and demonstrates the extent to which the outcomes are achieved. (Administrative effectiveness)
Standard 8.1: The institution identifies, evaluates, and publishes goals and outcomes for student achievement appropriate to the institution’s mission, the nature of the students it serves, and the kinds of programs offered. The institution uses multiple measures to document student success. (Student achievement) [CR]
Standard 8.2. a and c: The institution identifies expected outcomes, assesses the extent to which it achieves these outcomes, and provides evidence of seeking improvement based on analysis of the results in the areas below:
a. Student learning outcomes for each of its educational programs.(Student outcomes: educational programs)
c. Academic and student services that support student success. (Student outcomes: academic and student services)
Hampden Sydney College is also a member of the Association of Virginia Colleges, the Virginia Foundation for Independent Colleges, the Association of American Colleges, the Southern University Conference, the College Entrance Examination Board, the American Chemical Society, and the College Scholarship Service.
Current and past issues of the Hampden Sydney College Fact Book are available upon request from the Office of Institutional Effectiveness.
HAMPDEN SYDNEY COLLEGE FACT BOOK 2022-23 • • • viii
© 2022 H-SC Office of Institutional Effectiveness, C.M.C. Ross
Academic Section
Fall 2022-23 Course Information by Division
Natural Social MiscelHumanities Sciences Sciences laneous Total
Average Section
Enrollment 11.2 12.8 15.2 8.1 12.4
Number of Courses 97 53 69 14 233
Number of Sections 168 81 91 27 369
Highlights: 25 course sections have one student enrolled (6.8%), which is the second frequent section enrollment.
The most frequent course section enrollment is both 14 students, with 27 course sections respectively.
Student Credit Hours by Division N %
Humanities 5,622 43.2%
Natural Sciences 2,764 21.2%
Social Sciences 4,217 32.4% Miscellaneous 409 3.3%
Total 13,012
The highest number of students enrolled in a course section is 36 (one BUSN section).
Number of Course Sections by Course Level and Enrollment Course Level Enrollment 100 200 300 400 500 Total Percent
1 to 9 18 43 51 30 142 38.5%
10 to 19 79 51 16 7 153 41.5%
20 to 29 54 14 2 70 19.0%
30 to 39 3 1 4 1.1%
40 to 49 0.0%
50+ -- -- 0.0%
Total 154 109 69 37 0 369 Percent 41.7% 29.5% 18.7% 10.0% 0.0%
HAMPDEN SYDNEY COLLEGE FACT BOOK 2022-23 • • • 1
HAMPDEN SYDNEY COLLEGE FACT BOOK 2022-23
Trend Data – Course Information by Division 2014 2015 to 2022 23
2014- 2015- 2016- 2017- 2018- 2019- 2020- 2021- 2022Humanities 2015 2016 2017 2018 2019 2020 2021 2022 2023
Average Section
Enrollment 13.5 12.5 12.3 12.4 12.8 11.1 11.1 11.4 11.2
Number of Courses 94 103 101 107 103 116 102 99 97
Number of Sections 181 196 186 187 190 196 170 161 168
Natural 2014- 2015- 2016- 2017- 2018- 2019- 2020- 2021- 2022Sciences 2015 2016 2017 2018 2019 2020 2021 2022 2023
Average Section
Enrollment 13.8 14.1 12.1 13.8 13.8 14.1 11.7 12.6 12.8
Number of Courses 56 55 57 54 54 53 54 53 53
Number of Sections 100 94 107 89 88 79 83 79 81
Social 2014- 2015- 2016- 2017- 2018- 2019- 2020- 2021- 2022Sciences 2015 2016 2017 2018 2019 2020 2021 2022 2023
Average Section
Enrollment
18.5 16.3 18.2 16.0 16.7 16.8 15.4 14.4 15.2
Number of Courses 64 74 65 75 67 69 63 59 69
Number of Sections 96 112 95 111 103 103 98 94 91
2014- 2015- 2016- 2017- 2018- 2019- 2020- 2021- 2022Overall 2015 2016 2017 2018 2019 2020 2021 2022 2023
Average Section Enrollment 14.8 13.8 13.6 13.6 13.8 13.1 12.2 12.3 12.4
Number of Courses 223 243 236 243 238 249 230 222 233
Number of Sections 391 416 406 402 404 395 374 355 369
• • • 2
Humanities
Natural Sciences
Student Credit Hours by Division
2007 08 2008 09 2009 10 2010 11 N % N % N % N %
7,897 45.9 7,913 45.8 7,154 43.7 7,367 45.2
3,749 21.8 3,696 21.4 3,411 20.8 3,300 20.3
Social Sciences 5,131 29.8 5,256 30.4 5,353 32.7 5,251 32.2
Miscellaneous 414 2.4 419 2.4 463 2.8 365 2.2
OVERALL 17,196 17,284 16,381 16,283
2011 12 2012 13 2013 14 2014 15 N % N % N % N %
Humanities
7,536 46.3 7,237 44.1 7,056 43.1 7,300 42.8%
Natural Sciences 3,472 21.3 3,796 23.1 3,914 23.9 4,024 23.6%
Social Sciences 4,860 29.3 5,020 30.6 5,054 30.8 5,256 30.8%
Miscellaneous 426 2.6 353 2.2 359 2.2 485 2.8%
OVERALL 16,294 16,406 16,383 17,065 2015-16 2016-17 2017-18 2018-19 N % N % N % N %
Humanities
7,316 43.7 6,771 42.6 6,919 43.6 7,215 43.9
Natural Sciences 3,655 21.8 3,572 22.5 3,412 21.5 3,521 21.4
Social Sciences 5,424 32.4 5,111 32.1 5,234 33.0 5,116 31.1 Miscellaneous 357 2.1 452 2.8 319 2.0 577 3.5
OVERALL 16,752 15,910 15,884 16,429
2019 20 2020 21 2021 22 2022 23 N % N % N % N %
Humanities
6,394 42.0 5,642 42.2 5,417 42.8 5,622 43.2
Natural Sciences 3,281 21.6 2,840 21.2 2,906 23.0 2,764 21.2
Social Sciences 5,086 33.4 4,491 33.6 3,911 30.9 4,217 32.4 Miscellaneous 451 3.0 406 3.0 415 3.3 409 3.3
OVERALL 15,211 13,379 12,649 13,012
HAMPDEN SYDNEY COLLEGE FACT BOOK 2022-23 • • • 3
Percent of Course Sections by Level and Enrollment
Enrollment 14 15 15 16 16 17 17 18 18 19 19 20 20 21
1 to 9 26.6 32.2 33.5 32.1 30.2 35.4 36.1
10 to 19 43.2 40.4 41.4 41.3 42.1 40.0 44.9
20 to 29 24.0 23.6 21.4 25.1 24.8 23.8 18.2
30 to 39 6.1 3.6 3.4 1.5 2.7 0.5 0.8
40 to 49 0.0 0.2 0.2 0.0 0.2 0.3 0.0 50+ 0.0 0.0 0.0 0.0 0.0 0.0 0.0
Enrollment 21 22 22 23 23 24 24 25 25 26 26 27 27 28
1 to 9 39.2 38.5
10 to 19 40.0 41.5
20 to 29 19.4 19.0
30 to 39 1.1 1.1
40 to 49 0.3 0.0 50+ 0.0 0.0
Returning Student Mean GPA’s by Class – 2014 15 to Present
14-15 15-16 16-17 17-18 18-19 19-20 20-21
Sophomores 2.64 2.66 2.66 2.75 2.68 2.71 2.63
Juniors 2.79 2.82 2.84 2.83 2.87 2.82 2.82
Seniors 2.89 2.97 2.96 2.94 2.99 3.00 2.96
Overall 2.77 2.81 2.82 2.85 2.85 2.84 2.83
21 22 22 23 23 24 24 25 25 26 26 27 27 28
Sophomores 2.90 2.59
Juniors 2.89 2.90
Seniors 3.02 3.07
Overall 2.95 2.84
HAMPDEN SYDNEY COLLEGE FACT BOOK 2022-23 • • • 4
Affairs
23 Students by Major
Declared % Total
Majors Students
0.82%
0.94%
4.47%
0.94%
1.06%
8.47% 3.64%
24.32% 10.46%
3.28% 1.41%
3.55% 1.53%
6.56% 2.82%
0.27% 0.12%
0.27% 0.12%
10.25% 4.82%
0.00%
0.00%
13.11% 5.64%
0.00%
0.00%
2.46% 1.06%
0.82% 0.35%
1.29%
0.82% 0.35%
6.28% 2.70%
0.71%
0.82%
0.47%
0.94%
with Declared
HAMPDEN SYDNEY COLLEGE FACT BOOK 2022-23 • • • 5 2022
%
N*
Applied Mathematics .................................. 7 1.91%
Biochemistry & Molecular Biology ................................ 8 2.19%
Biology............................................... 38 10.38%
Chemistry ...................................................... 8 2.19%
Classical Studies ........................................... 0 0.00% 0.00% Computer Science........................................ 9 2.46%
Economics 31
Economics and Business.................. 89
Engineering Physics 12
English 13
Foreign
24
French 1
German 1
Government 41
Greek 0 0.00%
Greek & Latin 0 0.00%
History............................................... 48
Interdisciplinary Studies.............................. 0 0.00%
Latin ............................................................... 0 0.00%
Mathematical Economics ........................... 9
Mathematics ................................................. 3
Philosophy .................................................. 11 3.01%
Physics ........................................................... 3
Psychology .................................................. 23
Religion ......................................................... 6 1.64%
Spanish .......................................................... 7 1.91%
Theatre .......................................................... 4 1.09%
Visual Arts .................................................... 8 2.19%
Students
Majors 366 43.01% Total Declared Majors 402 Undeclared 485 .................... 56.99% Total 851 * Based on total majors listed for enrolled students (major 1, major 2, and major 3). Top major is in BOLD.
2022 23 Students with Minors
% N Students
0.00% Astronomy
Asian Studies
0.35% Biology
0.47% Chemistry
1.06% Classical Studies
0.24% Computer Science
0.12% Creative Writing
0.35% Environmental Studies
1.18% French
0.24% German
0.47% Greek
0.00% History
1.53% Latin
0.24% Latin American Studies
0.00% Law and Public Policy
0.82%
13 1.53% Military Leadership & Nat’l Sec.
0.00% National Security
30 3.53% Music
12 1.41% Leadership in the Public Interest
11 1.29% Neuroscience
0.59% Race & Ethnicity Studies
0.12% Religion
1.29% Rhetoric 23 2.70% Spanish
0.47% Theatre
0.24% Visual Arts
Students w/ Declared Minor(s)
Declared Minors
0.12%
HAMPDEN SYDNEY COLLEGE FACT BOOK 2022-23 • • • 6
................................................ 0
3
4
9
2
1
3
10
2
......................................................... 4
0
......................................................... 13
............................................................... 2
............................... 0
................................. 7
Math.............................................................
.......0
..............................
...........................................................
............
................................................ 5
............................ 1
....................................................... 11
4
2
1
...... 149 17.5% Total
.................... 173 * Based on total minors listed for enrolled students (minor 1, minor 2, and minor 3). Top minor is in BOLD.
Admissions Section
Admissions Trend Data 2011 - Present 2011 2012 2013 2014 2015 2016 2017 2018 2019
Applications Received 2,484 2,630 2,623 3,639 3,683 3,403 3,573 3,239 3,056
Applications Accepted 1,361 1,463 1,439 1,720 2,018 1,892 1,967 1,912 1,755
Acceptance Rate 54.8% 55.6% 54.9% 47.3% 54.8% 55.6% 55.6% 59.0% 57.4%
New Freshmen 320 342 292 322 305 283 312 343 228
Virginia Freshmen 213 244 217 214 208 192 224 251 158
Out of State Freshmen 107 98 75 108 97 95 88 92 70
Mean SAT Verbal 550 558 555 554 563 560 587 584 582
Mean SAT Math 558 559 562 555 553 564 571 571 573
Mean SAT Writing 523 521 524 513 526 522
Mean SAT Composite 1108 1117 1117 1109 1116 1124 1158 1155 1155
High School GPA 3.35 3.4 3.4 3.4 3.4 3.56 3.44 3.45 3.45
Transfers 23 19 16 21 15 11 14 11 8
OMRs 12 17 23 12 13 9 18 14 12
2020 2021 2022 2023 2024 2025 2026 2027 2028
Applications Received 1,989 2,911 3.265 Applications Accepted 896 1,070 1,298 Acceptance Rate 45.0% 36.8% 39.8%
New Freshmen 219 222 280
Virginia Freshmen 159 138 172
Out of State Freshmen 60 84 108
Mean SAT Verbal 570 580 600
Mean SAT Math 560 570 560
Mean SAT Composite 1140 1165 1170
High School GPA 3.48 3.54 3.52
Transfers 9 13 7
OMRs 15 9 18
Early decision Applied 67 46 Admit 35 35
Early Action Applied 1,468 1,745 Admit 825 955
HAMPDEN SYDNEY COLLEGE FACT BOOK 2022-23 • • • 7
Attrition Section
Fall 2021 to Fall 2022 by Class, Reason, In/Out-of-State
Attrition by
Attrition by Suspension, Other In-state, Out-of-state Academic Suspension Other In State Out of State Total N % N % N % N % N %
Freshman 12 27.9% 31 72.1% 30 69.8% 13 30.2% 43 41.3%
Sophomore 7 23.3% 23 76.7% 26 86.7% 4 13.3% 30 28.8%
Junior 3 15.8% 16 84.2% 13 68.4% 6 31.6% 19 18.3%
Senior 0 0.0% 12 100.0% 10 83.3% 2 16.7% 12 11.5%
Total 22 21.2% 82 78.8% 79 76.0% 25 24.0% 104
9.28 % of fall, 2020 21 students who were eligible to return did not.
Stated Reasons for Not Returning
FR SO JR SR TOTAL % %
Academic Difficulty 2 1 3 2.9% 0.4%
Academic Suspension 12 7 3 0 22 21.2% 2.6% Death 0 0.0% 0.0% Degree Pending/walked work inc 3 10 13 12.5% 1.5%
Disciplinary/Honor Expulsion 0 0.0% 0.0% Disciplinary/Honor Suspension 2 2 1.9% 0.2%
Financial Difficulty/Registration hold 1 1 1 1 4 3.8% 0.5% Leave of Absence 2 2 1.9% 0.2%
Matriculated left before 1st class 0 0.0% 0.0%
Medical 7 6 3 1 17 16.3% 2.0%
Military 1 1 1.0% 0.1% Miscellaneous 0 0.0% 0.0%
Personal 9 7 4 20 19.2% 2.4%
Transfer Private 0 0.0% 0.0%
Transfer Public 11 8 1 20 19.2% 2.4% Unknown 0 0.0% 0.0%
Total 43 30 19 12 104
Note: First percentage listed is of withdrawals; second is percentage of total enrollment.
HAMPDEN SYDNEY COLLEGE FACT BOOK 2022-23 • • • 8
Spring 2021-22 to Fall 2022 by Class, Reason, In/Out-of-State
Attrition by
Attrition by Suspension, Other In state, Out of state Academic Suspension Other
In State Out of State Total N % N % N % N % N %
Freshman 6 24.0% 19 76.0% 19 76.0% 6 24.0% 25 41.0%
Sophomore 4 25.0% 12 75.0% 12 75.0% 4 25.0% 16 26.2%
Junior 1 10.0% 9 90.0% 6 60.0% 4 40.0% 10 16.4%
Senior 0.0% 10 0.0% 8 0.0% 2 0.0% 10 16.4%
Total 11 18.0% 50 82.0% 45 73.8% 16 26.2% 61 5.69 % of spring, 2020-21 students who were eligible to return did not.
Stated Reasons for Not Returning FR SO JR SR TOTAL % %
Academic Difficulty 2 2 3.3% 0.2%
Academic Suspension 6 4 1 0 11 18.0% 1.4% Death 0 0.0% 0.0%
Degree Pending/walked work inc 2 8 10 16.4% 1.2%
Disciplinary/Honor Expulsion 0 0.0% 0.0% Disciplinary/Honor Suspension 2 1 3 4.9% 0.4%
Financial Difficulty/Registration hold 0 0.0% 0.0% Leave of Absence 2 2 3.3% 0.2% Matriculated left before 1st class 0 0.0% 0.0% Medical 4 3 1 1 9 14.8% 1.1%
Military 1 1 1.6% 0.1% Miscellaneous 0 0.0% 0.0% Personal 7 4 1 12 19.7% 1.5% Transfer Private 0 0.0% 0.0%
Transfer Public 5 5 1 11 18.0% 1.4% Unknown 0 0.0% 0.0%
Total 25 16 10 10 61
Note: First percentage listed is of withdrawals; second is percentage of total enrollment.
HAMPDEN SYDNEY COLLEGE FACT BOOK 2022-23 • • • 9
Unduplicated Headcount 2021-22 by Class, Reason, In/Out-of-State
Attrition by Attrition by Suspension, Other In-state, Out-of-state Academic Suspension Other In-State Out-of-State Total
N % N % N % N % N %
Freshman 12 27.9% 31 72.1% 30 69.8% 13 30.2% 43 41.3%
Sophomore 8 25.8% 23 74.2% 26 83.9% 5 16.1% 31 29.8%
Junior 3 16.7% 15 83.3% 12 66.7% 6 33.3% 18 17.3%
Senior 0.0% 12 100.0% 9 75.0% 3 25.0% 12 11.5%
Total 23 22.1% 81 77.9% 77 74.0% 27 26.0% 104
8.81 % of 2021-22 students who were eligible to return did not.
Stated Reasons For Not Returning FR SO JR SR TOTAL % %
Academic Difficulty 2 1 3 2.9% 0.3%
Academic Suspension 12 8 3 0 23 22.1% 2.6%
Death 0 0.0% 0.0%
Degree Pending/walked work inc 2 8 10 9.6% 1.1% Disciplinary/Honor Expulsion 0 0.0% 0.0% Disciplinary/Honor Suspension 2 1 3 2.9% 0.3%
Financial Difficulty/Registration hold 1 1 1 1 4 3.8% 0.5%
Leave of Absence 2 2 1.9% 0.2% Matriculated left before 1st class 0 0.0% 0.0%
Medical 7 6 3 2 18 17.3% 2.1%
Military 1 1 1.0% 0.1%
Miscellaneous 0 0.0% 0.0%
Personal 9 7 4 20 19.2% 2.3%
Transfer Private 0 0.0% 0.0%
Transfer Public 11 8 1 20 19.2% 2.3%
Unknown 0 0.0% 0.0%
Total 43 31 18 12 104 11.9%
Note: First percentage listed is of withdrawals; second is percentage of total enrollment.
HAMPDEN SYDNEY COLLEGE FACT BOOK 2022-23 • • • 10
Attrition Trends
Fall to Fall Attrition Trends, 2008-2022 (Percent of Eligible Students Who Did Not Return)
Fall to Fall
% Change
Fall, 2008 to Fall, 2009 12.6 0.2 Fall, 2009 to Fall, 2010 10.2 -2.4 Fall, 2010 to Fall, 2011 7.6 -2.6 Fall, 2011 to Fall, 2012 8.2 0.6 Fall, 2012 to Fall, 2013 7.8 -0.4 Fall, 2013 to Fall, 2014 6.5 -1.3 Fall, 2014 to Fall, 2015 8.1 1.6 Fall, 2015 to Fall,2016 9.6 1.5 Fall, 2016 to Fall, 2017 8.3 -1.3 Fall, 2017 to Fall, 2018 6.6 -1.7 Fall, 2018 to Fall, 2019 9.9 3.3 Fall, 2019 to Fall, 2020 11.2 1.3 Fall, 2020 to Fall, 2021 7.8 -3.4 Fall, 2021 to Fall, 2022 9.3 1.5
Spring to Fall Attrition Trends 2008-2022 (Percent of Eligible Students Who Did Not Return)
Spring to Fall % Change
Spring, 2008 to Fall, 2008 7.8 -1.2 Spring, 2009 to Fall, 2009 8.6 0.8 Spring, 2010 to Fall, 2010 7.4 -1.2 Spring, 2011 to Fall, 2011 4.9 -2.5 Spring, 2012 to Fall, 2012 5.2 0.3 Spring, 2013 to Fall, 2013 5.9 0.7 Spring, 2014 to Fall, 2014 3.8 -2.1 Spring, 2015 to Fall, 2015 5.4 1.6 Spring, 2016 to Fall, 2016 6.2 0.8 Spring, 2017 to Fall, 2017 6.5 0.3 Spring, 2018 to Fall, 2018 5.0 -1.5 Spring, 2019 to Fall, 2019 7.0 2.0 Spring, 2020 to Fall, 2020 7.7 0.7 Spring, 2021 to Fall, 2021 5.0 -2.7 Spring, 2022 to Fall, 2022 5.7 0.7
HAMPDEN SYDNEY COLLEGE FACT BOOK 2022-23 • • • 11
HAMPDEN SYDNEY COLLEGE FACT BOOK 2022-23
Unduplicated Headcount Attrition Trends, 2009-2022 (Percent of Eligible Students Who Did Not Return)
Total Year
% Change
2009 10 to Fall, 2010 10.1 -2.6
2010 11 to Fall, 2011 7.6 -2.5
2011 12 to Fall, 2012 8.2 0.6
2012 13 to Fall, 2013 8.0 -0.2
2013 14 to Fall, 2014 6.7 -1.3
2014 15 to Fall, 2015 7.9 1.2
2015 16 to Fall, 2016 9.7 1.8
2016 17 to Fall, 2017 8.7 -1.0
2017-18 to Fall, 2018 6.9 -1.8
2018 19 to Fall, 2019 10.1 3.2
2019 20 to Fall, 2020 11.3 1.2
2020 21 to Fall, 2021 7.7 -3.6
2021 22 to Fall, 2022 8.8 1.1
• • • 12
BOOK 2022-23
Attrition Trends – Percentage of Total Year Withdrawals by Reason 2012-13 to Present
Academic Difficulty
2012 13 2013 14 2014 15 2015 16 2016 17
2.3 0.9 2.3 3.6 0.8
Academic Suspension 27.1 31.0 24.1 13.9 14.0
Death 0.0 0.0 1.5 0.0 0.8
Degree pending/Walked Work Inc
Disciplinary/Honor Expulsion
3.0 2.7 1.5 1.5 3.3
Disciplinary/Honor Suspension 5.3 1.8 4.5 4.4 6.6
Financial Difficulty 8.3 3.5 8.3 7.3 4.1
Leave of Absence 0.8 0.9 1.5 2.9 0.8
Matriculated - left before 1st class 0.0 0.0 0.8 0.0 0.0
Medical 9.0 13.3 12.0 14.6 16.5
Military 0.0 0.0 0.8 1.5 0.0
Miscellaneous 0.0 0.0 3.8 0.0 0.8
Personal Reasons 14.3 14.2 13.5 26.3 9.1
Transfer Private College 1.5 0.9 3.0 1.5 0.8
Transfer Public College 28.6 31.0 22.6 20.4 26.4
Unknown 0.0 0.0 0.0 2.2 15.7
Total 12.3 10.3 11.8 12.3 11.5
NOTE: Total is percent of students enrolled who did not return.
2017-18 2018-19 2019-20 2020-21 2021-22
Academic Difficulty 0.0 0.0 0.0 0.0 2.9
Academic Suspension 19.8 20.5 14.3 15.6 22.1 COVID leave 1 or 2 semesters 12.1 2.2
Death 0.0 0.7 0.0 1.1 0.0
Degree pending/Walked Work Inc 6.0 4.1 0.0 8.9 9.6
Disciplinary/Honor Expulsion 2.0 0.0 0.0 0.0 0.0 Disciplinary/Honor Suspension 4.0 4.1 5.0 5.6 2.9
Financial Difficulty 4.0 8.9 7.9 8.9 3.8
Leave of Absence 0.0 0.0 0.7 0.0 1.9
Matriculated - left before 1st class 0.0 0.0 0.0 0.0 0.0
Medical 13.9 12.3 10.0 11.1 17.3
Military 2.0 1.4 0.0 0.0 1.0
Miscellaneous 0.0 0.0 0.0 0.0 0.0
Personal Reasons 24.8 17.1 13.6 15.6 19.2
Transfer Private College 2.0 3.4 0.7 2.2 0.0
Transfer Public College 18.8 19.9 19.3 22.2 19.2
Unknown 3.0 3.4 13.6 6.7 0.0
Total 9.5 13.7 14.0 9.9 11.9
NOTE: Total is percent of students enrolled who did not return
HAMPDEN SYDNEY COLLEGE FACT
• • • 13
Cohort Attrition
Class Entering Fall 2016 (Entering Class=283)
Cumulative Withdrawals
In- Out of- % All % Reason State % State % Total WDs Class
Withdrawal
Academic Difficulty 1 100.0% 0.0% 1 1.3% 0.4%
Academic Suspension 9 75.0% 3 25.0% 12 16.0% 4.2%
COVID leave 1 or 2 semesters 0 0.0% 0.0%
Death 1 100.0% 0.0% 1 1.3% 0.4%
Work Inc/Degree Pending 0 0.0% 0.0%
Discipl/Honor Expulsion 4 100.0% 0.0% 4 5.3% 1.4%
Discipl/Honor Suspension 1 100.0% 0.0% 1 1.3% 0.4%
Financial Diff/Reg. hold 5 83.3% 1 16.7% 6 8.0% 2.1%
Leave of Absence 1 100.0% 0.0% 1 1.3% 0.4%
Matriculated left before 1st class 0 0.0% 0.0%
Medical 4 44.4% 5 55.6% 9 12.0% 3.2%
Military 1 100.0% 0.0% 1 1.3% 0.4%
Miscellaneous 0 0.0% 0.0%
Personal 3 42.9% 4 57.1% 7 9.3% 2.5%
Transfer Private 0 0.0% 0.0%
Transfer Public 17 77.3% 5 22.7% 22 29.3% 7.8%
Unknown 8 80.0% 2 20.0% 10 13.3% 3.5%
Total 55 73.3% 20 26.7% 75 26.5%
Retention 208 74.0%*
*Percentage retention rate does not include students that left due to military and/or death.
NOTE: The first two percentages are of total withdrawals for that withdrawal reason in a class. WD is an abbreviation for withdrawals.
Retention Rates:
First Year 84.0*
Second Year 77.2*
Third Year 73.7*
Fourth Year 70.5*
Fifth Year 74.0*
HAMPDEN SYDNEY COLLEGE FACT BOOK 2022-23 • • • 14
Cumulative Withdrawals
In- Out of- % All % Reason State % State % Total WDs Class
Withdrawal
Academic Difficulty 0 0.0% 0.0%
Academic Suspension 18 81.8% 4 18.2% 22 19.1% 7.1%
Death 0.0% 1 100.0% 1 0.9% 0.3%
Work Inc/Degree Pending 6 60.0% 4 40.0% 10 8.7% 3.2%
Discipl/Honor Expulsion 0 0.0% 0.0%
Discipl/Honor Suspension 5 71.4% 2 28.6% 7 6.1% 2.2%
Financial Diff/Reg. hold 2 40.0% 3 60.0% 5 4.3% 1.6%
Leave of Absence 0 0.0% 0.0%
Matriculated left before 1st class 0 0.0% 0.0%
Medical 13 68.4% 6 31.6% 19 16.5% 6.1%
Military 0 0.0% 0.0%
Miscellaneous 0 0.0% 0.0%
Personal 18 78.3% 5 21.7% 23 20.0% 7.4%
Transfer Private 2 66.7% 1 33.3% 3 2.6% 1.0%
Transfer Public 14 66.7% 7 33.3% 21 18.3% 6.7%
Unknown 3 75.0% 1 25.0% 4 3.5% 1.3%
Total 81 70.4% 34 29.6% 115 36.9%
Retention Rate 197 63.1%
*Percentage retention rate does not include students that left due to military and/or death.
NOTE: The first two percentages are of total withdrawals for that withdrawal reason in a class. WD is an abbreviation for withdrawals.
Retention Rates:
First Year 81.1*
Second Year 71.2*
Third Year 66.7
Fourth Year 64.6*
Fifth Year 65.6*
HAMPDEN SYDNEY COLLEGE FACT BOOK 2022-23 • • • 15 Class Entering Fall 2017 (Entering Class=312)
Class Entering Fall 2018 (Entering Class=343)
Cumulative Withdrawals
Withdrawal In- Out of- % All % Reason State % State % Total WDs Class
Academic Difficulty 0 0.0% 0.0%
Academic Suspension 21 77.8% 6 22.2% 27 19.6% 7.9%
COVID leave 1 or 2 sem. 3 100.0% 0.0% 3 2.2% 0.9%
Death 0 0.0% 0.0%
Work Inc/Degree Pending 7 87.5% 1 12.5% 8 5.8% 2.3%
Discipl/Honor Expulsion 0 0.0% 0.0%
Discipl/Honor Suspension 3 100.0% 0.0% 3 2.2% 0.9%
Financial Diff/Reg. hold 11 84.6% 2 15.4% 13 9.4% 3.8%
Leave of Absence 0.0% 2 100.0% 2 1.4% 0.6%
Matriculated left before 1st class 0 0.0% 0.0%
Medical 12 75.0% 4 25.0% 16 11.6% 4.7%
Military 2 100.0% 0.0% 2 1.4% 0.6%
Miscellaneous 0 0.0% 0.0%
Personal 16 72.7% 6 27.3% 22 15.9% 6.4%
Transfer Private 3 75.0% 1 25.0% 4 2.9% 1.2%
Transfer Public 17 56.7% 13 43.3% 30 21.7% 8.7%
Unknown 5 62.5% 3 37.5% 8 5.8% 2.3% Total 100 72.5% 38 27.5% 138 40.2%
Retention Rate* 205 60.1%
*Percentage retention rate does not include students that left due to military and/or death.
NOTE: The first two percentages are of total withdrawals for that withdrawal reason in a class. WD is an abbreviation for withdrawals.
Retention Rates:
First Year 79.2*
Second Year 66.6*
Third Year 64.2*
Fourth Year 60.1*
Fifth Year
HAMPDEN SYDNEY COLLEGE FACT BOOK 2022-23 • • • 16
Class Entering Fall 2019
(Entering Class=228)
Cumulative Withdrawals
Withdrawal In- Out of- % All % Reason State % State % Total WDs Class
Academic Difficulty 1 100.0% 0.0% 1 1.3% 0.4%
Academic Suspension 9 75.0% 3 25.0% 12 15.0% 5.3%
COVID leave 1 or 2 sem. 2 50.0% 2 50.0% 4 5.0% 1.8%
Death 0 0.0% 0.0%
Work Inc/Degree Pending 0 0.0% 0.0%
Discipl/Honor Expulsion 0 0.0% 0.0%
Discipl/Honor Suspension 5 71.4% 2 28.6% 7 8.8% 3.1%
Financial Diff/Reg. hold 7 87.5% 1 12.5% 8 10.0% 3.5%
Leave of Absence 0 0.0% 0.0%
Matriculated left before 1st class 0 0.0% 0.0%
Medical 5 71.4% 2 28.6% 7 8.8% 3.1%
Military 0 0.0% 0.0% Miscellaneous 0 0.0% 0.0%
Personal 9 69.2% 4 30.8% 13 16.3% 5.7%
Transfer Private 0.0% 1 100.0% 1 1.3% 0.4%
Transfer Public 11 61.1% 7 38.9% 18 22.5% 7.9%
Unknown 6 66.7% 3 33.3% 9 11.3% 3.9% Total 55 68.8% 25 31.3% 80 35.1%
Retention Rate 148 64.9%
NOTE: The first two percentages are of total withdrawals for that withdrawal reason in a class. WD is an abbreviation for withdrawals.
Retention Rates:
First Year 78.5
Second Year 68.9
Third Year 64.9
Fourth Year Fifth Year
Comparison –
The most recent national retention rate (entry cohort 2019), incl. male & female students: Private non-profit – 81% All institutions – 82% HSC 78.5%
HAMPDEN SYDNEY COLLEGE FACT BOOK 2022-23 • • • 17
Class Entering Fall 2020 (Entering Class=219)
Cumulative Withdrawals
Withdrawal In- Out of- % All % Reason State % State % Total WDs Class
Academic Difficulty 0 0.0% 0.0%
Academic Suspension 6 85.7% 1 14.3% 7 16.7% 3.2%
COVID leave 1 or 2 sem. 0 0.0% 0.0%
Death 0 0.0% 0.0% Work Inc/Degree Pending 0 0.0% 0.0%
Discipl/Honor Expulsion 0 0.0% 0.0%
Discipl/Honor Suspension 0 0.0% 0.0%
Financial Diff/Reg. hold 1 50.0% 1 50.0% 2 4.8% 0.9%
Leave of Absence 0 0.0% 0.0%
Matriculated left before 1st class 0 0.0% 0.0%
Medical 7 77.8% 2 22.2% 9 21.4% 4.1%
Military 0 0.0% 0.0% Miscellaneous 0 0.0% 0.0%
Personal 5 71.4% 2 28.6% 7 16.7% 3.2%
Transfer Private 1 100.0% 0.0% 1 2.4% 0.5%
Transfer Public 10 66.7% 5 33.3% 15 35.7% 6.8%
Unknown 1 100.0% 0.0% 1 2.4% 0.5% Total 31 73.8% 11 26.2% 42 19.2%
Retention Rate 177 80.8%
NOTE: The first two percentages are of total withdrawals for that withdrawal reason in a class. WD is an abbreviation for withdrawals
Retention Rates:
First Year 90.0
Second Year 80.8
Third Year
Fourth Year
Fifth Year
HAMPDEN SYDNEY COLLEGE FACT BOOK 2022-23 • • • 18
Class Entering Fall 2021 (Entering Class=222)
Cumulative Withdrawals
Withdrawal In- Out of- % All % Reason State % State % Total WDs Class
Academic Difficulty 2 100.0% 0.0% 2 4.7% 0.9%
Academic Suspension 10 83.3% 2 16.7% 12 27.9% 5.4%
COVID leave 1 or 2 sem. 0 0.0% 0.0%
Death 0 0.0% 0.0%
Work Inc/Degree Pending 0 0.0% 0.0%
Discipl/Honor Expulsion 0 0.0% 0.0%
Discipl/Honor Suspension 0 0.0% 0.0%
Financial Diff/Reg. hold 1 100.0% 0.0% 1 2.3% 0.5%
Leave of Absence 0 0.0% 0.0%
Matriculated left before 1st class 0 0.0% 0.0%
Medical 7 100.0% 0.0% 7 16.3% 3.2%
Military 1 100.0% 0.0% 1 2.3% 0.5%
Miscellaneous 0 0.0% 0.0%
Personal 5 55.6% 4 44.4% 9 20.9% 4.1%
Transfer Private 0 0.0% 0.0%
Transfer Public 4 36.4% 7 63.6% 11 25.6% 5.0%
Unknown 0 0.0% 0.0%
Total 30 69.8% 13 30.2% 43 19.4%
Retention Rate* 179 81.0%
*Percentage retention rate does not include students that left due to military and/or death.
NOTE: The first two percentages are of total withdrawals for that withdrawal reason in a class. WD is an abbreviation for withdrawals
Retention Rates:
First Year 90.0
Second Year 81.0*
Third Year
Fourth Year
Fifth Year
HAMPDEN SYDNEY COLLEGE FACT BOOK 2022-23 • • • 19
Class Entering
Cohort Retention Trends
Class entering 2008 to present
(Rate at end of each year)
1st 2nd 3rd 4th 5th
Fall 2008 77.1 71.3* 67.5* 66.6* 67.5*
Fall 2009 78.6* 69.9* 65.4* 64.7* 64.4*
Fall 2010 79.4* 68.8* 66.9* 67.0* 66.3*
Fall 2011 77.5 67.8 64.1 64.1 64.1
Fall 2012 78.4 70.1 66.9* 64.9* 65.8*
Fall 2013 83.5 72.2* 71.1* 69.9* 68.7*
Fall 2014 82.6* 72.9* 71.7* 69.2* 69.5*
Fall 2015 79.8* 68.2* 67.2* 62.9* 62.9*
Fall 2016 84.0* 77.2* 73.7* 70.5* 74.0*
Fall 2017 81.1* 71.2* 66.7 64.6* 65.6*
Fall 2018 79.2* 66.6* 64.2* 59.8*
Fall 2019 78.5 68.9 64.9
Fall 2020 90.0 81.0
Fall 2021 81.0*
*Percentage retention rate does not include students that left due to military and/or death.
(Rate at end of each year compared to previous class) Class Entering 1st 2nd 3rd 4th 5th
Fall 2008 1.6 6.8* 3.4* 4.3* 5.2*
Fall 2009 1.5* -1.4* -2.1* -1.9* -3.1*
Fall 2010 0.8* -1.1* 1.5* 2.3* 1.9*
Fall 2011 1.9 -1.0 -2.8 -2.9* 0.0
Fall 2012 1.1 2.3 2.8* 0.8* 1.7*
Fall 2013 4.9 2.1* 4.2* 5.0* 2.9*
Fall 2014 0.9* 0.7* 0.6* -0.7* 1.0*
Fall 2015 2.9* -4.7* -4.5* -6.3* 6.6*
Fall 2016 4.2* 9.0* 6.7* 7.6* 11.1*
Fall 2017 2.9* -6.0* 6.9 -5.9* 8.4*
Fall 2018 1.9* 4.6* 2.5* 4.8*
Fall 2019 0.7 2.3 -2.5
Fall 2020 11.5 12.3
Fall 2021 9.0*
*Percentage retention rate does not include students that left due to military and/or death.
National comparison - https://nces.ed.gov/programs/coe/indicator_ctr.asp
HAMPDEN SYDNEY COLLEGE FACT BOOK 2022-23 • • • 20
Cohort Attrition Trends-Percentage Withdrawal by Reason-All Entering Classes 2008 to Present
2008 2009 2010 2011 2012 2013 2014
Academic Difficulty
Academic Suspension
2.2 1.4 0.9 0.6 0.3 1.0 0.6
5.4 9.0 7.5 10.0 9.4 6.8 4.0
Death 0.0 0.0 0.9 0.0 0.3 0.3 0.0
Degree pending/work inc 2.4 1.9
Discipl/Honor Expulsion
Discipl/Honor Suspension
0.6 0.3 0.3 0.9 1.8 0.0 1.2
0.6 1.4 0.6 0.9 2.0 1.4 1.2
Financial Difficulty 0.3 1.2 2.0 1.6 3.5 2.1 2.5
Leave of Absence 0.3 0.6 0.0 0.0 0.0 0.3 0.3
Matriculated left before class 0.0 0.7 0.0 0.0 0.0 0.0 0.3
Medical 4.1 3.8 4.1 3.8 3.5 2.4 2.2
Military
0.6 0.9 0.3 0.0 0.0 0.0 1.2
Miscellaneous 0.6 0.3 0.0 0.0 0.0 0.3 0.0
Personal 4.8 3.5 3.8 5.9 4.4 4.8 5.3
Transfer Private 1.0 1.2 0.3 1.3 0.0 0.7 1.2
Transfer Public 12.4 7.8 11.3 10.0 9.4 9.6 8.7
TOTALS 33.1 37.3 34.9 35.6 34.5 32.5 30.7
Retention Rate 67.5 64.4 66.3 64.4 65.8 67.7 69.3 Change 5.2 -3.1 1.9 -1.9 1.7 1.9 1.6
2015 2016 2017 2018 2018 2020 2021
Academic Difficulty 0.3 0.4 0.0
Academic Suspension 3.9 4.2 7.1
Death 0.3 0.4 0.3
Degree pending/work inc 2.5 0.0 3.2 Discipl/Honor Expulsion 0.0 1.4 0.0 Discipl/Honor Suspension 2.0 0.4 2.2
Financial Difficulty 1.6 2.1 1.6
Leave of Absence 0.0 0.4 0.0 Medical 6.2 3.2 6.1
Military 0.7 0.4 0.0
Miscellaneous 0.0 0.0 0.0
Personal 5.9 2.5 7.4
Transfer Private 1.0 0.0 1.0
Transfer Public 10.5 7.8 6.7
Unknown 2.6 3.5 1.3
TOTALS 37.7 26.5 36.9
Retention Rate 62.9 74.0 63.3 Change 4.3 11.1 10.7
HAMPDEN SYDNEY COLLEGE FACT BOOK 2022-23 • • • 21
Graduates as Percent of Entering Class, Four, Five, & Six year Rates
Graduation Entering
Graduated In Graduated In Including Late Four Years Five Years Graduates (6 yr) Year Class Size* N % N % N %
2002 311 185 59.5% 201 64.6%
2003 307 182 59.3% 188 61.2%
2004 297 170 57.2% 191 64.3%
2005 326 182 56.0% 221 68.3%
2006** 300 159 55.0% 186 62.0%
2007 306 Adj. 176 57.5% 204 66.7%
2008 321 Cohort 202 62.9% 218 67.9%
2009** 322 320 190 59.4% 212 66.3%
2010 345 202 58.6% 238 69.0%
2011** 334 333 193 58.0% 207 62.2%
2012** 314 312 189 60.6% 211 67.6%
2013** 295 292 163 55.8% 185 63.4% 185 63.4%
2014** 315 311 182 58.5% 200 64.3% 205 65.9%
2015 320 177 55.3% 198 61.9% 205 64.1%
2016** 342 341 200 58.7% 216 63.3% 223 65.4%
2017** 292 291 177 60.8% 197 67.7% 199 68.4%
2018** 322 321 200 62.3% 224 69.8% 228 71.0%
2019** 305 302 169 56.0% 191 63.2% 195 64.6%
2020** 283 281 179 63.7% 205 73.0% 207 73.7%
2021 312 311 171 55.0% 201 64.6%
2022 343 341 181 53.1%
** Original cohort adjusted for military service and/or death.
Latest Three-Year Average (used by US News)
Percent Graduated In Four Years …………………………….57.3
Percent Including Late Graduates …………………………… 69.8
Latest Five-Year Average
Percent Graduated In Four Years …………………………….58.0
Percent Including Late Graduates …………………………… 68.6
NOTE: Entering class size is only first year, first time freshman. This number DOES NOT include transfer students.
HAMPDEN SYDNEY COLLEGE FACT BOOK 2022-23 • • • 22
Ten-year Averages, Graduates as a Percent of Entering Class, 1996 to Present
Four Year Including Late Ten-Year Period Graduates Graduates 1996 2005 54.7 62.0 1997 2006 55.2 62.3 1998 2007 55.9 61.7 1999 2008 57.3 62.9 2000 2009 58.5 64.1 2001 2010 59.2 64.7 2002 2011 60.4 65.1 2003 2012 60.8 65.8 2004 2013 58.1 66.0
2005 2014 58.2 66.2 2006 2015 58.2 65.7 2007 2016 58.5 66.0 2008 2017 58.9 66.2 2009 2018 58.8 66.4 2010 2019 58.4 66.2 2011 2020 59.0 66.6 2012 2021 58.7 2013 2022 57.9
Five-year Averages, Graduates as a Percent of Entering Class, 2002 to Present
Four Year Including Late Five Year Period Graduates Graduates
2002 2006 58.3 64.7 2003 2007 58.5 63.5
2004 2008 57.7 66.1 2005 2009 58.2 66.7
2006 2010 58.7 66.8 2007 2011 59.3 66.7
2008 2012 59.9 66.9 2009 2013 58.5 65.9
2010 2014 58.3 65.7 2011 2015 57.6 64.7
2012 2016 57.8 65.3
2013 2017 57.8 65.4
2014 2018 59.1 67.0 2015 2019 58.6 66.6
2016 2020 60.3 68.6
2017 2021 59.5
2018 2022 58.0
HAMPDEN SYDNEY COLLEGE FACT BOOK 2022-23 • • • 23
Budget-Finance Section
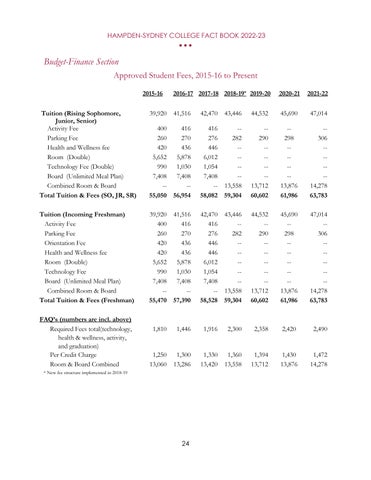
Approved Student Fees, 2015 16 to Present
Tuition (Rising Sophomore, Junior, Senior) 39,920 41,516 42,470 43,446 44,532 45,690 47,014
Activity Fee 400 416 416 Parking Fee 260 270 276 282 290 298 306
Health and Wellness fee 420 436 446 Room (Double) 5,652 5,878 6,012 Technology Fee (Double) 990 1,030 1,054 Board (Unlimited Meal Plan) 7,408 7,408 7,408 Combined Room & Board 13,558 13,712 13,876 14,278
Total Tuition & Fees (SO, JR, SR) 55,050 56,954 58,082 59,304 60,602 61,986 63,783
Tuition (Incoming Freshman) 39,920 41,516 42,470 43,446 44,532 45,690 47,014
Activity Fee 400 416 416 Parking Fee 260 270 276 282 290 298 306 Orientation Fee 420 436 446
Health and Wellness fee 420 436 446 Room (Double) 5,652 5,878 6,012 Technology Fee 990 1,030 1,054 Board (Unlimited Meal Plan) 7,408 7,408 7,408 Combined Room & Board 13,558 13,712 13,876 14,278
Total Tuition & Fees (Freshman) 55,470 57,390 58,528 59,304 60,602 61,986 63,783
FAQ’s (numbers are incl. above)
Required Fees total(technology, health & wellness, activity, and graduation)
1,810 1,446 1,916 2,300 2,358 2,420 2,490
Per Credit Charge 1,250 1,300 1,330 1,360 1,394 1,430 1,472 Room & Board Combined 13,060 13,286 13,420 13,558 13,712 13,876 14,278
New fee structure implemented in 2018 19
HAMPDEN SYDNEY COLLEGE FACT BOOK 2022-23 • • • 24
2015 16 2016 17 2017 18 2018 19* 2019 20 2020 21 2021 22
*
Tuition (Rising Sophomore, Junior, Senior) 48,118 Activity Fee Parking Fee 312
Health and Wellness fee Room (Double) Technology Fee (Double) Board (Unlimited Meal Plan) Combined Room & Board 14,634
Total Tuition & Fees (SO, JR, SR) 65,374
Tuition (Incoming Freshman) 48,118 Activity Fee Parking Fee 312 Orientation Fee Health and Wellness fee Room (Double) Technology Fee Board (Unlimited Meal Plan) Combined Room & Board 14,634
Total Tuition & Fees (Freshman) 65,374
FAQ’s (numbers are incl. above)
Required Fees total(technology, health & wellness, activity, and graduation)
2,552 Per Credit Charge 1,508 Room & Board Combined 14,634
HAMPDEN SYDNEY COLLEGE FACT BOOK 2022-23 • • • 25 2022 23 2023 24 2024 25 2025 26 2026 27 2027 28
Endowment 2007 to Present
As of Total Percent Nat’l Endowment Percent Nat’l June 30 Value (000) Change Rank Per Student Change Rank
2007 142,375 13.1 319 128,730 8.6 123
2008 134,924 -5.2 316 120,253 -6.6 122
2009 115,399 -14.5 319 108,052 -10.1 116
2010 118,254 2.5 314 110,725 2.5 110
2011 131,304 11.0 348 124,106 12.1 111
2012 128,988 -1.8 348 125,597 1.2 100
2013 134,228 4.1 341 125,447 -0.1 116
2014 150,901 12.4 343 141,029 12.4 124
2015 154,643 2.5 359 139,948 -0.8 127
2016 145,388 -6.0 367 133,751 -4.4 132
2017 158,476 9.0 372 154,310 15.4 125
2018 170,688 7.7 368 163,163 5.7 122
2019 177,827 4.2 358 165,883 4.2 124
2020 188,785 6.2 336 190,115 14.6 102
2021 246,893 30.8 330 280,242 47.4 93
2022
HAMPDEN SYDNEY COLLEGE FACT BOOK 2022-23 • • • 26
Enrollment Section
Fall Semester 2022 23 Enrollment In-State Out-of-State Total N % N % N %
Freshmen 172 61.4% 108 38.6% 280 32.9%
Sophomore 130 63.4% 75 36.6% 205 24.1%
Junior 132 73.7% 47 26.3% 179 21.0%
Senior 129 69.0% 58 31.0% 187 22.0%
TOTAL 563 66.2% 288 33.8% 851
Enrollment
junior
In-state, Out-of-state Enrollment Trends
seniors.)
2000 01 2001 02 2002 03 2003 04 2004 05
N % N % N % N % N %
In State 586 60.0 649 63.3 668 64.4 668 64.3 726 67.1
Out-of-State 390 36.7 377 36.7 370 35.6 371 35.7 356 32.9
Total 976 1,026 1,038 1,039 1,082
2005-06 2006-07 2007-08 2008-09 2009-10 N % N % N % N % N %
In State 710 67.0 738 66.7 746 66.5 763 68.1 743 69.6%
Out-of-State 350 33.0 368 33.3 376 33.5 357 31.9 325 30.4%
Total 1,060 1,106 1,122 1,120 1,068
2010 11 2011 12 2012 13 2013 14 2014 15 N % N % N % N % N %
In State 729 68.9 724 68.5 748 69.3 759 70.9 775 70.1
Out-of-State 329 31.1 333 31.5 332 30.7 311 29.1 330 29.9
Total 1,058 1,057 1,080 1,070 1,105
2015 16 2016 17 2017 18 2018 19 2019 20 N % N % N % N % N %
In State 773 71.1 719 70.0 719 68.7 751 70.1 695 70.0
Out-of-State 314 28.9 308 30.0 327 31.3 321 29.9 298 30.0
Total 1,087 1,027 1,046 1,072 993
2020-21 2021-22 2022-23 2023-24 2024-25
N % N % N % N % N %
In State 634 72.0 596 70.0 563 66.2
Out-of-State 247 28.0 255 30.0 288 33.8
Total 881 851 851
HAMPDEN SYDNEY COLLEGE FACT BOOK 2022-23 • • • 27
***
includes 3 female students (1
& 2
*** *** 8 PT males at census date (1 sophomore and 7 seniors) ***
2022 23 Students by Race Freshmen Sophomores Juniors Seniors Total
N
N % N %
Am. Indian/Alaska Native 0 0.0% 0 0.0% 0 0.0% 0 0.0% 0 0.0%
Black 21 7.5% 13 6.3% 19 10.6% 12 6.4% 65 7.6%
Native Hawaiian/Pacific Island 0 0.0% 0 0.0% 0 0.0% 0 0.0% 0 0.0%
Asian 5 1.8% 2 1.0% 2 1.1% 2 1.1% 11 1.3%
Hispanic 20 7.1% 13 6.3% 12 6.7% 7 3.7% 52 6.1%
White 210 75.0% 162 79.0% 136 76.0% 154 82.4% 662 77.8%
Nonresident Alien 0 0.0% 1 0.5% 0 0.0% 1 0.5% 2 0.2%
Two or more Races 22 7.9% 10 4.9% 8 4.5% 6 3.2% 46 5.4%
Unreported 2 0.7% 4 2.0% 2 1.1% 5 2.7% 13 1.5%
Total 280 205 179 187 851
Percentages of Students by Race 2010-11 to Present
10 11 11 12 12 13 13 14 14 15 15 16 16 17 17 18 18 19 19 20
Black 6.0 7.6 8.9 8.1 7.7 6.4 4.7 4.4 4.9 5.1
Am. Indian/Alaska Native 0.6 0.6 0.6 0.6 0.5 0.4 0.4 0.6 0.5 0.3
Asian 0.7 1.2 1.4 1.9 1.8 1.4 0.9 0.5 0.7 0.7
Hispanic 2.0 1.8 2.2 2.2 2.1 2.2 3.7 3.8 3.8 4.5
White 84.7 83.2 80.5 81.0 81.6 80.9 84.0 86.0 85.6 84.9
Native Hawaiian/ Pacific Island 0.2 0.1 0.1
Nonresident Alien 2.0 1.1 0.8 0.3 0.1 0.1 0.6 0.3 0.4 0.3
Two or more Races 1.3 2.2 4.4 4.8 5.4 5.7 3.5 3.1 3.1 2.9
Unreported 2.8 2.4 1.2 1.1 0.8 2.9 2.0 1.2 1.0 1.2
Black 7.4 7.2 7.6
Am. Indian/Alaska Native 0.2 0.1 0.0
Asian 0.3 0.7 1.3
Hispanic 4.8 4.6 6.1
White 82.0 81.2 77.8
Native Hawaiian/ Pacific Island 0.0 0.0 0.0
Nonresident Alien 0.5 0.6 0.2
Two or more Races 3.1 3.8 5.4 Unreported 1.8 1.9 1.5
HAMPDEN SYDNEY COLLEGE FACT BOOK 2022-23 • • • 28
N %
% N %
20 21 21 22 22 23 23 24 24 25 25 26 26 27 27 28 28 29 29 30
2022 23 Students by State FR SO JR SR TOTAL PERCENT
Alabama 5 4 1 1 11 1.3%
Alaska 1 1 0.1%
Arkansas 1 1 0.1%
Arizona 0 0.0%
California 2 1 3 0.4%
Colorado 1 1 0.1%
Connecticut 2 2 0.2%
Delaware 1 1 0.1%
District of Columbia 2 2 0.2%
Florida 5 3 5 4 17 2.0%
Georgia 14 6 5 4 29 3.4%
Hawaii 0 0.0%
Idaho 1 1 0.1% Illinois 0 0.0% Indiana 1 1 0.1% Kentucky 1 2 1 4 0.5% Louisiana 0 0.0% Maine 1 1 0.1%
Maryland 7 7 4 5 23 2.7% Massachusetts 1 1 0.1% Michigan 0 0.0% Minnesota 1 1 2 0.2% Mississippi 2 2 0.2%
New Jersey 1 1 0.1% New Mexico 0 0.0% New York 1 2 3 0.4% North Carolina 42 25 19 28 114 13.4% Ohio 1 1 0.1% Oklahoma 1 1 0.1% Oregon 1 1 0.1% Pennsylvania 1 5 6 0.7% South Carolina 7 3 7 5 22 2.6% South Dakota 0 0.0%
Tennessee 4 5 1 3 13 1.5% Texas 6 4 10 1.2% Vermont 1 1 0.1%
Virginia 172 130 132 129 563 66.2% Washington 1 1 2 0.2%
West Virginia 1 1 0.1% Wisconsin 0 0.0% Wyoming 0 0.0%
US citizen living abroad 2 2 0.2%
Total students from US 276 204 179 183 842 98.9% # States 21 20 11 12 32
HAMPDEN SYDNEY COLLEGE FACT BOOK 2022 23 • • • 29
China*
Ghana
Japan
Philippines
2022-23 Students by Foreign Country*
Total Percent
1 0.1%
2 0.2%
2 0.2%
1 0.1%
Saudi Arabia* 0.0%
United Kingdom of Great Britain & Northern Ireland
Total foreign students
Foreign Countries
citizen living abroad.
Affiliation,
23 Fall Enrollment
1 0.1%
7 0.8%
HAMPDEN SYDNEY COLLEGE FACT BOOK 2022-23 • • • 30
FR SO JR SR
1
1 1
2
1
1
4 1 0 2
No.
2 1 0 2 5 *US
Student calculated on Students by State table. Religious
2022
2022-23 Virginia Students by County
Freshman Sophomore Junior Senior Total
Accomack 2 2 1 5
Albemarle 2 2 1 5 10
Alleghany 0
Amelia 3 3
Amherst 1 1
Appomattox 2 4 6 Arlington 1 1 2 4 Augusta 1 1 2 Bath 0 Bedford 2 1 3 Bland 0
Botetourt 1 3 4 Brunswick 0 Buchanan 0 Buckingham 1 2 1 4 Campbell 3 1 4 Caroline 0 Carroll 1 1 Charles City 0 Charlotte 1 1 1 2 5 Chesterfield 21 21 18 10 70 Clarke 1 1 Craig 0
Culpeper 1 2 1 4 Cumberland 1 3 4 Dickenson 1 1 Dinwiddie 1 1 2 Essex 0
Fairfax 5 9 6 5 25
Fauquier 2 3 3 8 Floyd 0 Fluvanna 4 1 5 Franklin 1 3 4 Frederick 0 Giles 0 Gloucester 1 1 2 Goochland 4 4
HAMPDEN SYDNEY COLLEGE FACT BOOK 2022-23 • • • 31
Virginia Counties, Continued
Freshman Sophomore Junior Senior Total
Grayson 0 Greene 0
Greensville 0
Halifax 2 1 3
Hanover 4 5 6 7 22 Henrico 12 19 10 9 50 Henry 3 2 5 Highland 0
Isle of Wight 1 1 2 1 5
James City 2 7 2 1 12 King and Queen 0 King George 1 1 2 King William 1 2 1 4 Lancaster 0 Lee 0
Loudoun 1 3 4 3 11 Louisa 2 2 1 5 Lunenburg 3 1 1 5 Madison 1 1 Mathews 2 2 Mecklenburg 2 1 1 2 6 Middlesex 1 1 2 Montgomery 1 2 3 Nelson 2 1 3 New Kent 4 3 7 Northampton 0 Northumberland 0 Nottoway 1 1 Orange 1 1 2 Page 0 Patrick 0
Pittsylvania 3 3 1 7 Powhatan 4 1 2 3 10
Prince Edward 5 1 5 7 18
Prince George 2 1 3 Prince William 5 2 2 5 14 Pulaski 1 1 Rappahannock 0
HAMPDEN SYDNEY COLLEGE FACT BOOK 2022-23 • • • 32
Virginia Counties, Continued
Freshman Sophomore Junior Senior Total
Roanoke 0
Rockbridge 1 1
Rockingham 1 1 Russell 0
Scott 0
Shenandoah 1 1
Smyth 0 Southampton 1 1 2
Spotsylvania 3 1 1 5 Stafford 1 2 1 4
Surry 0 Sussex 0
Tazewell 0 Warren 0 Washington 2 2 Westmoreland 0 Wise 1 1 Wythe 1 1 York 4 2 2 8
TOTALS 121 99 93 99 412
No. of counties 43 30 34 37 61
HAMPDEN SYDNEY COLLEGE FACT BOOK 2022-23 • • • 33
2022 23 Virginia Students by City Freshman Sophomore Junior Senior Total
Alexandria 3 2 1 1 7 Bedford 0 Bristol 0
Buena Vista 1 1 Charlottesville 1 1 2 Chesapeake 5 3 2 1 11 Clifton Forge 0
Colonial Heights 2 1 3 Covington 0
Danville 2 1 2 5 Emporia 0
Fairfax City 1 1 Falls Church 1 1 2 Franklin 0 Fredericksburg 1 1 Galax 0 Hampton 1 1 2 Harrisonburg 0 Hopewell 0 Lexington 0 Lynchburg 2 2 Manassas 0 Manassas Park 0 Martinsville 1 1 1 3 Newport News 3 1 4 Norfolk 6 6 1 13 Norton 0 Petersburg 1 1 Poquoson 3 1 4 Portsmouth 1 1 Radford 1 1 2 4 Richmond 1 1 3 5 Roanoke 9 5 1 5 20 Salem 2 2 South Boston 0 Staunton 1 1 Suffolk 4 1 4 1 10 Virginia Beach 11 8 14 10 43 Waynesboro 0 Williamsburg 0 Winchester 1 1 1 3
TOTALS 51 31 39 30 151
No. of cities 17 12 15 14 25
HAMPDEN SYDNEY COLLEGE FACT BOOK 2022-23 • • • 34
Opening Enrollment Trends
2003-04 through Present
First Semester
Second Semester N % Change N % Change % 1st Sem
2003 04 1,039 0.1 996 0.8 95.9
2004 05 1,082 4.1 1,030 3.4 95.2
2005 06 1,060 -2.1 1,007 -2.3 95.0
2006 07 1,106 4.3 1,069 5.8 96.7
2007 08 1,122 1.5 1,074 0.4 95.7
2008 09 1,120 -0.2 1,052 -2.0 93.9
2009 10 1,068 -4.6 1,025 -2.6 96.0
2010 11 1,058 -0.94 1,000 -2.4 94.5
2011 12 1,057 -0.09 996 -0.4 94.5
2012 13 1,080 2.18 1016 2.0 94.1
2013 14 1,070 -0.93 1,020 0.4 95.3
2014 15 1,105 3.27 1,052 3.1 95.2
2015 16 1,087 -1.63 1,041 -1.0 95.8
2016 17 1,027 -5.52 989 -5.0 96.3
2017 18 1,046 1.85 1,007 1.8 96.3
2018 19 1,072 2.49 1,030 2.3 96.1
2019 20 993 -12.97 936 -9.1 94.3
2020 21 881 -11.28 859 -8.2 97.5
2021 22 851 -3.41 809 -5.8 95.1
2022 23 851 0.0
5-Year 10 Year Average Average
Second Semester Enrollment As Percent of First Semester Enrollment 95.8 95.5
HAMPDEN SYDNEY COLLEGE FACT BOOK 2022-23 • • • 35
HAMPDEN SYDNEY COLLEGE FACT BOOK 2022-23
Second Semester 2021-22 Enrollment
Spring 2021-22 Enrollment In-State Out-of-State Total
N % N % N %
Freshmen 127 62.6% 76 37.4% 203 25.1%
Sophomore 143 74.1% 50 25.9% 193 23.9%
Junior 107 65.2% 57 34.8% 164 20.3%
Senior 173 76.5% 53 23.5% 226 27.9%
New/Return for Spring 16 76.2% 5 23.8% 21 2.6%
Return COVID LOA 1 50.0% 1 50.0% 2 0.2%
TOTAL 567 70.1% 242 29.9% 809
Add’l 11 Fall 2021 Seniors did not return as degree pending.
In-state, Out-of-state Second Semester Enrollment Trends, 2021 - present 2012-13 2013-14 2014-15 2015-16 2016-17
N % N % N % N % N %
In State 707 69.7 731 71.7 740 70.3 737 70.8 685 70.0
Out-of-State 309 30.4 289 28.3 312 29.7 304 29.2 304 30.0
Total 1,016 1,020 1,052 1,041 989 2017 18 2018 19 2019 20 2020 21 2021 22 N % N % N % N % N %
In State 696 69.1 719 69.8 665 70.0 612 71.2 567 70.1%
Out-of-State 311 30.9 311 30.2 281 30.0 247 28.8 242 29.9%
Total 1,007 1,030 936 859 809
• • • 36
Unduplicated Headcount Trends, 2012- Present
2012- 2013- 2014- 2015- 2016- 2017- 2018- 2019- 20202013 2014 2015 2016 2017 2018 2019 2020 2021 N N N N N N N N N
Fall 1,080 1,070 1,105 1,087 1,027 1,046 1,072 993 881 Total 1,094 1,092 1,124 1,112 1,054 1,061 1,090 1,003 905
Diff. 14 22 19 25 27 15 18 10 24
2021- 2022- 2023- 2024- 2025- 2026- 2027- 2028- 20292022 2023 2024 2025 2026 2027 2028 2029 2030 N N N N N N N N N
Fall 851 851
Total 874 Diff. 23
Freshman Second Semester Enrollment Trends, 2007-08 - present
2007-08 2008-09 2009-10 2010-11 2011-12 N N N N N
Fall 334 314 295 315 321 Spring 305 288 269 290 291 % 91.3% 91.7% 91.2% 92.1% 90.7%
2012 13 2013 14 2014 15 2015 16 2016 17 N N N N N
Fall 342 292 322 305 283 Spring 310 272 308 289 268 % 90.6% 93.2% 95.7% 94.8% 94.7%
2017 18 2018 19 2019 20 2020 21 2021 22 N N N N N
Fall 312 343 228 219 222 Spring 290 314 210 210 203 % 92.9% 91.5% 92.1% 95.9% 91.4%
10-Yr Ave: 93.2%
Prior 10 Yr. Ave: 93.1%
HAMPDEN SYDNEY COLLEGE FACT BOOK 2022-23 • • • 37
Attrition
Fall, 2021-22 to Spring, 2021 22 Academic Suspensions, Other Reasons
In State, Out of State
ATTRITION BY ATTRITION BY SUSPENSION, OTHER IN-STATE, OUT-OF-STATE Academic Suspension Other In-State Out-of-State Total N % N % N % N % N %
Freshman 6 31.6% 13 68.4% 11 57.9% 8 42.1% 19 34.5%
Sophomore 7 35.0% 13 65.0% 17 85.0% 3 15.0% 20 36.4%
Junior 2 18.2% 9 81.8% 9 81.8% 2 18.2% 11 20.0%
Senior 1 20.0% 4 80.0% 4 80.0% 1 20.0% 5 9.1%
Total 16 29.1% 39 70.9% 41 74.5% 14 25.5% 55 4.64% of fall, 2021-22 students who were eligible to return did not. (*** Excludes academic suspension, honor suspension, honor expulsion, summary suspension, and degree pending students.)
Stated Reasons for Not Returning
FR SO JR SR+ TOTAL % %
Personal 2 3 3 8 14.5% 0.9%
Academic Difficulty 1 1 1.8% 0.1%
Disciplinary/Honor Suspension 0 0.0% 0.0%
Medical 4 4 3 2 13 23.6% 1.5%
Medical WD Pending 1 1 1.8% 0.1% Retroactive Medical WD 0 0.0% 0.0%
Financial Difficulty 1 1 1.8% 0.1%
Academic Suspension 6 7 2 1 16 29.1% 1.9%
Transfer Public 6 3 9 16.4% 1.1% Transfer Private 0 0.0% 0.0% Disciplinary/Honor Expulsion 0 0.0% 0.0%
Leave of Absence 0 0.0% 0.0%
Matriculated left before 1st class 0 0.0% 0.0%
Balance due-reg hold 1 1 2 2 6 10.9% 0.7% Military 0 0.0% 0.0% Miscellaneous 0 0.0% 0.0% Unknown 0 0.0% 0.0% COVID leave 0 0.0% 0.0% Death 0 0.0% 0.0%
Total 19 20 11 5 55
Note: First percentage listed is of withdrawals; second is percentage of total enrollment. + 11 from Fall 2021 completed coursework - degree pending
HAMPDEN SYDNEY COLLEGE FACT BOOK 2022-23 • • • 38
Facilities Section
2022 23 Campus Facilities by Primary Use
Principle Use of Building
Number of Buildings Total Sq Footage
Academic Buildings 13 287,692
Faculty/Staff Housing 21 57,562
Building and Grounds
1,790
48,000 Water/Sewer
Fraternity Housing 13 75,871 Athletics 5 138,027
Administrative Buildings 10 33,882 Student Housing 35 253,689 Student Services 9 84,006 Other 2 4,353
Total All Buildings 113 984,872
Facilities Major Buildings
Building Name Year Built Sq Footage Academic Buildings Brinkley Hall 1880/1936/1967/REN 2017 21,540 Walter M. Bortz, III Library 2007 76,771 College Church Seminar Rms. (shared space) 2002 1,024 ERG Facility 2015 1,170 Gilmer Science 1968 51,808 Gilmer Greenhouse 1968 1,320 Johns Auditorium 1951/REN 2004 16,727
Maples 1879 5,014 Morton Hall 1936/REN 1994 21,700 Observatory 1997 960 Wilson Center 1920/ADD 2011 4,446 Pannill Center for Rhetoric 1920/ADD 2017 11,500 Pauley Science Center 2022 287,692 287,692
Faculty/ Staff Housing
Baird House 1953 2,711 Cherry Hill 1952 1,726 Coleman Cottage 1829 847
Espigh House 1971 3,918 Hamlett House Upstairs 1955 1,328 Hamlett House Downstairs 1955 600 Hillsman Duplex A & B 1966 2,799
Leslie House 1961 1,701 Middlecourt 1829 6,200
HAMPDEN SYDNEY COLLEGE FACT BOOK 2022 23 • • • 39
1
4
Building Name Year Built Sq Footage
Moore House 1935 3,150 Moore Apartment 1935 500
Morrison Place 1850 3,075 Nelson 1991 2,505
Penshurst 1830/REN 1990 4,801
Sagebrook A & B 2005 3,544
Sagebrook C & D 2005 3,544
Simms House 1969 1,452
Slate Hill Cottage 1980 950
Slate Hill House 1954 2,824
Thornton Place 2003 3,467 Westmerton 1856 5,920 57,562
Buildings & Grounds
Main Office B & G 2001 48,000
Water & Sewage Lagoon 495 Pump/Filter Well #4 Atkinson Rd. 495 Pump Well #1 300 Water Filtration Plant 500 1,790
Fraternity Housing Alpha Chi Sigma 2000/NEW 3,684 Beta Theta Pi 1999/NEW 5,764
Chi Phi 1996/REN 8,931 Chi Phi South 1946 1,272 Kappa Alpha 1998/REN 6,393 Kappa Sigma 1941/REN 1999 8,257
Lambda Chi Alpha 1996/REN 6,345 Phi Gamma Delta 2000/REN 6,154
Pi Kappa Alpha 1998/REN 5,399 Sigma Alpha Epsilon 2000/NEW 5,764 Sigma Chi 1999/NEW 5,764 Sigma Nu 2000/REN 5,639
Theta Chi 2000/REN 6,505 75,871
Athletics
Everett Stadium 2007 7,249 Kirby Field House 1979 75,660
HAMPDEN SYDNEY COLLEGE FACT BOOK 2022 23 • • • 40
Building Name Year Built Sq Footage
Kirk Athletic Center 1941/1954/1973/2008 50,337
Tad Pole Garage 2007 1,152
Ty Cobb Ballpark 2011 3,629 138,027
Administrative Buildings
Building Name Year Built Sq Footage Atkinson Hall 1834/REN 1995 6,120 Atkinson Museum 1941/ADD1992/ADD2010 5,088
Blake A 1972 3,880
Birthplace 1750/REN 2000 690
Cabell House 1928 2,838
Estcourt 1831 4,887
Estcourt Annex 2002 1,200
Gilkeson 1984 1,732
Hampden House 1858 5,533
Wilson/Bush House 1955 1,914 33,882
Student Housing
Alpha B Dorm 1984 6,758
Alpha C Dorm 1984/REN 2003 10,140
Blake B 1972/REN 1987 3,880
Blake C 1972/REN 1987 3,880 Blake D 1972/REN 1987 3,880 Blake E 1972/REN 1987 3,880
Burrell House 1903 2,863
Carpenter X 1990 13,000
Carpenter Y 1990 14,500
Carpenter Z 1995 13,000
Coxe Hall 1984/REN 2012 7,062
Cushing Hall 1822 1824/1833/REN 1999 30,610
Dickinson Hall 1984/REN 2002 7,062
Dishman 1931 1,285
Elliott House 1855 3,124
Hampden Units 1 8 1976 2,464
Hampden Units 9 16 1976 2,464
Hampden Units 17 24 1976 4,928
Hampden Units 25 36 (Basement) 1976 4,928
Johnson Hall 1984 7,062
HAMPDEN SYDNEY COLLEGE FACT BOOK 2022 23 • • • 41
Building Name Year Built Sq Footage
Melvin House 1931 1,648
Music House (DuPuy) 1946 2,751
Old Sigma 1947 1,173
Reed House 933 1,582
The Grove (Hickory House) 2020 7,708
The Grove (Oak House) 2020 6,518
The Grove (Osage House) 2020 8,161
The Grove (Poplar House 2020 6,429
The Grove (Sycamore House) 2020 5,524
The Grove (The Lodge) 2020 1,105
Venable Hall 1825/1830/REN 1988 33,900 Whitehouse/Colonnades 1968 23,358 251,861
Student Services
Brown Student Center 2017 25,626 Carriage House 1870 620 Crawley Forum 1984 8,010 Graham Hall 1833/1916 16,865 Joyner House (Wellness Ctr.) 1960 2,231 Pavillion 1991 560 Pannill Hall (Food Services) 1990/REN 2006 26,100 Thompson House (Counseling Ctr.) 1962 2,196 Wauchope (Women's Guest House) 1967 1,798 84,006
Other Finch 1931 3,556 Log Cabin 1926 797 4,353
HAMPDEN SYDNEY COLLEGE FACT BOOK 2022 23 • • • 42
Oldest Building
Building
Acreage
Undeveloped
campus
campus
HAMPDEN SYDNEY COLLEGE FACT BOOK 2022-23 • • • 43 Campus
– Developed,
Developed 263 acres Undeveloped 1,075 acres TOTAL 1,338 acres
on
= The Birthplace, 1750 Cushing Hall, 1822 Newest
on
= Pauley Science, 2022 Number of Offices and Staff Departments FT Staff PT Staff Total Staff 2018 19 29 253 6 259 2019-20 29 247 5 252 2020-21 31 234 3 237 2021-22 32 216 3 219 2022-23 32 219 1 220
Faculty Section
2022 23 Fall Male/Female Faculty
By Rank*
Tenured, Tenure Track Emeritus, Adjunct, Visiting, Other Male Female Sub total Male Female Sub total N
N % N % N %
Professor 26 74.3% 9 25.7% 35 100.0% 0.0% 0 0.0% Assoc. Professor 11 52.4% 10 47.6% 21 95.5% 1 100.0% 1 4.5% Asst. Professor 16 69.6% 7 30.4% 23 71.9% 5 55.6% 4 44.4% 9 28.1% Senior Lecturer 2 100.0% 0 0.0% 2 100.0% Lecturer 12 66.7% 6 33.3% 18 100.0%
Total 53 67.1% 26 32.9% 79 72.5% 20 66.7% 10 33.3% 30 27.5%
By Gender* Male Female Total N % N % N %
Professor 26 74.3% 9 25.7% 35 32.1% Assoc. Professor 12 54.6% 10 45.5% 22 20.2% Asst. Professor 21 65.6% 11 34.4% 32 29.4% Sr. Lecturer 2 100.0% 0 0.0% 2 1.8% Lecturer 12 66.7% 6 33.3% 18 16.5%
Total 73 67.0% 36 33.3% 109
By Gender and Full-time/Part-time* Male Female Total
Full Time Faculty 61 83.6% 30 33.3% 91 83.5%
Part Time Faculty 12 16.4% 6 31.6% 18 16.5%
Total 73 67.0% 36 33.3% 109
HAMPDEN SYDNEY COLLEGE FACT BOOK 2022-23 • • • 44
% N % N %
N % N % N %
* INCLUDES all faculty and staff teaching in fall semester only ~~~~~ 7.3%offacultyareminority ~~~~~
2022 23 Full time Equivalent Faculty Student/Faculty Ratio
Fall Faculty
Full Time Faculty
Time
Faculty
Time Faculty
Faculty
Based on Federal Reporting Definitions
Full Time Faculty
Time Faculty
Faculty
Time Faculty
Faculty
Student/Faculty
Faculty
Based on Total Faculty (budgetary model)
Full Time Faculty
Time
Faculty
Time Faculty
Faculty
Faculty
HAMPDEN SYDNEY COLLEGE FACT BOOK 2022 23 • • • 45
Based on Actual
(INCLUDES all faculty and staff teaching in fall semester only)
........................................................ 91 Part
Faculty........................................................ 18 Total
.............................................................. 109 Part
FTE ................................................ 6.4 FTE
97.4 Student/Faculty Ratio .................................................. 7.8 Student/FTE Faculty Ratio............................... 8.7
(INCLUDES faculty on sabbatical or leave with pay; DOES NOT INCLUDE deans, faculty on leave without pay, or replacements for faculty on sabbatical or leave with pay.)
........................................................ 94 Part
14 Total
.............................................................. 108 Part
FTE ................................................ 4.8 FTE
98.8
Ratio .................................................. 7.9 Student/FTE
Ratio............................... 8.6
(incl. fall and FY Sabbaticals, LOA, and replacements) historically used in longitudinal comparison
........................................................ 94 Part
Faculty........................................................ 22 Total
.............................................................. 116 Part
FTE 7.6 FTE
............................................................... 101.6 Student/Faculty Ratio 7.3 Student/FTE
Ratio............................... 8.4
Fall 2022 23 Average Credit Hour Load For Faculty by Rank*
Average Credit
Average Number Average Credit Hour Load Students Taught Hrs Generated
Professor 9.8 43.8 118.7
Associate Professor 10.3 45.5 135.3
Assistant Professor 10.2 47.4 139.0
Senior Lecturer 10.5 50 150
Lecturer 4.2 23.6 63.5
Overall 9.0 42.0 119.5
2022-23 Faculty Highest Degree Earned by Rank*
Doctorate Masters Other Total N % N % N % N %
Professor 33 94.3% 2 5.7% 0.0% 35 32.1%
Associate Professor 21 95.5% 1 4.6% 0.0% 22 20.2%
Assistant Professor 29 90.6% 3 9.4% 0.0% 32 29.4%
Sr. Lecturer 1 50.0% 1 50.0% 0.0% 2 1.8% Lecturer 9 50.0% 8 44.4% 1 5.6% 18 16.5%
TOTAL 93 95.3% 15 13.8% 1 0.9% 109
*INCLUDES all faculty and staff teaching in fall semester only
2022-23 Faculty by Years of Service (Numbers include fall faculty ONLY)
No. Years N %
0 to 5 47 43.1%
6 to 10 8 7.3% 11 to 15 10 9.2% 16 to 20 12 11.0% 21 to 25 15 13.8% 26 to 30 8 7.3%
31 to 35 5 4.6% 36+ 4 3.7%
Total 109
HAMPDEN SYDNEY COLLEGE FACT BOOK 2022-23 • • • 46
2022 23 Tenured, Tenure track Faculty Salaries by Rank^
High Low Median Mean
Full Professor
$140,905 $57,174 $91,271 $94,481
Associate Professor $102,227 $70,556 $76,580 $77,275
Assistant Professor $115,000 $62,000 $65,495 $69,319
2022 23 Tenured and All Non tenured Faculty Salaries by Rank^
Full Professor
High Low Median Mean
$140,905 $57,174 $91,271 $94,491
Associate Professor $102,227 $70,000 $76,580 $76,984
Assistant Professor $115,000 $58,800 $64,900 $66,762
Senior Lecturer * * * * $63,416
Lecturer/Instructor/ $118,846 $20,426 $58,140 $58,378
Emeritus
* NOTE: Senior Lecturer maximum and minimum salary not provided due to only two faculty with this rank.
Mean Salaries by Rank and Gender^ Male Female
$ $ Professor $95,836 $90,416
Assoc. Professor $76,042 $78,508
Asst. Professor $67,602 $65,159
Sr. Lecturer $63,416 Lecturer $68,893 $52,093
Total $80,128 $75,111
^ NOTE: These figures are derived using total salaries at full time levels for all faculty positions at all ranks for the academic year (i.e., all faculty including sabbaticals, LOA, visiting faculty, and those that teach only in the spring). Administrators teaching courses and private lesson are NOT included.
HAMPDEN SYDNEY COLLEGE FACT BOOK 2022-23 • • • 47
Faculty Trend Data
Number of Faculty/Faculty FTE/Student-Faculty Ratios, 2010-11 to Present
16-17* 17-18* 18-19* 19-20* 20-21* 21-22*
Full Time Faculty 88 97 97 96 92 87
Part Time Faculty 24 13 14 18 20 19
Total Faculty 112 110 111 114 112 106
Part Time Faculty FTE 12.5 4.9 4.4 6.6 7.6 5.9
FTE Faculty 100.5 101.9 101.4 102.6 99.6 92.9
Student/Faculty Ratio 9.2 9.5 9.6 8.7 7.9 8.0
Student/FTE Faculty Ratio 10.2 10.3 10.5 9.9 8.8 9.2
22-23*
Full Time Faculty 94
Part Time Faculty 14
Total Faculty 108 Part Time Faculty FTE 4.8
FTE Faculty 98.8 Student/Faculty Ratio 7.9 Student/FTE Faculty Ratio 8.6
* Based on Federal reporting definitions. Actual fall student/faculty ratio= 8.2 and student/FTE ratio = 9.4.
Percentage of Faculty by Highest Degree Earned, 2007-08 to Present 07-08 08-09 09-10 10-11 11-12 12-13 13-14 14-15 15-16
Doctorate 75.0 75.2 82.4 82.3 85.1 85.7 86.0 83.8 89.0
Master’s 21.8 23.1 16.0 16.8 14.0 13.3 13.1 15.2 10.1 Bachelor’s
Other 3.2 1.7 1.7 0.9 0.9 1.0 0.9 1.0 0.9
16 17 17 18 18 19 19 20 20 21 21 22 22 23 23 24 24 25
Doctorate 86.4 90.0 86.5 86.0 85.3 84.6 85.3
Master’s 12.7 10.0 12.6 13.2 13.7 13.5 13.8
Bachelor’s 0.9 1.0
Other 0.9 0.9 1.9 0.9
HAMPDEN SYDNEY COLLEGE FACT BOOK 2022-23 • • • 48
Percentage of Faculty by Years of Service, 2007-08 to Present
08 08 09
10 10 11 11 12 12 13 13 14 14 15 15 16
0-5 37.9 37.2 37.0 34.5 31.6 28.6 29.0 31.1 24.3
6-10 18.5 19.0 16.0 12.4 11.4 13.3 14.0 13.6 18.7
11 15 9.7 9.9 10.9 15.9 15.8 16.2 16.8 12.6 9.3
16 20 9.7 9.1 11.8 11.5 11.4 10.5 9.3 11.7 15.0
21 25 8.9 7.4 7.6 8.8 8.8 9.5 9.3 11.7 10.3
26 30 7.3 9.1 7.6 8.0 9.6 10.5 8.4 5.8 9.3
31 35 4.8 4.1 5.0 4.4 4.4 6.7 11.2 6.8 8.4
35+ 3.2 4.1 4.2 4.4 7.0 4.8 1.9 6.8 4.7
16-17 17-18 18-19 19-20 20-21 21-22 22-23 23-24 24-25
0-5 27.3 32.7 34.2 37.7 35.3 39.4 43.1
6-10 16.4 10.0 9.9 7.0 8.8 8.7 7.3
11 15 9.1 11.8 11.7 11.4 15.7 12.5 9.2
16 20 14.5 15.5 15.3 12.3 11.8 7.7 11.0
21 25 9.1 9.1 9.0 10.5 11.8 14.4 13.8
26 30 9.1 5.5 8.1 9.6 7.9 7.7 7.3
31 35 10.0 8.2 4.5 5.3 3.9 4.8 4.6
35+ 4.5 7.3 7.2 6.1 4.9 4.8 3.7
HAMPDEN SYDNEY COLLEGE FACT BOOK 2022-23 • • • 49
07
09
HAMPDEN SYDNEY COLLEGE FACT BOOK 2022-23
Mean Salaries by Rank 2007-08 to Present
07-08 08-09 09-10 10-11 11-12 12-13
Professor 82,369 89,495 88,578 86,300 86,884 89,453
Associate Professor 62,554 68,405 65,473 63,754 65,171 62,991
Assistant Professor 51,694 56,024 53,966 52,828 50,803 53,419
Lecturer/Instructor/ 42,093 41,377 36,667 44,432 45,452 40,123 Emeritus
13 14 14 15 15 16 16 17 17 18 18 19
Professor 85,807 86,131 86,237 87,673 87,957 91,145
Associate Professor 63,139 66,755 67,392 66,973 66,836 67,469
Assistant Professor 53,649 54,444 59,920 60,856 63,491 61,902
Senior Lecturer 50,763 57,717 57,717 56,840 62,389
Lecturer/Instructor/ 45,677 44,816 41,836 47,972 46,615 51,049 Emeritus
19 20 20 21 21 22 22 23 23 24 24 25
Professor 93,607 93,784 92,656 94,491
Associate Professor 74,917 74,226 74,493 76,984
Assistant Professor 62,761 62,927 62,728 66,762
Senior Lecturer 64,261 60,170 62,718 63,416
Lecturer/Instructor/ 50,356 47,673 48,554 58,378 Emeritus
NOTE: These figures are derived using total salaries at full time levels for all faculty positions at all ranks for the academic year (i.e., all faculty including sabbaticals, LOA, visiting faculty, and those that teach only in the spring). Administrators teaching courses and private lesson are NOT included.
• • • 50
Financial Aid Section
Freshmen Financial Aid – 2022 23 %
N Freshmen
Aid Recipients 279 99.6%
Need Based Aid Applicants 206 73.6%
Need Based Aid Recipients 206 73.6%
Average Financial Need
Average Need Based Award (no Parent Loan included) $48,240 Average Need Based Award (Parent Loan included)
Recipients Dollars
Federal Financial Aid N % % N % % Average
ACG 0.0% 0.0% 0.0% 0.0% $0
Pell Grant 65 35.5% 31.6% $358,025 37.6% 3.2% $5,508
SEOG 48 35.8% 23.3% $72,000 36.1% 0.7% $1,500 Perkins Loan 0.0% 0.0% SSL (Subsidized) 85 31.1% 41.3% $279,149 25.7% 2.5% $3,284 SSL (Unsubsidized) 133 34.5% 47.7% $476,659 33.1% 4.3% $3,584
Parent Loans 24 21.2% 8.6% $511,555 24.0% 4.6% $21,315
Supplemental Student Loan 0.0% 0.0% CWSP 101 45.1% 49.0% $135,491 43.2% 1.2% $1,341
GEER grant 0.0% 0.0%
Sub Total 186 37.0% 66.7% $1,832,879 29.9% 16.6% $9,854
State Financial Aid
CSAP 0.0% 0.0% 0.0% 0.0% TAGP 127 25.0% 45.5% $571,500 25.1% 5.2% $4,500
PHEAA Grant 0.0% 0.0% 0.0% 0.0% Byrd Scholarship 0.0% 0.0% 0.0% 0.0% Other state aid 0.0% 0.0% 0.0% 0.0% Sub Total 127 25.0% 45.5% $571,500 25.1% 5.2% $4,500
HSC Financial Aid
Direct Grants 267 36.3% 129.6% $4,152,543 34.2% 37.5% $15,553
Honors Scholarships 0 0.0% 0.0% $0 0.0% 0.0% Achievement Awards 253 39.1% 90.7% $5,075,828 42.9% 45.9% $20,063
Hobbie Scholarships 0 0.0% 0.0% $0 0.0% 0.0% $0 Booker Stebbins Loan 54 45.0% 19.4% $216,000 44.4% 2.0% $4,000 Citizen/Leader Awards 41 30.8% 14.7% $326,000 35.3% 2.9% $7,951
Tuition Remissions 6 28.6% 2.2% $262,628 28.4% 2.4% $43,771
Sub-Total 206 26.9% 73.8% $10,032,999 35.0% 90.7% $48,704 Other Aid 59 44.7% 21.1% $604,299 27.4% 5.5% $10,242
GRAND TOTAL 279 33.2% $11,059,018 28.4% $39,638
Notes: The first percentage for recipients is of the total students receiving an award for that program; the second is the percentage of the subgroup. The first percentage after dollars awarded is of total dollars for that program; the second is the percentage of the total dollars awarded to the subgroup. Subtotals and totals reflect unduplicated recipients.
HAMPDEN SYDNEY COLLEGE FACT BOOK 2022-23 • • • 51
..................................................................................$44,778
................................$53,684
Aid Recipients
Need Based Aid Applicants
Need Based Aid Recipients
Average Financial Need
Upperclassmen Financial Aid
Upperclassmen
98.1%
62.3%
62.3%
Average Need Based Award (no Parent Loan included)
Average Need Based Award (Parent Loan included) $53,339
Recipients Dollars
Federal Financial Aid
ACG 0.0% 0.0% 0.0%
Average
ARPA Grant 1 0.0% 0.0% $2,500 100.0% 0.0% $2,500
Pell Grant 118 64.5% 33.1% $593,735 62.4% 3.7% $5,032
SEOG 86 64.2% 24.2% $127,500 63.9% 0.8% $1,483
SMART 0.0% 0.0% 0.0% 0.0%
Perkins Loan 0.0% 0.0%
SSL (Subsidized) 188 68.9% 52.8% $807,076 74.3% 5.0% $4,293 SSL (Unsubsidized) 252 65.5% 45.0% $962,057 66.7% 3.8% $3,818
Parent Loans 89 78.8% 15.9% $1,617,700 76.0% 6.4% $18,176
Supplemental Student Loan 0.0% 0.0%
CWSP 123 54.9% 22.0% $178,502 56.8% 0.7% $1,451
GEER grant 0.0% 0.0%
Sub Total 317 63.0% 56.6% $4,289,070 70.1% 17.0% $13,530
State Financial Aid
CSAP
TAGP 253 66.6% 71.1% $1,133,017 66.5% 7.0% $4,478
PHEAA Grant 0.0% 0.0%
Byrd Scholarship 0.0% 0.0% 0.0% 0.0% Other state Aid 2 100.0% 0.6% $2,000 0.1% 0.0% $1,000
Sub Total 253 66.6% 71.1% $1,135,017 66.5% 7.0% $4,486
HSC Financial Aid
Direct Grants 469 63.7% 131.7% $6,779,694 64.5% 41.9% $14,456
Honors Scholarships 29 100.0% 8.1% $565,000 100.0% 3.5% $19,483
Achievement Awards 262 57.5% 73.6% $4,651,950 54.5% 28.8% $17,756
Hobbie Scholarships 8 100.0% 2.2% $35,500 100.0% 0.2% $4,438
Booker Stebbins Loan 46 51.1% 12.9% $187,500 51.6% 1.2% $4,076
Citizen/Leader Awards 59 65.6% 16.6% $435,564 64.5% 2.7% $7,382
Tuition Remissions
Sub Total
Other Aid
GRAND TOTAL
Notes:
unduplicated
60.0% 2.5% $398,192 60.3% 2.5% $44,244
63.2% 98.6% $13,053,400 61.1% 80.8% $37,189
48.6% 14.9% $904,346 60.2% 5.6% $17,063
63.3% 100.0% $16,164,090 61.9% 100.0% $45,405
the subgroup.
total dollars awarded to the subgroup.
HAMPDEN SYDNEY COLLEGE FACT BOOK 2022-23 • • • 52
– 2022 23 % N
560
356
356
..................................................................................$46,471
..........................$45,404
N % % N % %
9
351
53
356
The first percentage for recipients is of the total students receiving an award for that program; the second is the percentage of
The first percentage after dollars awarded is of total dollars for that program; the second is the percentage of the
Subtotals and totals reflect
recipients.
Aid Recipients
Need Based Aid Applicants
Need Based Aid Recipients
Total Financial Aid
98.7%
66.0%
66.0%
2022 23
Average Financial Need $45,844
Average Need Based Award (no Parent Loan included)
$46,444
Average Need Based Award (Parent Loan included) $53,465
Federal Financial Aid
Recipients Dollars
ACG 0 0.0% 0.0% $0 0.0%
ARPA Grant 1 0.2% 0.1% $2,500 0.0% $2,500
Pell Grant 183 21.8% 20.8% $951,760 2.4% $5,201
SEOG 134 16.0% 15.2% $199,500 0.5% $1,489
SMART 0 0.0% 0.0% $0 0.0%
Perkins Loan 0 0.0% 0.0% $0 0.0% SSL (Subsidized) 273 32.5% 31.0% $1,086,225 2.8% $3,979 SSL (Unsubsidized) 385 45.8% 43.7% $1,483,716 3.7% $3,737
Parent Loans 113 13.5% 12.8% $2,129,255 5.5% $18,843
Supplemental Student Loan 0 0.0% 0.0% $0 0.0%
CWSP 224 26.7% 25.4% $313,993 0.8% $1,402
GEER grant 0 0.0% 0.0% $0 0.0%
Sub Total 503 59.9% 57.1% $6,121,949 15.7% $12,171
State Financial Aid
CSAP 0 0.0% 0.0% $0 0.0%
TAGP 507 60.4% 57.5% $2,273,767 5.8% $4,485
PHEAA Grant 0 0.0% 0.0% $0 0.0%
Byrd Scholarship 0 0.0% 0.0% $0 0.0%
Other state Aid 2 0.2% 0.2% $2,000 0.0% $1,000 Sub Total 507 60.4% 57.5% $2,275,767 5.8% $4,489 HSC Financial Aid
Direct Grants 736 87.6% 83.5% $12,147,177 31.2% $16,504
Honors Scholarships 100 11.9% 11.4% $2,254,575 5.8% $22,546 Achievement Awards 647 77.0% 73.4% $11,820,733 30.3% $18,270
Hobbie Scholarships 11 1.3% 1.2% $44,000 0.1% $4,000 Booker Stebbins Loan 120 14.3% 13.6% $486,500 1 2% $4,054
Citizen/Leader Awards 133 15.8% 15.1% $960,564 2.5% $7,222 Tuition Remissions 21 2.5% 2.4% $923,948 2.4% $43,998
Sub Total 767 91.3% 87.1% $28,637,497 73.5% $37,337
Other Aid 132 15.7% 15.0% $2,207,606 5.7% $16,724
GRAND TOTAL 840 95.3% $38,975318 $46,444
Notes: The first percentage for recipients is of the total number of students receiving aid; the second percentage is of the total student body. The percentage after dollars awarded is of total dollars awarded. Subtotals and totals reflect unduplicated recipients.
HAMPDEN SYDNEY COLLEGE FACT BOOK 2022-23 • • • 53
–
N % Students
840
562
562
..........................................
N % % N % Average
Financial Aid Trend Data
2006-07 to Present
Financial Aid Recipients
Direct Grant Honors Scholarship Total Need Based Recipients Recipients
N % N
N
N %
2006 07 1,074 97.1 547 49.5 648 58.6 199 18.0
2007 08 1,095 97.6 540 48.1 710 63.3 203 18.1
2008 09 1,088 97.1 541 48.3 737 65.8 199 17.8
2009 10 1,048 98.1 566 53.0 811 75.9 200 18.7
2010 11 1,045 98.8 599 56.6 825 78.0 213 20.1
2011 12 1,047 91.1 603 57.0 1,028 98.2 172 16.4
2012 13 1,072 99.3 652 60.4 1,041 97.1 182 17.0
2013 14 1,057 98.8 681 63.6 1,038 98.2 179 16.9
2014 15 1,092 98.8 712 64.4 1,038 95.1 183 16.8
2015 16 1,079 99.3 696 64.0 1,038 96.2 198 18.4
2016 17 1,016 98.9 650 63.3 862 83.9 205 20.2
2017 18 1,035 98.9 682 65.2 895 85.6 208 19.9
2018 19 1,066 99.4 730 68.1 902 86.2 222 21.2
2019 20 982 98.9 658 66.3 835 84.1 151 15.2
2020 21 873 99.1 609 69.1 858 97.4 153 17.4
2021 22 837 98.4 553 65.0 703 78.8 152 17.3
2022 23 840 98.7 562 66.0 736 83.5 29 2.2
Note : Percentages listed are of total student body.
Average Financial Aid Awards, 2006-07 to Present Need Direct Honors SSL Need Award Grant Award Loan Work
2006 07 24,990 28,797 6,762 13,662 3,357 1,579
2007 08 26,723 30,875 6,438 12,897 4,001 1,674
2008 09 28,771 32,696 6,703 12,630 4,264 1,959
2009 10 31,066 33,412 7,105 11,561 4,240 1,804
2010 11 35,750 35,524 7,054 13,945 3,928 1,804
12 32,055 36,305 6,579 18,142 4,191 1,647
13 34,117 37,346 7,271 19,975 4,217 1,372
14 35,395 38,720 7,756 21,436 4,272 1,385
15 37,721 39,583 8,973 21,863 4,295 1,398
16 40,248 41,538 10,025 22,324 4,459 1,380
17 39,866 43,159 11,514 22,759 4,373 1,394
18 41,535 44,896 11,928 22,918 4,286 1,395
19 41,286 45,541 12,661 22,966 4,304 1,413
20 42,446 46,927 12,755 23,331 3,294 1,405
21 43,301 48,912 12,515 23,139 3,603 1,418
22 45,888 51,459 16,319 22,197 3,587 1,466
23 45,844 53,465 16,504 22,546 3,979 1,402
HAMPDEN SYDNEY COLLEGE FACT BOOK 2022-23 • • • 54
%
%
2011
2012
2013
2014
2015
2016
2017
2018
2019
2020
2021
2022
Total Financial Aid, 2006-07 to Present Federal Aid State Aid HSC Aid
Total %
Total % Total %
2006 07 7,888,042 35.6 2,004,150 9.0 11,154,857 50.3
2007 08 8,052,015 33.2 2,405,100 9.9 12,277,360 50.6
2008 09 8,160,215 32.2 2,430,267 9.6 12,724,533 50.3
2009 10 8,238.833 31.5 2,220,820 8.5 13,899,619 53.1
2010 11 9,086,630 31.3 1,905,527 6.6 15,996,012 55.1
2011 12 8,599,876 29.1 1,901,186 6.4 17,480,169 59.2
2012 13 8,746,625 27.4 2,059,170 6.5 19,674,420 61.7
2013 14 8,831,395 26.5 2,297,000 6.9 20,480,804 61.4
2014 15 8,891,834 25.3 2,345,150 6.7 22,134,614 62.9
2015 16 8,923,867 24.1 2,338,950 6.3 23,784,019 64.2
3016 17 8,362,304 22.8 2,240,000 6.1 23,465,114 64.1
2017 18 8,468,718 21.8 2,300,721 5.9 25,382,611 65.3
2018 19 8,541,860 20.7 2,414,120 5.8 27,386,597 66.3
2019 20 8,229,305 21.1 2,297,816 5.9 26,082,037 66.8
2020 21 7,144,289 19.5 2,155,360 5.9 25,351,240 69.3
2021 22 6,464,688 17.5 2,305,500 6.2 26,410,603 71.5
2022 23 6,121,949 15.7 2,275,767 5.8 28,637,497 73.5
Other Aid Overall Percent Total % Total Change
2006 07 1,134,338 5.1 22,185,887 9.3
2007 08 1,533,173 6.3 24,267,648 9.4
2008 09 1,996,367 7.9 25,311,382 4.3
2009 10 1,826,080 7.0 26,186,060 3.5
2010 11 2,025,000 7.0 29,013,169 10.8
2011 12 1,552,085 5.3 29,533,316 1.8
2012 13 1,430,150 4.5 31,910,365 8.0
2013 14 1,720,120 5.2 33,329,319 4.5
2014 15 1,839,949 5.2 35,216,547 5.7
2015 16 1,976,220 5.3 37,023,056 5.1
2016 17 2,532,210 6.9 36,599,628 1.1
2017-18 2,705,792 7.0 38,857,842 6.2
2018 19 2,993,831 7.2 41,336,408 6.4
2019 20 2,462,547 6.3 39,071,705 5.5
2020 21 1,939,971 5.3 36,590,860 6.3
2021 22 1,742,208 4.7 36,922,999 0.9
2022 23 2,207,606 5.7 38,975,318 5.6
HAMPDEN SYDNEY COLLEGE FACT BOOK 2022-23 • • • 55
Percent of Freshmen, Applying for, Receiving Financial Aid
Need Based Need Based All Applicants Change Recipients Change Recipients Change
2006 07 53.2 -0.8 51.9 -2.1 98.0 -2.0
2007 08 54.5 1.3 53.4 1.5 98.5 0.5
2008 09 54.1 -0.4 54.1 0.7 98.4 -0.1
2009 10 62.0 7.9 62.0 7.9 99.7 1.3
2010 11 63.2 1.2 63.2 1.2 98.7 -1.0
2011 12 61.3 -1.9 61.3 -1.9 99.1 0.4
2012 13 66.4 5.1 66.3 5.0 99.7 0.6
2013 14 70.2 3.8 70.2 3.9 98.3 -1.4
2014 15 68.6 -1.6 68.6 -1.6 100.0 1.7
2015 16 65.6 -3.0 65.6 -3.0 100.0 0.0
2016 17 70.0 4.4 70.0 4.4 99.3 -0.7
2017 18 73.4 3.4 73.4 3.4 100.0 0.7
2018 19 72.9 -0.5 72.9 -0.5 99.7 -0.3
2019 20 73.3 0.4 73.3 0.4 100.0 0.3
2020 21 79.5 6.2 79.0 5.7 99.1 -0.9
2021 22 69.4 -10.1 69.4 -9.6 98.6 -0.5
2022 23 73.6 4.2 73.6 4.2 99.6 1.0
Percent of Upperclassmen Applying for, Receiving Financial Aid
Need Based Need Based All Applicants Change Recipients Change Recipients Change
2006 07 48.8 3.5 48.6 3.5 96.7 3.5
2007 08 46.4 -2.4 45.8 -2.8 97.2 0.5
2008 09 46.2 -0.2 45.0 -0.8 96.7 -0.5
2009 10 49.9 3.7 49.7 4.7 97.5 0.8
2010 11 54.0 4.1 53.8 4.1 98.8 1.3
2011 12 55.5 1.5 55.2 1.4 99.1 0.3
2012 13 57.9 2.4 57.7 2.5 99.1 0.0
14 61.3 3.4 61.2 3.5 99.0 -0.1
15 62.7 1.4 62.6 1.4 98.3 -0.7
16 63.6 0.9 63.4 0.8 99.0 0.7
17 60.8 -2.8 60.8 -2.6 98.8 -0.2
18 62.1 1.3 61.7 0.9 98.5 -0.3
19 65.8 3.7 54.7 -7.0 99.3 0.8
20 64.3 -1.5 64.2 9.5 98.6 -0.7
21 65.7 1.4 65.6 1.4 99.1 0.5
22 63.4 -2.3 63.4 -2.2 98.3 -0.8
23 62.3 -1.1 62.3 -1.1 98.1 -0.2
HAMPDEN SYDNEY COLLEGE FACT BOOK 2022-23 • • • 56
2013
2014
2015
2016
2017
2018
2019
2020
2021
2022
Percent of All Students Applying for, Receiving Financial Aid
Need-Based Need-Based All Applicants Change Recipients Change Recipients Change
2006 07 49.6 1.7 49.5 1.7 97.1 1.8
2007 08 48.8 -0.8 48.1 -1.4 97.6 0.5
2008 09 48.4 -0.4 48.3 0.2 97.1 -0.5
2009 10 53.2 4.8 53.0 4.7 97.1 0.0
2010 11 56.7 3.5 56.6 3.6 98.8 1.7
2011 12 57.2 0.5 57.0 0.4 99.1 0.3
2012 13 60.6 3.4 60.4 3.4 99.3 0.2
2013 14 63.7 3.1 63.6 3.2 98.8 -0.5
2014 15 64.4 0.7 64.3 0.7 98.8 0.0
2015 16 64.1 -0.3 64.0 -0.3 99.3 0.5
2016 17 63.3 -0.8 63.3 -0.7 98.9 -0.4
2017 18 65.4 2.1 65.2 1.9 98.9 0.0
2018 19 68.1 -5.3 68.0 -5.4 99.4 0.6
2019 20 66.4 -1.7 66.3 -1.7 98.9 -0.5
2020 21 69.1 2.7 68.9 2.6 99.1 0.2
2021 22 65.0 -4.1 65.0 -3.9 98.4 -0.7
2022 23 66.0 1.0 66.0 1.0 98.7 0.3
Pell Recipient 6 year Graduation Rate
Entry Year Grad Year Grad Rate
2015 63%
2016 70%
2017 54.5%
2018 67.1% 2013 2019 61.5%
2020 55.9%
2021 65.5%
2022 75.9%
HAMPDEN SYDNEY COLLEGE FACT BOOK 2022-23 • • • 57
2009
2010
2011
2012
2014
2015
2016
BOOK 2022-23
Graduate Section
Trends
2021 22 Graduates N % Ave. GPA
Bachelor of Arts 171 75.3% 3.00
Bachelor of Science........................................................... 56 24.7% 3.20 Total 227 3.05
8.8 % of the 2021 22 graduating class completed two majors. 48.5 % of the 2021 22 graduating class completed at least one minor. Although no females were among the graduating class of 2022, the total number of female graduates from H SC is 12.
TOP FOUR majors:
Economics & Business (22.0%) Government (14.1%) History (12.3%) Biology (9.9%)
Bachelor of Arts/Bachelors of Science Trends – 2012-13 to Present
2012 13 2013 14 2014 15 2015 16 N % N % N % N %
Bachelor of Arts 170 82.5 170 74.6 169 79.3 171 74.9
Bachelor of Science 36 17.5 58 25.4 44 20.7 64 25.1
2016 17 2017 18 2018 19 2019 20 N % N % N % N %
Bachelor of Arts 170 78.7 193 78.5 163 79.1 170 76.9

Bachelor of Science 46 21.3 53 21.5 43 20.9 51 23.1
2020 21 2021 22 2022 23 2023 24 N % N % N % N %
Bachelor of Arts 157 74.1 171 75.3
Bachelor of Science 55 25.9 56 24.7
HAMPDEN SYDNEY COLLEGE FACT
• • • 58
May graduates
Academic Year Graduate Trends
BOOK
2015 to Present
graduates
5.0
230 93.5 188 91.3
6.5 18 8.7
206
2.97
207 91.2
20 8.8
22 Academic Year Graduates by CIP Code Category
Category
Grads
HAMPDEN SYDNEY COLLEGE FACT
2022-23 • • • 59
–
2015 16 2016 17 2017 18 2018 19 N % N % N % N %
236 92.5 202 78.7
Summer graduates 19 7.5 14 21.3 16
TOTAL 255 216 246
CAREER GPA 2.98 3.00 2.96
2019-20 2020-21 2021-22 2022-23 N % N % N % N % May
210 95.0 195 92.0
Summer graduates 11
17 8.0
TOTAL 221 212 227 CAREER GPA 3.02 3.03 3.05 2021
Code
%
11 Computer & Information Sciences ........................ 2.02% 14 Engineering 2.02% 16 Foreign Lang, Lit, & linguistics............................... 1.62% 23 English ........................................................................ 5.67% 26 Biological/Life Sciences........................................... 9.72% 27 Mathematics & Statistics .......................................... 2.43% 30 Interdisciplinary Studies ........................................... 0.00% 38 Philosophy & Religious Studies .............................. 4.05% 40 Physical Sciences ....................................................... 5.26% 42 Psychology ................................................................. 3.24% 45 Social Sciences ......................................................... 29.96% 50 Visual & Performing Arts ........................................ 2.43% 52 Business/Marketing ................................................ 20.24% 54 History ...................................................................... 11.34%
Majors Completed by 2021-22 Academic Year Graduates
% grads
Applied Mathematics
(CIP 26)
(CIP 26)
(CIP 40).......................................................................6
Studies (CIP 16)
Science (CIP
Mathematical Economics
Economics and Business (CIP
Economics (CIP 45)
Engineering Physics (CIP 14)
English (CIP 23)
Affairs (CIP 45)
(CIP 16)
(CIP 16)
(CIP 45)
Greek (CIP 16)
and Latin (CIP 16)
(CIP 54)
Interdisciplinary Studies (CIP 30)
(CIP 16)................................................................................
(CIP 27)
(CIP 38)
Physics (CIP 40)
(CIP 42)
Religion (CIP 38)
Spanish (CIP 16)
Theatre (CIP 50)
Visual Arts (CIP 50)
majors
1.76 1.62
0.88 0.81
9.69 8.91
2.43
0.81
2.02
3.96 3.64
22.03 20.24
8.37 7.69
2.20 2.02
6.17 5.67
6.17 5.67
-
9.43 8.70
- -
-
14.10 12.96
- -
-
0.81
1.62
3.08 2.83
3.52 3.24
2.64 2.43
0.81
1.32 1.21
1.21
HAMPDEN SYDNEY COLLEGE FACT BOOK 2022-23 • • • 60 All
N
%
(CIP 27) 4
Biochemistry
2
Biology
........................................................... 22
Chemistry
2.64
Classical
2 0.88
Computer
11) ........................................................5 2.20
(CIP45) .............................................9
52) ............................... 50
19
.....................................................5
......................................................................... 14
Foreign
15
French
- -
German
.......................................................................... - -Government
............................................................... 20
-
Greek
............................................................ - -
History
........................................................... 32
-
Latin
- -
Mathematics
..................................................................2 0.88
Philosophy
.....................................................................4 1.76
7
Psychology
8
..........................................................................6
...........................................................................2 0.88
3
.....................................................................3 1.32
* Percentages are based on the total number of academic year graduates. Graduates may have completed more than one major. TOP FOUR MAJORS OF GRADS IN BOLD.
Asian
Alumni
and Public
the Public Interest
Year

1.68
1.68
5.04
2.52
1.68
0.84
2.52
3.36
0.84
6.72
0.84
3.36
12.61
5.88
5.04
11.76
2.52
and Ethnicity Studies
0.84
26.89
0.84
2.52
HAMPDEN SYDNEY COLLEGE FACT BOOK 2022-23 • • • 61 All Minors Completed by 2021 22 Academic
Graduates N %
Studies ................................................................ 2
Astronomy .................................................................... -Biology 2
Chemistry ...................................................................... 6
Classics .......................................................................... 3
Computer Science........................................................ 2
Creative Writing 1
Environmental Studies .................................... 3
French .......................................................................... -German 4
Greek 1
History ......................................................................... 8
Latin ............................................................................... -Latin American Studies 1
Law
Policy ................................................. 4
Leadership in
.................... 15
Math............................................................................... 7
Music 6
National Security ............................................. 14
Neuroscience ................................................................ 3
Race
-Religion 1
Rhetoric ........................................................... 32
Spanish .......................................................................... 1
Theatre -Visual Arts .................................................................... 3
* Percentages are based on the total number of graduate minors in the academic year. Graduates may have completed more than one minor. TOP MINORS OF GRADS IN BOLD.
There are: 5,774 living alumni in the Commonwealth of Virginia. 10,740 living alumni in total.
Library Section
2021 Library Highlights
Walter M. Bortz, III Library continues to rank with the top of college libraries in the Princeton Review’s The Best 388 Colleges (published August 2022). As 5th of 388, Bortz Library is the highest ranked in Virginia. Visit Princeton Review H-SC
Bortz Library, Central Virginia Regional Library, and Longwood University’s Greenwood Library signed a memorandum of understanding creating the Southside Area Libraries Sharing Access (SALSA) catalog consortium. SALSA’s mission is to “foster personal, economic, and community progress and prosperity by offering the citizens of central and Southside Virginia access to high-quality and diverse collections.”
New digital collections include a comprehensive archive of issues of the HampdenSydney Tiger from 2014 to the present; transcribed oral histories documenting events in the history of civil rights in the Prince Edward County community; and 202 scanned photographic images from the Hampden-Sydney College archives.
2022 Library Services
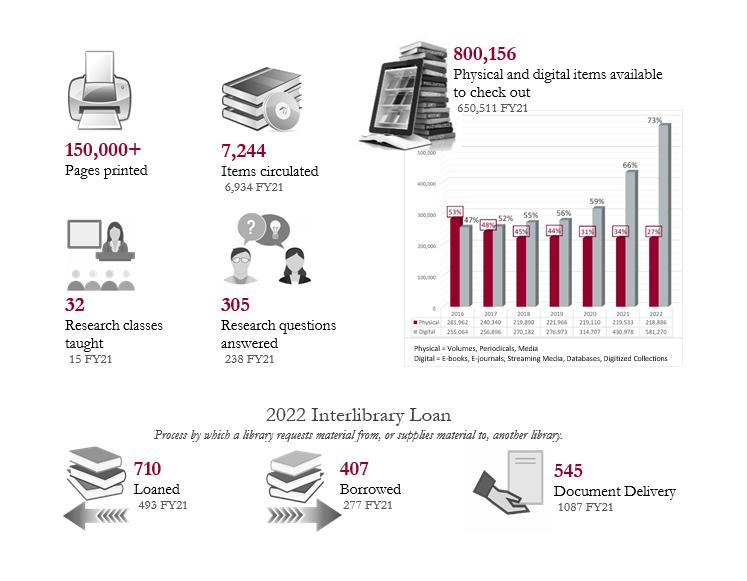
HAMPDEN SYDNEY COLLEGE FACT BOOK 2022-23 • • • 62
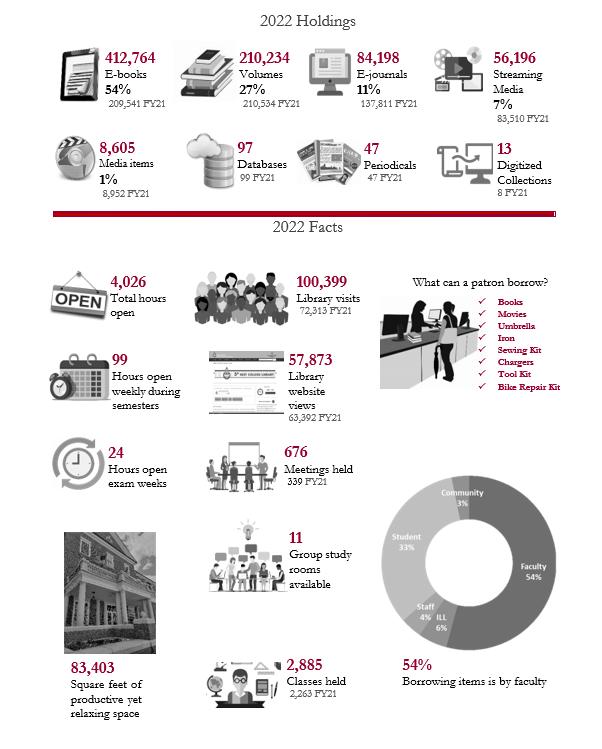
HAMPDEN SYDNEY COLLEGE FACT BOOK 2022 23 • • • 63 2022 Library Holdings and Facts
Outcomes Section
Job and Grad School Placement Rate Comparison, graduation year 2019 20 (CR8.1)
H-SC NACE 1st Destination Survey (SE region)
NACE 1st Destination Survey (bachelor’s degree)
82.3% 77% 82.0% https://www.naceweb.org/job market/graduate outcomes/first destination/class of 2020/interactive dashboard/ 2019 20 is the most recently available comparison year.
Job and Grad School Placement Rate Disaggregated
Job & Grad School Placement Rates
Outcomes
2018 Grad Outcomes 2018 2019 Grad Outcomes 2019 2020 Grad Outcomes 2020 21 National Nace Outcome Rate (SE region) 79% 80% 77% In progress
Hampden SydneyOverall 88.4% 75.6% 82.3% 81.0%
Pell 91.3% 72.4% 77.8% 84.4%
Non Pell 87.9% 76.3% 83.1% 80.3%
White 88.6% 75.5% 81.8% 79.6% Non white 87.5% 76.2% 85.7% 88.9%
Suburban Locale 90.0% 70.0* 84.9% 84.4% All other Locales 88.0% 78.0% 81.7% 79.8%
Student Loan Default Rate
Fiscal H-SC National Year Default Rate Threshold
7.8% 6.3%
3.9% 6.5%
5.2% 7.0%
3.5% 6.6%
6.3% 6.3%
4.4% 6.3%
4.7% 5.0% https://www2.ed.gov/offices/OSFAP/defaultmanagement/cdr.html
HAMPDEN SYDNEY COLLEGE FACT BOOK 2022-23 • • • 64
Grad
2017
2012
2013
2014
2015
2016
2017
2018