HAMPDEN-SYDNEY COLLEGE FACT BOOK 2021-22 •••
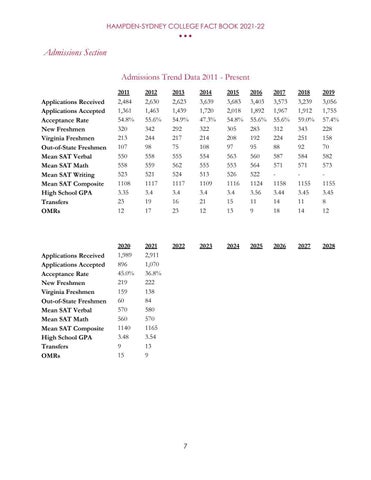
Admissions Section Admissions Trend Data 2011 - Present Applications Received Applications Accepted Acceptance Rate New Freshmen Virginia Freshmen Out-of-State Freshmen Mean SAT Verbal Mean SAT Math Mean SAT Writing Mean SAT Composite High School GPA Transfers OMRs
2011 2,484 1,361 54.8% 320 213 107 550 558 523 1108 3.35 23 12
2012 2,630 1,463 55.6% 342 244 98 558 559 521 1117 3.4 19 17
2013 2,623 1,439 54.9% 292 217 75 555 562 524 1117 3.4 16 23
2014 3,639 1,720 47.3% 322 214 108 554 555 513 1109 3.4 21 12
2015 3,683 2,018 54.8% 305 208 97 563 553 526 1116 3.4 15 13
2016 3,403 1,892 55.6% 283 192 95 560 564 522 1124 3.56 11 9
2017 3,573 1,967 55.6% 312 224 88 587 571 1158 3.44 14 18
2018 3,239 1,912 59.0% 343 251 92 584 571 1155 3.45 11 14
2019 3,056 1,755 57.4% 228 158 70 582 573 1155 3.45 8 12
2021 2,911 1,070 36.8% 222 138 84 580 570 1165 3.54 13 9
2022
2023
2024
2025
2026
2027
2028
Applications Received Applications Accepted Acceptance Rate New Freshmen Virginia Freshmen Out-of-State Freshmen Mean SAT Verbal Mean SAT Math Mean SAT Composite High School GPA Transfers OMRs
2020 1,989 896 45.0% 219 159 60 570 560 1140 3.48 9 15
7