Figure 2
80
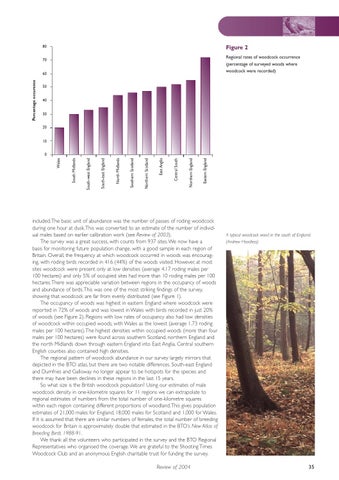
Regional rates of woodcock occurrence (percentage of surveyed woods where woodcock were recorded)
70
Percentage occurence
60 50 40 30 20 10
Eastern England
Northern England
Central South
East Anglia
Northern Scotland
Southern Scotland
North Midlands
South-east England
South-west England
South Midlands
Wales
0
included. The basic unit of abundance was the number of passes of roding woodcock during one hour at dusk. This was converted to an estimate of the number of individual males based on earlier calibration work (see Review of 2003). The survey was a great success, with counts from 937 sites. We now have a basis for monitoring future population change, with a good sample in each region of Britain. Overall, the frequency at which woodcock occurred in woods was encouraging, with roding birds recorded in 416 (44%) of the woods visited. However, at most sites woodcock were present only at low densities (average 4.17 roding males per 100 hectares) and only 5% of occupied sites had more than 10 roding males per 100 hectares. There was appreciable variation between regions in the occupancy of woods and abundance of birds. This was one of the most striking findings of the survey, showing that woodcock are far from evenly distributed (see Figure 1). The occupancy of woods was highest in eastern England where woodcock were reported in 72% of woods and was lowest in Wales with birds recorded in just 20% of woods (see Figure 2). Regions with low rates of occupancy also had low densities of woodcock within occupied woods, with Wales as the lowest (average 1.73 roding males per 100 hectares). The highest densities within occupied woods (more than four males per 100 hectares) were found across southern Scotland, northern England and the north Midlands down through eastern England into East Anglia. Central southern English counties also contained high densities. The regional pattern of woodcock abundance in our survey largely mirrors that depicted in the BTO atlas, but there are two notable differences. South-east England and Dumfries and Galloway no longer appear to be hotspots for the species and there may have been declines in these regions in the last 15 years. So what size is the British woodcock population? Using our estimates of male woodcock density in one-kilometre squares for 11 regions we can extrapolate to regional estimates of numbers from the total number of one-kilometre squares within each region containing different proportions of woodland. This gives population estimates of 21,000 males for England, 18,000 males for Scotland and 1,000 for Wales. If it is assumed that there are similar numbers of females, the total number of breeding woodcock for Britain is approximately double that estimated in the BTO’s New Atlas of Breeding Birds 1988-91. We thank all the volunteers who participated in the survey and the BTO Regional Representatives who organised the coverage. We are grateful to the Shooting Times Woodcock Club and an anonymous English charitable trust for funding the survey.
Review of 2004
A typical woodcock wood in the south of England. (Andrew Hoodless)
35