Unleashing the pure power of plants

ANNUAL REPORT 2022/2023
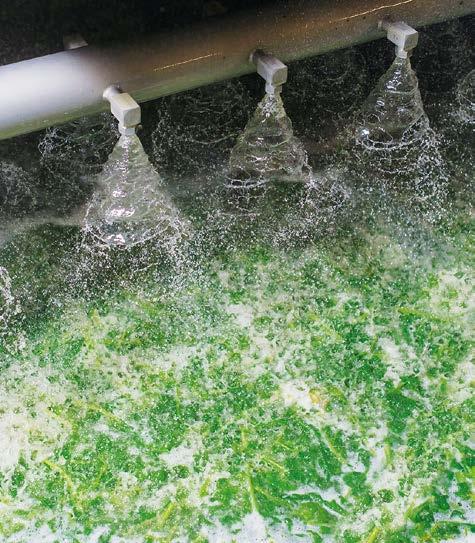
In an ever-evolving agricultural industry, staying ahead of the game requires a seamless integration of customer relationships with efficient supply chain management.

2 / Contents Message from our co-CEOs 5 Greenyard at the heart of the global transition to healthier food 6 Highlights 11 Greenyard’s relevance today, and tomorrow 17 The pure power of plants: an integral part of Greenyard’s Strategy 2030 18 Our strategy in a nutshell: nine Greenyard-themes 20 Food of the future: the role of fruit & vegetables for people & planet 23 The transition to pure-plant diets is the only way forward 24 The pure power of plants as part of the solution 29 Why fruit and vegetables should play the starring role on your plate 30 Increasing healthy, pure-plant food consumption through innovation 32 Making our customers stand out from the crowd 38 Bridging the gap between growers and the market 44 Driven by a passionate group of people 51 We are Greenyard! 52 The Greenyard approach: improving life with our sustainability strategy & reporting 59 Sustainability Model 60 Double Materiality Assessment 62 Stakeholder engagement 64 Sustainability Roadmap & Ambitions 66 United Nations Sustainable Development Goals 74 Environmental impact 77 Climate change & footprint reduction 79 Water stewardship 83 Food waste & circular economy 86 Sustainable agriculture & biodiversity 89 Social impact 93 Responsible sourcing 95 Health & nutrition 98 Talent attraction & employee development 100 Health, safety & well-being 103 Local community engagement & citizenship 105 41
As a people-oriented business, we always prioritise the health and safety of our employees. Regardless of their job, role or function. Everyone must feel protected and safe at work.

As a responsible company, Greenyard commits to a sustainability strategy that reflects the views of its stakeholders and adresses the issues that really matter.
/ 3 Economic impact & governance 107 Governance 109 Measure & act 113 Food safety, quality & traceability 114 Innovation 116 Tax transparancy 117 Greenyard at a glance 119 Operational footprint 120 Sourcing footprint 124 EU Taxonomy 129 Introduction 130 Eligible activities of Greenyard under EU Taxonomy 131 Definition of Turnover, CAPEX and OPEX within the EU Taxonomy 132 Assurance statement auditor 139 Data tables 147 GRI-index 153 Financial Report 161 Message from the CFO | On a steady course towards a healthier future for all 162 Key financial information 169 Report of the Board of Directors 175 Consolidated financial statements 223 Notes to the consolidated financial statements 231 Statement of responsible persons 287 Statutory auditor’s report on the consolidated financial statement 291 Condensed statutory accounts of the parent company greenyard nv, according to belgian accounting standards 299 Financial definitions 307
64 103

4 / UNLEASHING THE PURE POWER OF PLANTS
Message from our co-CEOs

/ 5 GREENYARD ANNUAL REPORT 2022/2023
The time is now Greenyard at the heart of the global transition to healthier food
The financial year 2022-2023 was marked once again by severe macro-economic circumstances. After navigating through COVID and the global supply chain disruptions of 2021-2022, we were confronted with the shocking war in the Ukraine. A horrible conflict, with unspeakable consequences in the region. And with a severe impact on people and businesses throughout Europe and beyond. It resulted in shortages, unseen inflation rates, equity market volatility and soaring energy prices as from March last year.
People’s purchasing power was clearly impacted, to the point where some needed to make tough choices in their household budgets and their food expenditure. The availability – and in some cases the accessibility – of healthy foods, became more important than ever.
Our colleagues stepped up and truly went the extra mile. Together, we navigated through another unpredictable year. We want to explicitly thank them. They show great passion for our products, find creative solutions and have displayed tireless efforts to do what they promise. Together with our customers and our growers, we all further supported the acceleration towards a healthier future for all.
Strong results in tough times –outperforming the market
Greenyard continues to build a strong track record, with like-for-like net sales increasing to € 4 638,0m (+7,9%). Adjusted EBITDA increased to a level just above last year, to € 167,3m. In addition, the net financial debt of the group (pre-IFRS 16) has decreased to € 277,3m (from € 303,6m last year), even with higher valued inventory in the Long Fresh segment due to inflation. The leverage ratio further decreased from 2,4x to 2,2x. Net result ended at € 9,3m versus € 16,9m last year.
These are very strong results in such a difficult year and we did it on our own strengths, by improving our operations and being resilient in our price setting. Once again illustrating the strength of our business model, with our Integrated Customer Relationships (ICR) as the catalyst for our performance. Our effective model enabled us to work more cost-efficiently in the supply chain and to better charge through increased input costs, in a

6 / MESSAGE FROM OUR CO - CEO s | HIGHLIGHTS | GREENYARD’S RELEVANCE | FOOD OF THE FUTURE | PURE POWER OF PLANTS | DRIVEN BY PASSION & PEOPLE
transparent manner (even if not fully, and with a limited time delay). This allowed us to capture price increases, based on open and fair communication, which resulted in price increases by 8,5%.
Moreover, where many retailers were struggling with product shortages and empty shelves, we have been able to supply our customers with a full range of products throughout the year. Relying on our global scale with sourcing capacity over the entire world, and our longterm relationships with growers, we were able to adapt and find solutions for our customers.
A growing appetite for our unique business model
In these times of volatile markets and product shortage, we are seeing a growing appetite for our way of working. Early 2023, we have concluded another Integrated Customer Relationship with an important retailer, supplying and servicing more than 100 stores in Germany. Today, in total, already 75% of the Fresh sales originate from Integrated Customer Relationships. Today, we are already working on the next ones.
The market also recognises the value of our sustainable and transparent way of working. Sustainability has always been the cornerstone in our strategy. It is an essential element in all decision-making processes, from sourcing and distribution to our daily operations, and even in finance: last year, we refinanced all our loans into
sustainability-linked loans. It’s a decision which clearly illustrates that sustainability is embedded in every layer of our organisation, creating value for our customers, consumers, our supply chain and the environment.
An offering for every budget and lifestyle
In this financial year, we also reaped the benefits of another part of our unique business model – our complementary offering of fresh, frozen and prepared prod-

/ 7 GREENYARD APPROACH | ENVIRONMENTAL IMPACT | SOCIAL IMPACT | ECONOMIC IMPACT & GOVERNANCE | GREENYARD AT A GLANCE | FINANCIAL REPORT
With 10 billion people to feed by 2050, we will have to find better and more sustainable ways of producing food – with less impact and more nutritional value – if we don’t want to jeopardise the future of our planet for our children, grandchildren, and the generations after them. The time is now.”
Hein Deprez, co-CEO Greenyard
ucts. The European sector organisation for fresh produce, estimates that the average consumption of fresh fruit and vegetables per capita declined by 10% in the year 2022(*). Contrary to this, Greenyard has seen volumes remain stable, with a slight decrease of - 0,8%. A limited drop in volumes in the Fresh segment (- 1,9%) shows that our Fresh division is performing stronger than the total market of fresh fruit and vegetables. This leads to the fact that we are taking additional market share in this segment. And on top of that, we also see a clear increase in volumes in the Long Fresh segment (+ 4,5%). It sets us apart in the sector and creates a strong steppingstone for future growth.
This evolution shows the power of our unique combination of three divisions. Greenyard was able to absorb the volumes of consumers that have down traded from certain fresh categories into frozen and ambient food categories. And this is exactly where the synergies of our global business lay: at the consumer side. Our complementary product offerings are in line with consumers’ own experiences and expectations and enable us to provide consumers with the right product for any budget, any lifestyle and any eating moment.
During the tough macro-economic circumstances of last year, we did not slow down our search for continuous
improvement within our own operations. We see it as our responsibility towards our growers and our customers to be at the forefront of innovation, operational excellence and technology. The roll-out of ERP software in the Fresh division will allow us to capture more and better data and translate them into valuable business information. The same goes for our forecasting tools used to better predict supply and demand. We continue to push our organisation to be mindful of the value of information to better service our customers and consumers.
Looking forward with confidence
Based on our performance of last year, we have decided to reinstate a dividend policy. Greenyard's Board of Directors will therefore propose to the general meeting of shareholders on 15 September 2023 to approve a dividend of € 0,10 per share for the full financial year which ended in March 2023.
And we look ahead with confidence. As we move forward, we remain resolute to achieving sustainable growth and creating long-term value for everyone in the food value chain, and for our shareholders. We expect our sales to grow to ca. € 4 900m for the full financial year 2023-2024 and expect an Adjusted EBITDA of € 175-180m. Also in
* Freshfel Europe is the European Fresh Produce Association, representing the interests of the fresh fruit and vegetables supply chain in Europe and beyond. Freshfel Europe currently has over 200 members, including both companies and associations. Press release with the projections can be found here: https://freshfel.org/newsroom/press-releases/
8 / MESSAGE FROM OUR CO - CEO s | HIGHLIGHTS | GREENYARD’S RELEVANCE | FOOD OF THE FUTURE | PURE POWER OF PLANTS | DRIVEN BY PASSION & PEOPLE
We look ahead with confidence. As we move forward, we remain resolute to achieving sustainable growth and creating long-term value for everyone in the food value chain, and for our shareholders.”
Marc Zwaaneveld, co-CEO Greenyard
this new financial year, we will continue our journey with a clear focus on additional growth opportunities. We expect further acceleration in our Integrated Customer Relationships (organic growth and new relationships), upcoming product and category innovations and keep looking for relevant and value adding external growth.
Looking to the years to come, we set our ambitions for the longer run at € 5,4bn sales and between € 200-210m of Adjusted EBITDA, by the end of March 2026.
The future of food is here –and it’s all about pure-plant power
We are confident in our ambitious outlook because we are convinced we are on the right side of history, for people and for our planet. Every indicator shows that fruit and vegetables – even though they have been around since forever – are the food of the future.
With 10 billion people to feed by 2050, we will have to find better and more sustainable ways of producing food – with less impact and more nutritional value – if we don’t want to jeopardise the future of our planet for our children, grandchildren, and the generations after them. The time is now.
Consumers are looking for healthier lifestyles, a search that has been intensified following the worldwide COVID pandemic. Even the most gastronomic restaurants are putting pure-plant food at the centre of their menus. Our renewed appreciation for pure-plant food is not just some hype. What we are seeing today is a cultural transition –we have reached a tipping point and we’re not going back.
Today, as a global leader in this domain, Greenyard is at the heart of this major transition. As a matter of fact, it has been our purpose since the very start of our company – which was founded exactly 40 years ago, in June 1983. Since then, we have gathered all the building blocks we need to realise our purpose. We have the global scale, the footprint and the passionate people to do so. Moreover, our connections with most of the world’s biggest retailers and with the world’s greatest growers further enhance our potential for success.
We have everything we need to be the driving force in the transition to a healthier future and boost the consumption of fruit and vegetables, which is still well below recommended amounts. Our purpose is to improve life through pure-plant food experiences. We believe in the power of natural products, close-to-crop, bursting with nutrients and in the full glory of their authentic taste, colour and texture. Our pure-plant Gigi Gelato and our collaboration with We’re Smart are just two examples of how we want to bring our vision to life and accelerate the transition. We constantly work on creating new ways and new moments of consumption of fruits and vegetables. For instance by introducing indulgence via guilt free snacking and by educating people on how to prepare pure-plant menus in an easy way, and full of taste.
Join us on our journey!
We would like to take the opportunity to thank all our stakeholders for another strong year and we invite anyone who shares our vision to join us on our exciting journey. In this report, we are happy to take you on a fascinating tour to discover our unique vision and our main accomplishments of the financial year 2022-2023. Together we can further improve life, by unleashing the pure power of plants.
Hein Deprez, Marc Zwaaneveld, co-CEOs Greenyard

/ 9 GREENYARD APPROACH | ENVIRONMENTAL IMPACT | SOCIAL IMPACT | ECONOMIC IMPACT & GOVERNANCE | GREENYARD AT A GLANCE | FINANCIAL REPORT

10 / UNLEASHING THE PURE POWER OF PLANTS
Highlights

/ 11 GREENYARD ANNUAL REPORT 2022/2023
Launch of the internal Around the Yard Newsletter

Greenyard takes it to heart to connect colleagues across the world with each other. Therefore, the internal quarterly magazine was completely revamped to bring the many Greenyard Stories to life, exchange pure-plant recipes, and stay up to date with news from the different departments. A six-weekly digital newsletter now reaches 8 500 colleagues, further cultivating stronger connections among colleagues through a blend of local and global news.
Solid financial results 2021-2022
In its annual report for the financial year 2021-2022, Greenyard announces robust sales growth, further building on a strong foundation set in the previous year. These positive results were driven by Greenyard’s Integrated Customer Relationships, the expansion of convenience offerings, and a solid financial framework.
Validation of science-based sustainability targets
Greenyard’s aim to reduce direct emissions by 70% by 2030, and have suppliers adopt sciencebased targets, were validated by the Science Based Targets initiative aligned with the Paris Climate Agreement’s objective.
Completion of a real estate transaction
Greenyard completed a leaseand-lease-back deal with W.P. Carey Inc. for its Prepared facility in Bree, Belgium. The transaction generated € 89,9m in proceeds, used to voluntarily reduce bank debt.

SEPTEMBER
Refinancing with banking group secured funding stability
Greenyard secured € 420m of refinancing, ensuring stability and growth for the next five years. A syndicate of banks provided senior secured loans to further execute our Strategy 2030. The ambition was also set to quickly convert all ongoing loans to sustainability linked loans.
12 / MESSAGE FROM OUR CO - CEO s | HIGHLIGHTS | GREENYARD’S RELEVANCE | FOOD OF THE FUTURE | PURE POWER OF PLANTS | DRIVEN BY PASSION & PEOPLE 2022 JUNE APRIL JULY
When CDP works in partnership with an organization, for the duration of the partnership or relating to a particular project
To accompany communications to indicate that a company publicly takes part in the CDP process, as a signatory or reporting organization
When an organization buys a service from CDP (eg Reporter Services, Supply Chain membership).
When the business is accredited by CDP to provide services aligned with our mission for the period that they are accredited
To indicate that a company is in the current reporting year’s A List
The logo must never be recreated The full color version must only be applied to white backgrounds A white only version is supplied for use on coloured backgrounds The primary logo features our strapline ‘Disclosure Insight Action’ Please use this version wherever possible
Sustainability Report
To ensure the CDP logo maintain s impact, especially in busy graphic environments, a defined clear space must be maintained around it (please see diagram)
Fruitful participation at Fruit Attraction 2022
Sustainability efforts recognised by CDP

Greenyard published its fifth Sustainability Report. In the report, Greenyard looks back on a year where the company made important progress on its Sustainability Roadmap 2025, and rolled-out an extended sustainability database to measure sustainability efforts across the group.
Always ensure the logo is prominently positioned In situations where it is necessary to feature it at a smaller size, please do not apply it at a width less than 25mm
Changes to the Board of Directors
The Annual General Shareholders’ Meeting approved the renewal of Mr Koen Hoffman’s mandate as the independent Chairman and appointed Mr Gert Bervoets as a new independent director. Also, Director Alychlo NV’s board representation was taken up by Ms Els Degroote. These changes led to a diverse and balanced composition of industry and business leaders on Greenyard’s Board, meeting professional experience, knowledge, and expertise requirements.
Greenyard exhibited at Fruit Attraction with a stand that showcased its Strategy 2030. Fruit Attraction is the international trade show for the fruit and vegetable industry in Madrid and has become a leading commercial tool of connection for food value chain experts from all corners of the world. Greenyard leveraged the occasion to display its role as a global, connecting partner between growers, retailers, and logistical partners.
Greenyard was rewarded with sound CDP scores for its efforts in 2021 to further improve and lower its carbon footprint for a more sustainable food value chain. Greenyard received a B for climate change as well as water security transparency, and a C for forests transparency.

/ 13 GREENYARD APPROACH | ENVIRONMENTAL IMPACT | SOCIAL IMPACT | ECONOMIC IMPACT & GOVERNANCE | GREENYARD AT A GLANCE | FINANCIAL REPORT
OCTOBER
SEPTEMBER
DECEMBER
The CDP logo is available:
October
CDP logo guidelines
JANUARY Sustainability Linked Loans
Greenyard went the extra mile by tying sustainability goals to its ongoing loans. The goals are in line with the ambitions of Greenyard’s Sustainability Roadmap and have been translated into annual targets for the period of the sustainability linked loan. The targets focus on reduction of CO2-emissions, lowering water usage and making sure that 93% of the sourced goods from medium and high-risk countries come from certified growers.
Celebrating 25 Years of BND
The international growers’ association BND, co-founded by Greenyard Prepared, celebrated its 25-year anniversary. With the foundation of BND, Greenyard was a true pioneer in close and integrated relationships with growers. It supports local farmers, within a 100km radius of the site, in every possible aspect of their business. From introducing the latest agricultural practices to reducing the use of energy, water, and plant protection products.
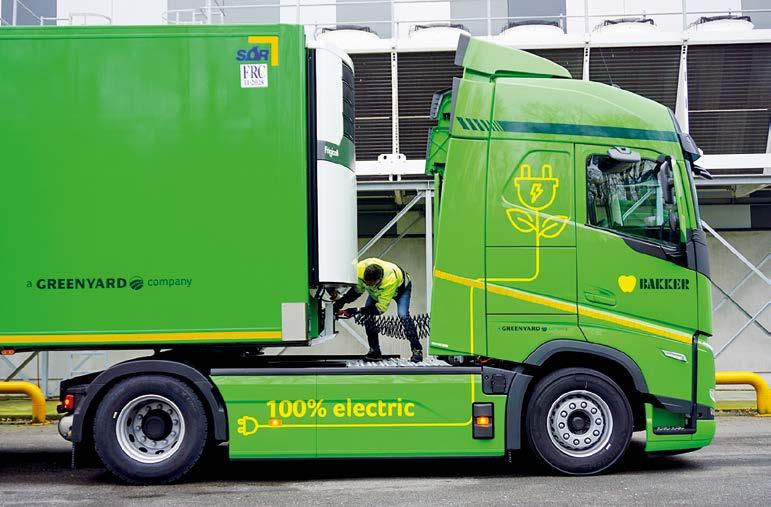
Launch of the first e-truck at Bakker Belgium
Bakker Belgium, a Greenyard company, unveiled the first 100% electric truck in its fleet to deliver fresh fruit and vegetables. The new truck decreases the CO2-emissions of the Bakker Belgium fleet by a significant 11%, while delivering 18 million kilograms of fresh fruit and vegetables every year.
Green Energy for Greenyard Frozen Poland
Greenyard Frozen Poland shifted to a renewable energy contract to power their operations starting from 2023. After The Netherlands they became the second Greenyard entity where all facilities are powered by renewable energy sources, including solar and wind energy. This will further reduce Greenyard’s overall CO2-emissions significantly.

14 / MESSAGE FROM OUR CO - CEO s | HIGHLIGHTS | GREENYARD’S RELEVANCE | FOOD OF THE FUTURE | PURE POWER OF PLANTS | DRIVEN BY PASSION & PEOPLE
Launch of the ‘Intranet’ –an internal connection hub
Greenyard launched a completely new and integrated global intranet. An internal content hub full of Greenyard Stories, connecting colleagues by providing access to local and global company news, HR and communication tools, and an interactive organisational chart. All centralised on a single online platform, exclusively for employees.

Sustainability Award for Greenyard Frozen UK
Greenyard Frozen UK was awarded the title of ‘Environmental Champion’ at the 2023 Kings Lynn Mayor’s Business Awards. A local, sustainability initiative that recognized Greenyard’s exceptional business accomplishments and contributions to the local economy. Whenever feasible, Greenyard is using locally sourced vegetables for convenient and affordable frozen products that at the same time prevent food waste.
Finalised deal with We’re Smart for a five-year partnership
Greenyard rounded up the preparations for a five-year partnership with We’re Smart, the world’s foremost culinary reference for fruit and vegetables. Together they aim to further accelerate the active promotion of sustainable and healthy eating through the pure power of plants, as well as collaborating on pure-plant food innovations for Greenyard’s customers.
/ 15 GREENYARD APPROACH | ENVIRONMENTAL IMPACT | SOCIAL IMPACT | ECONOMIC IMPACT & GOVERNANCE | GREENYARD AT A GLANCE | FINANCIAL REPORT
2023
MARCH

16 / UNLEASHING THE PURE POWER OF PLANTS
Greenyard’s relevance today, and tomorrow

/ 17 GREENYARD ANNUAL REPORT 2022/2023
Clear purpose & ambition
2030
Greenyard is a company with a clear purpose and ambition: we want to improve life through pure-plant food experiences, enabling healthier lifestyles while ensuring more sustainable food supply chains. We do so by being a true connector throughout the entire food value chain. Our Strategy 2030 provides us with a clear roadmap on how we want to realise that ambition.
“Our purpose and strategy are driven by sustainability,” says Florens Slob, Group Sustainability & Innovation Director. “As one of the largest players in the world of fruit and vegetables, we are at the heart of one of the most important global transitions towards a more sustainable future. We see the challenges of climate change, biodiversity loss and a growing world population. At the same time, we see the opportunities of fundamentally changing the way we consume and produce food. A major shift towards more pure-plant food is seen as the only way forward.”
“We have a huge role to play in this shift, along with many others in the chain,” says Dennis Duinslaeger, Group Strategy & Investor Relations Director. “The average consumption of fruit and vegetables is still way below recommended daily amounts. This means we need to make it easier for people to make better and healthier choices – convenience is of the essence in today’s busy world. It is our ambition to develop new and exciting pure-plant food experiences, but always stay true to the natural power of fruit and vegetables.”
For many years, Greenyard operates a unique business model in the world of fruit and vegetables. “Even in our mature market, there are still many gains to be made in the way fruit and vegetables are brought to market,” says Florens Slob. “By connecting growers, retailers and consumers in a seamless and demand-driven supply chain, we are able to improve efficiency and reduce waste in every step. So, not only is our product more sustainable, our unique business model and the way we operate also directly contributes to a healthier life for all. And as time moves on, we clearly see a growing appetite among both growers and retailers for our way of working and our customer base continues to grow.”

18 / MESSAGE FROM OUR CO - CEO s | HIGHLIGHTS | GREENYARD’S RELEVANCE | FOOD OF THE FUTURE | PURE POWER OF PLANTS | DRIVEN BY PASSION & PEOPLE
The pure power of plants: an integral part of Greenyard’s Strategy
FLORENS SLOB
A major shift towards more pure-plant food is seen as the only way forward.”
Florens Slob, Group Sustainability & Innovation Director
“Finally, all of these things would not be possible without the knowledge and passion of our people,” says Dennis Duinslaeger. “We have around 8 500 people working for Greenyard around the world. They are the true driving force behind our company. Delivering the best-quality fruit and vegetables for our customers on a daily basis and building strong relationships with everyone in the chain is essentially a people’s business. We need to be there to support them in every step along the way.”


/ 19 GREENYARD APPROACH | ENVIRONMENTAL IMPACT | SOCIAL IMPACT | ECONOMIC IMPACT & GOVERNANCE | GREENYARD AT A GLANCE | FINANCIAL REPORT
Even in our mature market, there are still many gains to be made in the way fruit and vegetables are brought to market.”
Dennis Duinslaeger, Group Strategy & Investor Relations Director
DENNIS DUINSLAEGER
Strategy 2030
Our strategy in a nutshell: nine Greenyard-themes
Sustainability
Fruit and vegetables – our core products – are the cornerstone of a sustainable food system that operates within planetary boundaries. We team-up with our strong global network of growers, bundling volumes and establishing longterm commitments. We continuously work towards improvements on the ecological aspects in agriculture while working towards 100% compliance on social aspects.
Improving health

Food will once again become the starting point for a healthy lifestyle. To provide this for everyone around the world, we do our part to increase the consumption of fruit and vegetables.
The pure power of plants
Fruit and vegetables – the plants themselves – are our core products, in all their pure and natural power. We are growing the market for pure-plant, close-to-crop products in the fresh, frozen and prepared category. It is what we do today, what we have been doing for 40 years, and how we will continue to make the difference in the years to come, as we continue to innovate for a healthier future.
Innovation
Ever since we started, we have found new ways of improving life through fruit and vegetables. We are continuously accelerating our innovation journey. With a clear focus on developing new, pure-plant food experiences that are convenient for the consumer, and by teaming up with specialised partners, scale-ups and start-ups. In this, sharing data and the smart use of technology are key drivers for Greenyard’s growth.
THE PURE POWER OF PLANTS
20 / MESSAGE FROM OUR CO - CEO s | HIGHLIGHTS | GREENYARD’S RELEVANCE | FOOD OF THE FUTURE | PURE POWER OF PLANTS | DRIVEN BY PASSION & PEOPLE
SUSTAINABILITY
IMPROVING HEALTH
INNOVATION
Strategy 2030
CONVENIENCE
Convenience
People look for healthier but at the same time convenient food. It’s our job to make that choice easier for them and grow the market for convenience in pureplant nutrition. Our aim is to help people increase their daily intake of fruit and vegetables – whenever they want it, how they want it and where they want it.

Human Culture
We are passionate about what we do. We honour the heritage that laid the foundations for Greenyard and serves as guidance for our future. Entrepreneurship and a forward-thinking approach remain an important part of our success. We embrace openness, where all colleagues feel safe and respected. We stand for a positive environment, a safe haven, where everyone can flourish.
INTEGRATED COLLABORATION
Integrated collaboration
Our products are unique, and we are experts in delivering them all year round and all over the world. For this, we build on our long standing and strong relations with a great network of growers. We work with the largest retailers, in a fully adapted way. We offer high quality products, and high value services such as: ripening, quality control, innovation, logistics and advice on the full supply chain and the best assortment.
HIGH PERFORMANCE
High Performance
Everything we do, starts with our purpose to improve life. We permanently seek improvements throughout the value chain, from grower to retailer and from Fork-to-Field. Getting better every day is what drives us.
Global player
We have built an exceptional and global network of growers and are working with world’s largest retailers to provide consumers with tasty, healthy and sustainable food solutions, all year round.
/ 21 GREENYARD APPROACH | ENVIRONMENTAL IMPACT | SOCIAL IMPACT | ECONOMIC IMPACT & GOVERNANCE | GREENYARD AT A GLANCE | FINANCIAL REPORT
HUMAN CULTURE
GLOBAL PLAYER

22 / UNLEASHING THE PURE POWER OF PLANTS
Food of the future: the role of fruit & vegetables for people & planet

/ 23 GREENYARD ANNUAL REPORT 2022/2023
Foodvalley was established in 2004 as a not-for-profit organisation, closely linked to the buzzing innovation ecosystem in Wageningen, the Netherlands. “Today, we have a network of more than 600 partners, from start-ups to multinationals, and we’re still growing strongly,” says Marjolein Brasz. “As the effects of climate change are being felt close to home – just think of the floods last year in Belgium and the Netherlands or the annual forest fires in Southern Europe –there’s clearly a growing sense of urgency among citizens, politicians and business leaders.” Greenyard has been a network partner since 2022. A perfect match, since our vision of low-processed, close-tocrop, pure-plant food is fully in line with the vision of Foodvalley.

Transitions are never easy
“By 2050, we will have close to 10 billion mouths to feed. Our current practices in food production and consumption are simply not fit to provide every one of them with healthy food without depleting resources. Pretty much everyone agrees we need a large-scale transition to more pure-plant foods in our daily diets.

However, a transition of this magnitude cannot be done overnight and requires close collaboration across the entire food chain. “It’s not just the consumer that needs to change, it’s not just the industry, it’s not just the government. It’s all of us at the same time, in a concerted effort. Moreover, there’s always something else that holds our day-to-day attention – the COVID pandemic, the war in Ukraine, rising inflation, volatile energy prices, a tight labour market. That’s where we come in. As a practice leader and dedicated organisation, Foodvalley can bring the right partners around the table
to work on systemic changes and develop projects that can make a real difference.”
Switch to more sustainable protein sources
Foodvalley focuses its efforts on three central themes: Protein Transition, Food & Health and Circular Agrifood. The first theme involves shifting towards more sustainable protein sources. Today, about 60% of the proteins we consume originate from animals, with only 40% coming from plants. We need to –
24 / MESSAGE FROM OUR CO - CEO s | HIGHLIGHTS | GREENYARD’S RELEVANCE | FOOD OF THE FUTURE | PURE POWER OF PLANTS | DRIVEN BY PASSION & PEOPLE
MARJOLEIN BRASZ
The transition to pure-plant diets is the only way forward
at least – inverse that ratio as soon as possible. The consumption of animal-based proteins needs to be reduced drastically.
“There is a clear need to invest in knowledge, technology and facilities in order to produce higher-quality ingredients and stimulate the production of plant-based proteins, preferably as local as possible. In Europe, growers of beans and pulses have almost disappeared. We need to bring them back by offering them support, both economically, technically and in the long-term” says Marjolein Brasz. Within this respect,
global leaders in pure-plant foods like Greenyard are essential. Additionally, it is good to see how they closely work together with their partners throughout the value chain. It is important if we are to be successful in this much needed transition.
Making it easier to make the healthy choice

Moving towards a diet that is dominated by fruit and vegetables will not only reduce the climate impact of our food production systems, it
will also give a much needed boost to public health, as we see a worldwide increase in obesity and other diet-related diseases. “About 15% of consumers is already actively pursuing a healthier and plant-based lifestyle. They are willing to spend the time and make the effort that is needed. But to reach the wider population, we still have a long way to go if we want to make the healthy choice the easy choice. Whereas snacks that are high in sugar, fat and salt are literally everywhere, healthy alternatives are much harder to find. For those consumers you need to make it as easy as possible”.
“Many food companies and retailers are already doing their part, but with our Food Boost Challenge, we decided to take a bottom-up approach. We challenged a group of youngsters, to come up with their own ideas for new and healthier food concepts. Together with students, they got to refine their concepts further, from research to concept development and prototyping. It was great to see the amazing ideas they generated, from trendy fruit-bars and smoothies to vending machines for healthy food.”
/ 25 GREENYARD APPROACH | ENVIRONMENTAL IMPACT | SOCIAL IMPACT | ECONOMIC IMPACT & GOVERNANCE | GREENYARD AT A GLANCE | FINANCIAL REPORT
Pretty much everyone agrees that a transition to more plant-based diets is the only forward. Which is easier said than done, so we all need to work together to achieve this.”
Marjolein Brasz, CEO of Foodvalley
A circular approach to food waste


Changing our eating habits is one thing, but there’s still a lot we need to do in the way we produce food. About one third of all the food goes to waste at some point in the chain – on the fields, during production and transport, in restaurants and at people’s homes. It is estimated that food waste on its own accounts for about 8% of global emissions caused by humans.
“Prevention is always the first step, but we also need to find ways to repurpose these residual streams.
We need to look at them not as an end-product but as the starting point, a new resource that can be used in other processes or even across different sectors. Brewer’s spent grain, a by-product from beer production, is a great example of this. Its high protein and fibre content makes it an obvious ingredient for other food products such as bread. The same goes for Greenyard. Not only in their business operating model do they reduce waste to a minimum; the company is also taking important steps in further optimising the by-product stream – internally and with external partners.”
“In the end, it’s all about working together, removing barriers and creating new business models,” says Marjolein Brasz. “No company can do this alone. It’s also important to realise that this transition is not going to be a straight journey – there needs to be room for trial-and-error. But the direction is clear, and we are seeing our ecosystem grow day by day. With a good explanation on “why” we have to do this and solutions that support consumers in this transition. If we want it, the healthier future is just around the corner, and fruit and vegetables will show us the way for sure.”
26 / MESSAGE FROM OUR CO - CEO s | HIGHLIGHTS | GREENYARD’S RELEVANCE | FOOD OF THE FUTURE | PURE POWER OF PLANTS | DRIVEN BY PASSION & PEOPLE
Fruit & vegetables: for a healthier and sustainable future
Feeding a growing world population
The world population will continue to grow significantly in the decades to come. Even though some of the latest predictions indicate impeding growth and there may even be a tipping point on the horizon, it is clear that our current food system cannot provide everyone with sufficient food in a sustainable manner. Transitioning to pure-plant diets will be a major part of the solution, as crops in all shapes and sizes can be grown using much less space and natural resources than any other food category.
The fight against climate change
Climate change is without a doubt one of the biggest challenges of our generation. It may even be the biggest challenge humankind has ever faced, as it threatens the very planet we live on. With the food industry as a whole accounting for about one third of global CO2-emissions, it is important to make sustainable choices when answering the everyday question “what’s for dinner?”. Fruit and vegetables play a crucial role to combat climate change as they have a relatively limited climate impact – using much less energy, water and natural resources than practically every other food category. But that does not exclude us from taking responsibility and further reducing waste and emissions within our business model.
Enabling the shift to healthier food patterns
Progression in production techniques and economies of scale have made sure food is available in abundance in large parts of the world. But today’s food markets are too focused on highly processed foods, rich in calories, which have led to an increase in obesity and diet-related diseases. With the global, daily consumption of fruit and vegetables still well below the recommended amounts, there is plenty of room for improvement, and ample opportunities to help people shift towards healthier food patterns.
/ 27 GREENYARD APPROACH | ENVIRONMENTAL IMPACT | SOCIAL IMPACT | ECONOMIC IMPACT & GOVERNANCE | GREENYARD AT A GLANCE | FINANCIAL REPORT

28 / UNLEASHING THE PURE POWER OF PLANTS
The pure power of plants as part of the solution

/ 29 GREENYARD ANNUAL REPORT 2022/2023
As The Vegetables Chef®, Frank Fol has always put fruit and vegetables at the centre of his cuisine. “When I was advocating this thirty years ago, people were still looking at me as if this was farfetched and revolutionary. But since then, we have witnessed a structural change in our eating habits. And I firmly believe, this is not a hype that is likely to fade in a few years.”

Frank’s passion for fruit and vegetables started when he was young, growing up in a region that is quite well-known for the cultivation of strawberries, cauliflower and chicory. “When I became a chef, it was only natural to give these great local products the leading role in my menus, with meat and fish relegated to a side role.” Today, Frank is the owner of We’re Smart, a world-wide organisation that inspires chefs, food companies and consumers at home to put fruit and vegetables at the centre of their plates.
FRANK FOL
A cultural transition
“Today, it’s becoming increasingly clear that this is not just some food hype, like molecular or fusion cuisine,” says Frank Fol. “It’s a cultural transition, with everyone moving in the same direction. Moreover, it’s an absolute necessity, both for our planet and for our health. Eating more fruit and vegetables enables us to reduce our carbon footprint and at the same time counter the proliferation of diet-related diseases.”
“We are past the tipping point and we’re not going back,” agrees Cedric Pauwels, Group Communications & Public Affairs Director. “More and more people are discovering the joys of pure-plant food, powerful and highly nutritious, with closeto-crop fruit and vegetables as the headliners. Many of the latest food trends have been about eating less –less carbs, less sugar, less fat. But we think it really should be about eating more, but more of the good things. More pure-plant foods.”

30 / MESSAGE FROM OUR CO - CEO s | HIGHLIGHTS | GREENYARD’S RELEVANCE | FOOD OF THE FUTURE | PURE POWER OF PLANTS | DRIVEN BY PASSION & PEOPLE
Why fruit and vegetables should play the starring role on your plate
Into the aisles of the supermarket
In March 2023, We’re Smart and Greenyard signed off on a a fiveyear collaboration which will involve a series of initiatives to stimulate the consumption of fruit and vegetables. We’re Smart will provide its expertise and access to its global network of pure-plant food experts to jointly develop new products for Greenyard’s customers that meet the needs of modern consumers –easy to prepare, convenient, great quality and great taste.

CEDRIC PAUWELS
“It’s clear we share the same DNA and the same ambition,” says Frank Fol. “From our end, we have been focusing on chefs and gastronomy to prove to the world it can be done. They can set the example and inspire others. Teaming up with Greenyard gives us the opportunity to work on the consumer side of things and introduce innovative and affordable pure-plant alternatives to a much wider audience.”
Straight from the field
Frank Fol also sees an important role for frozen and prepared fruit and vegetables. “I think their power and their quality are still hugely underestimated by today’s consumers. The produce is frozen or canned within hours of harvesting, actually making them super fresh. It’s like having them served straight from the field on your plate.”
“They also provide people with many other benefits,” says Cedric Pauwels. “You can enjoy a much wider range of fruit and vegetables throughout the year, regardless of the season. And they reduce waste –you only take the exact amount you need for the meal you’re preparing, everything else simply goes back into the freezer.”
“In the end, it’s all about helping people discover the immense variety of what nature has to offer,” says Frank Fol. “Most people – even trained chefs – only know five or six ways to prepare vegetables. There is still so much to discover! It’s up to us to prove it can be done. Believe me, we will not change the world if it does not taste great.”

/ 31 GREENYARD APPROACH | ENVIRONMENTAL IMPACT | SOCIAL IMPACT | ECONOMIC IMPACT & GOVERNANCE | GREENYARD AT A GLANCE | FINANCIAL REPORT
More and more people are discovering the joys of pure-plant food. They are powerful and highly nutritious, with close-to-crop fruit and vegetables as the headliners.”
Cedric Pauwels, Group Communications & Public Affairs Director
Stimulating innovation at every level
Innovation is key in Greenyard’s Strategy 2030 to become a pureplant food powerhouse. By offering new food experiences, we help people rediscover the benefits of fruit and vegetables, as we redefine what healthy food looks and tastes like. Technology, especially data, is crucial for creating a sustainable chain behind our daily diets. It improves quality control, reduces waste, and aligns supply with demand.
In the financial year 2022-2023, Greenyard established a dedicated team at Group level to support and stimulate innovation in every layer of the company and across all divisions. “Anyone within Greenyard can come up with good ideas,” says Sylvain Mermod, recently appointed Group Innovation Manager. “But within the constraints of the daily operations, it’s not always easy to find the means and the time to bring these ideas to fruition. That is why we created a structure where we can keep track of these ideas and determine how they can be transformed into real-life, commercially viable products and processes.”
Increasing healthy, pure-plant food consumption through innovation

Tapping into future trends
“This does not mean we’re new to the innovation game,” continues Sylvain Mermod. “On the contrary, we are introducing hundreds of new recipes and products every year, mostly at the request of customers. But it’s important to also look beyond these recurring requests and find the time and space to think about new food concepts and new food experiences that tap into new consumer trends. To remain relevant in the future, we need to innovate for the market and future consumer needs. We drive the change. At the same time, it will always be important that our customers also get behind our ideas. We need to do this together with them.”
Some of these innovations may take a while to find their place in the market. “Consumer trends tend to take unexpected turns,” says Merel Noorts, Sustainability and Innovation Coordinator for Greenyard Fresh Belgium. “Last year, we noticed consumers going back-to-basics with a renewed interest in comfort food and traditional meals like soups, stews and mashes. This shows that consumers may need some time to get used to certain new products. Being a private label company, gives
us the flexibility to stop and relaunch products because sometimes, you just need to try more than once. Be persistent if you know you’re on the right track. For example, we saw our cauliflower rice finally taking a definitive place in the shelves last year. So it’s really all about patience and trusting your vision.
Sharing knowledge and leveraging our footprint
Looking at innovation at a Group level also allows us to share our expertise and leverage the footprint that we have as a company. It’s one of our strategic focus areas to prioritise digitalisation and use all available data to drive innovation and enhance our services. Therefore, we allocate resources and collaborate with disruptive companies to support controlled growth. “This is especially important when it comes to developing and selecting the right technologies to improve the efficiency within our supply chain. The forecasting tools we need within our Integrated Customer Relationships (ICR) model to better match supply with actual demand are a good example of this. The same goes for preventing food waste, by repur-
32 / MESSAGE FROM OUR CO - CEO s | HIGHLIGHTS | GREENYARD’S RELEVANCE | FOOD OF THE FUTURE | PURE POWER OF PLANTS | DRIVEN BY PASSION & PEOPLE
MEREL NOORTS
posing by-product like the peels or cut-offs that we have in our fresh convenience, frozen and prepared business. Because we have a good overview of our divisions at Group level, it is much easier to see how they can be used in existing Greenyard-products or even turned into completely new products.”
Finally, we are also looking outside of Greenyard for inspiration. “We are open to collaborations with
other innovative companies in our sector and actively participate in international research projects,” says Sylvain Mermod. “Our recent acquisition of Gigi Gelato is another good example of how we can speed up things through open innovation. By using our access to European retailers, we can maximise the distribution of a ground-breaking, pure-plant gelato to a much wider audience. It shows that we can offer promising start-ups and scale-ups

in pure-plant food a great opportunity. Not just connecting them to large retailers, but also to resilient resources coming from our dedicated growers and our own strong platform. In the end, it’s all about turning our vision for a healthier and more sustainable future into reality.”

/ 33 GREENYARD APPROACH | ENVIRONMENTAL IMPACT | SOCIAL IMPACT | ECONOMIC IMPACT & GOVERNANCE | GREENYARD AT A GLANCE | FINANCIAL REPORT
SYLVAIN MERMOD
We are open to collaborations with other innovative companies in our sector and actively participate in international research projects.”
Sylvain Mermod, Group Innovation Manager
Increasing fruit & vegetable consumption by winning the hearts & minds of consumers
We believe in the pure power of plants as the key to healthier lives and a more sustainable way of feeding the world. But to win the hearts and minds of consumers, we need to make fruit and vegetables as affordable, accessible and attractive for as much people as we possibly can.
Affordable
First of all, we believe the many benefits of fruit and vegetables should be affordable for everyone. By connecting growers, retailers and consumers we are improving efficiency and reducing waste in every link of the chain. Despite rising inflation, fruit and vegetables have not yet seen the same price increases we have witnessed in many other food categories. At the same time, we need to ensure a fair compensation for the growers who put in all the hard work to bring them to our table.
Attractive
Nature offers us a wealth of pureplant power, with an incredible diversity in taste, colour and texture. More and more people are starting to re-discover and appreciate the culinary pleasure fresh, frozen or prepared produce can bring. By using our product expertise to create new food experiences, we want to open up even more possibilities for people to enjoy fruit and vegetables.
Accessible
Fruit and vegetables are available in a wide range of varieties. We want to bring as much of those to consumers as we can – in an easy, tasty and convenient manner, freshly available at any supermarket, every day of the week. But we also develop new ways to help make fruit and vegetables fit into our busy lifestyles – convenient, easy to prepare and suitable for every moment, from early morning to late at night.
34 / MESSAGE FROM OUR CO - CEO s | HIGHLIGHTS | GREENYARD’S RELEVANCE | FOOD OF THE FUTURE | PURE POWER OF PLANTS | DRIVEN BY PASSION & PEOPLE
Appetite for innovation
In the financial year 2022-2023, Greenyard Frozen continued the expansion of its convenience range. “Despite challenging market circumstances, we have once again achieved double-digit growth. What’s more, is that we are seeing a renewed appetite for innovation in the retail market,” says Valentijn Verhaeghe , Business Unit Manager Convenience for the Frozen division.

“Convenience is an essential element in our strategy to stimulate the consumption of fruit and vegetables. More than ever, people are looking for healthy food solutions that fit their busy lifestyles. Our convenience products may take on many forms: from frozen (ready-to-use) soups and lightly seasoned vegetables to our veggie meals with quinoa and bulgur. And yet, they are all products that are close-to-crop, with a natural texture and the taste of freshly harvested fruit and vegetables.”

“We cooperate closely with our retail customers to boost our convenience range. We have developed clear-cut promotions around the big holiday
periods and as part of culinary theme weeks. The good news is that we are able to offer these new products at competitive prices. As a private label producer, we are clearly on the right side of inflation, as consumers turn to the value-for-money offering of retailer brands. Moreover, frozen fruit and vegetables present an affordable food option as they are easily portioned, which also reduces waste.”
“Since November, we are seeing a renewed appetite for our innovative products and concepts in the market. The past few years, retailers were very much occupied with supply chain challenges and rising costs. They didn’t have as much time for innovation as they would like. Now, customers have found their way to our tasting and development sessions, and we have been launching a steady stream of new products, including grain mixes with pulses and vegetables and the oriental variants of our cauliflower rice. It’s great to see our customers taking an active interest in what we are doing. I’m sure this will help us to lift our convenience range to the next level in the coming years.”
/ 35 GREENYARD APPROACH | ENVIRONMENTAL IMPACT | SOCIAL IMPACT | ECONOMIC IMPACT & GOVERNANCE | GREENYARD AT A GLANCE | FINANCIAL REPORT
CONVENIENCE RANGE
Time for a healthy pleasure!
With the acquisition of the start-up Gigi Gelato, Greenyard is adding a real game-changer to its ever-expanding range of products that unleash the true power of plants. “It’s another major step in our ambition to market innovative and convenient products that stimulate the consumption of fruit and vegetables,” says Kobe Vanhaecke, Commercial Director of Greenyard Frozen Belgium.

Pure-plant innovation
Gigi Gelato was created by the Italian food technologist Luigi Graziosi in collaboration with two entrepreneurs Zeno Tosoni and Ralph Barkmeijer.

“It was their dream to take the Italian gelato tradition and values to a whole new level and develop a healthy, vegan alternative, based on fruit and vegetables,” says Kobe Vanhaecke. “Gigi Gelato does not use any dairy, nor does it use artificial flavours, additives or aromas to create a whole new pure-plant food experience, with the same creamy, sorbet bite as traditional gelato, but it is low in fat, high in fibre and doesn't have a single sense of guilt afterwards.”
Taking its inspiration from the latest trends in food pairing, Gigi Gelato is currently available in three amazing combinations: there’s strawberry, blueberry and beetroot, there’s mango, passion fruit and fennel, and there’s ginger, orange and carrot. “Fruit-flavoured ice cream is nothing new of course, but it’s the addition of vegetables, the pure-plant formula and the creamy bite that makes Gigi Gelato a real game-changer in the frozen snack category,” says Kobe Vanhaecke.
36 / MESSAGE FROM OUR CO - CEO s | HIGHLIGHTS | GREENYARD’S RELEVANCE | FOOD OF THE FUTURE | PURE POWER OF PLANTS | DRIVEN BY PASSION & PEOPLE
GIGI GELATO
A perfect match
Gigi Gelato has been available in limited quantities in several supermarkets across Europe. As part of its Frozen-offering, Greenyard can now offer much wider market access for this ground-breaking innovation. “It’s really the perfect match, as we share the same vision for healthy, convenient products which are purely powered by plants,” says Kobe Vanhaecke. “We are confident Gigi Gelato will be an important contender for the dominant players in this category. Moreover, the original Gigi-team remains on board for the further development of the range, and to share ideas and knowledge with our team of expert product developers.” So surely, the best is yet to come!

Convenient, vegan assortment in perfect harmony with our pure-plant vision
More and more consumers are becoming familiar with the concept vegan food, and as a bonus it comes with the complementary benefits for both our health and the environment. Consequently, the demand for vegan products is experiencing a rapid growth. In line with this trend, Greenyard Prepared in Belgium has developed a new line of pure-plant products that aligns perfectly with this vision.
The new range comprises of four vegan soups and eight vegan pasta sauces, available in the most popular variations. The soups are conveniently packaged in stand-up pouches. Greenyard Prepared showcased their new product line at last year’s PLMA fair in Amsterdam, receiving enthusiastic reviews. They are now working towards the launch of their latest range.

/ 37 GREENYARD APPROACH | ENVIRONMENTAL IMPACT | SOCIAL IMPACT | ECONOMIC IMPACT & GOVERNANCE | GREENYARD AT A GLANCE | FINANCIAL REPORT
Integrated Customer Relationships (ICR)

Making our customers stand out from the crowd
In the financial year 2022-2023, Greenyard further developed and strengthened its Integrated Customer Relationships with major European retailers. We spoke to Charles-Henri Deprez, Managing Director of Greenyard Fresh, and Philip Ditchfield, Supply Chain Expert at Greenyard Fresh. “In times of inflation and product shortages, our unique business model has once again proven its value.”
With its Integrated Customer Relationship (ICR) model, Greenyard has been pioneering a truly unique business model in the world of fruit and vegetables. The basic idea behind ICR is to fully unburden retailers in the fruit and vegetables category by creating a transparent end-toend chain that increases quality and ensures availability. This holistic approach also allows parties to take significant costs out of the chain. Greenyard offers a complete range of products, all year round, and fully in line with each retailer’s brand positioning. Depending on the retailers’ specific needs, we can draw up an entire menu of added-value services, including logistics, packaging, ripening services and direct-to-store deliveries.
The advantages for retailers are clear. “We remove the retailers’ insecurity and volatility of supply and we provide them with a direct connection to our global network of growers,” says Charles-Henri Deprez. “But most of all, through our product knowledge and our expertise, we enable them to really stand out from their competitors in one of the most important categories for today’s consumers.”

Unique in the world of fruit and vegetables
Philip Ditchfield, who has worked in the field of supply chain management for many years before he joined Greenyard, sees several parallels with what is happening in other sectors. “There is a clear and established trend in many industries to move away from merely negotiating prices to building integrated partnerships, where suppliers and customers join forces to optimise their value chain. But our ICR model is still truly unique in the context of fruit and vegetables.”
38 / MESSAGE FROM OUR CO - CEO s | HIGHLIGHTS | GREENYARD’S RELEVANCE | FOOD OF THE FUTURE | PURE POWER OF PLANTS | DRIVEN BY PASSION & PEOPLE
CHARLES-HENRI DEPREZ
PHILIP DITCHFIELD
“In our industry, there are many very good and savvy negotiators, on both sides of the chain,” he continues. “But if we’re honest, there really is not that much margin to play with when it comes to fresh fruit and vegetables. Working together to reduce non-adding value costs in the chain is a no-brainer, as it allows everyone to benefit.”
Starting from the demand side
Greenyard has been advocating a demand-driven model to improve efficiency and reduce waste in the supply chains for fruit and vegetables for many years. “It requires transparency and an openness to share information that negotiating parties in a transactional model would never share,” says Charles-Henri Deprez. “The planning of promotions is a good example of this. It’s no use doing a promo for cauliflower when supply is low and prices are high. That may sound like common sense, but retailers very often look at fruit and vegetables like they were industrial products which they are clearly not.”

This demand-driven approach also has a beneficial effect on the quality of the products that end up in the shelves. “We are working with fresh products that have a limited shelf-life – as soon as they are harvested, time is of the essence,” explains Philip Ditchfield. “You cannot stock fresh tomatoes for weeks in a warehouse as you can with toilet paper. Close collaboration is essential to create an accurate forecasting which in turn allows the retailer to put the products in the shelves when they are at their freshest, which is essential to provide the best consumer experience. I think this is also one of the reasons why we see that many of our customers who engage in our ICRmodel outperform the market.”
What if the product isn’t there tomorrow?
Charles-Henri Deprez points to another factor that is increasing awareness from the retail side. “In the first months of 2023, we have seen severe shortages in the market for cauliflower, peppers and several other vegetables because of bad weather conditions in southern Europe,” he explains. “As many retailers were struggling to fill their shelves, it made them realise – maybe for the first time in decades – that there might be a possibility that the product will not be there.”
Greenyard was able to counter these shortages thanks to the unique position we have created over the past 40 years. “Firstly, there’s our global scale. We closely work with growers around the globe, which enables us to be agile and swiftly shift regions to secure produce. We are not dependant on one or two regions. This, combined with our commitment to invest in long-term relationships with our growers, allowed us to secure produce for our customers, even when times got tough.”

/ 39 GREENYARD APPROACH | ENVIRONMENTAL IMPACT | SOCIAL IMPACT | ECONOMIC IMPACT & GOVERNANCE | GREENYARD AT A GLANCE | FINANCIAL REPORT
There is a clear and established trend to move away from merely negotiating prices to building integrated partnerships.”
Philip Ditchfield, Supply Chain Expert
The market is waking up
Meanwhile, Greenyard’s ICR model is clearly gaining traction in the market, leading to a growth in inquiries and interest from retailers, including discounters and other industry players. Early 2023, the German retailer Dohle Trading Group – the group behind the German HIT supermarkets – chose to enter an ICR-model with Greenyard Fresh Germany. “We are now the single supply chain partner in the fruit and vegetables category for over 100 of the retailer’s stores in Germany. The new partnership will not only remove the complexity in their supply chains but will also further reinforce their strong brand in the German market,” says Charles-Henri Deprez.
Looking from a historical perspective, many retailers have grown out of purchasing organisations that combine the spending power of different stores to get better conditions from suppliers. Today, the world is changing. “Forward-looking retailers realise that they are not just competing with other brick-and-mortar retailers but also with online stores – companies that are extremely customer-focused. The future is with retailers who focus all their assets on the consumer and leave the supply side of things in the hands of trusted full assortment experts, who can unburden them in every aspect,” concludes Charles-Henri Deprez.

40 / MESSAGE FROM OUR CO - CEO s | HIGHLIGHTS | GREENYARD’S RELEVANCE | FOOD OF THE FUTURE | PURE POWER OF PLANTS | DRIVEN BY PASSION & PEOPLE
Digitalisation of compliance checks
In the ever-evolving landscape of the agricultural industry, staying ahead of the game requires a seamless integration of customer relationships with efficient supply chain management. As a connecting partner, Greenyard wants to unburden its customers by establishing direct connections to the field and ensuring a consistent delivery of high-quality products from compliant growers.

As part of our sustainability strategy, we require our growers to adopt good agricultural practices and obtain the necessary certifications, such as GlobalG.A.P. and Farm Sustainability Assessment (FSA). However, keeping track of the certification status for thousands of suppliers is a considerable challenge. That’s why we have decided to implement the Agriplace software across eight of our entities in 2023,” says Judith Prang , Business Process Owner at Greenyard.
“The Agriplace platform was specifically developed for the agricultural sector and helps sellers

and buyers within the food supply chain to easily exchange information with regard to quality, sustainability and social requirements. The platform will allow us to gain better insight into our supplier base and save time collecting and reporting the right information. As some growers supply to multiple entities within our group, this creates a valuable opportunity for quick efficiency gains in our overall operations. Agriplace also provides direct access to the GlobalG.A.P. and FSA databases for easy reference and verification.”
“Eight of our Fresh-entities, in Belgium, France, Germany, Austria, Italy, Spain and The Netherlands, are currently in the process of uploading their data to the software. In the next phase, we will be making a direct connection to our systems. When drawing up an order, the supplier status will then be easily verified, so our buyer can go ahead with the order, safe in the knowledge that the supplier has the right credentials.”
/ 41 GREENYARD APPROACH | ENVIRONMENTAL IMPACT | SOCIAL IMPACT | ECONOMIC IMPACT & GOVERNANCE | GREENYARD AT A GLANCE | FINANCIAL REPORT
AGRICULTURAL PRACTICES
PERFORMANCE
A data-driven approach to citrus quality

“In 2021, Bakker Barendrecht installed its first fully automated line for sorting and packing citrus fruits. A highly advanced technology, that resulted in major quality and efficiency improvements. Based on the successful roll-out and our positive experiences in the last year, we have recently implemented the same high-tech scanning technique on all citrus lines, making a total of six fully automated installations,” says Marijke Wiggers , Operations Manager at Bakker Barendrecht.
“The high-tech citrus lines automate the entire process from quality control- to packaging for our citrus fruits, including lemons, limes, oranges, grapefruits, mandarins and clementines. The fruits go through a sequence of advanced scanning techniques, including near-infrared spectroscopy

and cameras, to meticulously check quality, both on the outside – size, colour and texture – and the inside. At the end of the line, the fruits are packed in cases and nets, ready for distribution to our customer.”
“These processes give us real-time insight into the quality of every single piece of citrus that passes our system. They provide us with a massive amount of valuable data which we can correlate with the origin of the fruits, the harvesting time, transport conditions and weather circumstances. This allows us to provide our growers with accurate feedback and make significant improvements in our entire supply chain. An entirely closed feedback loop, as we jointly strive for the highest possible quality products in fresh citrus.”
42 / MESSAGE FROM OUR CO - CEO s | HIGHLIGHTS | GREENYARD’S RELEVANCE | FOOD OF THE FUTURE | PURE POWER OF PLANTS | DRIVEN BY PASSION & PEOPLE
An electrifying collaboration for more sustainable produce transport
Bakker Belgium, a Greenyard company, and an important Belgian retailer have partnered to introduce an all-electric truck for transporting fresh produce.

The new e-truck will deliver 18 million kilograms of fresh fruits and vegetables annually to the retailer's distribution centre in Belgium, saving 58 tonnes of CO2-emissions each year. Both companies are prioritizing CO2-reduction in their sustainability strategies, with Greenyard aiming for a 50% reduction by 2025 and 70% by 2030.
The e-truck will cover nearly 90 000 kilometres per year, making use of on-site charging infrastructure that is powered by green energy and is connected to solar panels on our own roof. This close collaboration demonstrates their shared commitment to reduce CO2-emissions in the food supply chain.
/ 43 GREENYARD APPROACH | ENVIRONMENTAL IMPACT | SOCIAL IMPACT | ECONOMIC IMPACT & GOVERNANCE | GREENYARD AT A GLANCE | FINANCIAL REPORT
GESA KIP
Integrated Grower Relationships (IGR)
Bridging the gap between growers and the market
Greenyard has been building long-term relationships with a wide network of growers for the last 40 years. We source directly from both local growers, who are working close to our European markets, and growers on the other side of the world. This global network enables us to provide our customers with a steady and stable supply of the best-quality fruit and vegetables, all year round. Our close and integrated grower relationships may take on many forms and may include guaranteed volumes, contract-growing and even joint ventures. But it’s about more than just volumes and conditions. We also support our growers in their daily operations and help them explore new and more efficient agricultural techniques and practices, ensuring their business remains sustainable in the long run, both from an economical and an ecological perspective.
A Fork-to-Field approach
“An integrated chain of collaboration is crucial when you’re sourcing products of nature,” explains Jens Gabriel, Group Sourcing Director at Greenyard. “Just think about it – it takes about nine months for a pineapple to grow into the delicacy that we know and love, but retailers are ordering it about three weeks before they need it on their shelves. This makes forecasting and planning – from Fork-to-Field – so important. The better we can predict demand, the better we can steer growers in the right direction.”
“Moreover, we operate in a business with delicate and perishable products,” he continues. “When something goes wrong, someone somewhere along the chain is bound to be impacted. It means we have an enormous responsibility to find the right balance between the demand in the
market and what nature is providing. It means we need to hold our end of the bargain as well. When we plan the fruit together with the growers, afterwards we can’t just say we don’t need them, and ask the grower to sell them to someone else. We need to find ways to absorb them in the market. The fact that we supply the largest retailers around, and our Frozen and Prepared divisions come into play here as well.”
Gesa Kip, Specialist Quality Assurance for Greenyard

Fresh Germany, raises another crucial aspect – the planning of promotions. “Retailers have their own planning. However, when working with a natural, perishable product, they need to promote them at the right time to allow all of the product, that is prime quality at that time, to access the market. It is our responsibility to make retailers aware of the intricacies of growing produce, and use our first-hand knowledge, straight from the field, to guide them in the right direction.”
months growth time
for a pineapple to grow into the delicacy that we know and love
44 / MESSAGE FROM OUR CO - CEO s | HIGHLIGHTS | GREENYARD’S RELEVANCE | FOOD OF THE FUTURE | PURE POWER OF PLANTS | DRIVEN BY PASSION & PEOPLE
Gabriel,
Connecting partner for a compliant and sustainable supply chain
Compliance is another domain where Greenyard provides an enormous added value as a connecting partner in the chain. The regulatory context is changing fast and has far-reaching implications for both growers and retailers. In February 2022, the Act on Corporate Due Diligence Obligations in Supply Chains was adopted in Germany, one of our most important markets. And other European markets will soon follow a similar approach at EU level. It obliges companies to set up processes to identify, assess, prevent and remedy human rights and environmental risks and impacts in their supply chains, and in their own operations.
“Our customers don’t always have the precise knowledge and means to fulfil these requirements for all their categories, especially when it comes to overseas products. We use our expertise and our close connections with growers to unburden our customers in this area,” says Jens Gabriel.


“It’s important to realise that this is not a one-way street,” emphasises Gesa Kip. “Complying with changing regulations is equally challenging on the other end of the chain. Many of these things are being decided at desks in Western Europe, with the best intentions, but they do not always consider the realities in the field. It’s our responsibility to follow up on these changes and translate them into digestible information for our growers, so they know what is expected from them.”
”And that includes many elements, such as transparency, transportation, availability, sustainability, and so on. This is exactly why for instance fair pricing is so important, throughout the chain. And even beyond that, it is
JENS GABRIEL
so important to give back to growers and invest in their future,” concludes Jens Gabriel. “This will become even more important as the effects of climate change are being felt. We have to offer them the right support and advice to cope with extreme weather conditions and climatological evolutions. This is a necessity to further strengthen our connection with growers and make it clear that we are on a journey together, towards a better and more sustainable future.”
/ 45 GREENYARD APPROACH | ENVIRONMENTAL IMPACT | SOCIAL IMPACT | ECONOMIC IMPACT & GOVERNANCE | GREENYARD AT A GLANCE | FINANCIAL REPORT
It is so important to give back to growers and invest in their future.”
Jens
Group Sourcing Director
Supporting farmers with advice and technology


Both Belgian Greenyard Frozen and Prepared divisions have a long tradition of integrated relationships with their growers. Through close contacts with the growers themselves and through their respective grower associations (OPVL and BND), both companies support their growers to use the latest agricultural technologies and methods,” say Rik Ceyssens (left) and Stefaan Goudeseune (right).
“A close and fully integrated collaboration with our farmers has always been essential to guarantee the quality of our products. Once the vegetables are harvested, there is no time to waste – in a matter of hours they are being frozen or canned. Over the years, our cooperation has evolved way beyond production planning and required volumes. Today, we support our farmers in almost every aspect of their business.”
“We have undertaken several projects to help farmers further reduce the use of crop protection and fertiliser and improve overall soil quality. In one of these projects, we are testing a digital tool to assess soil quality and pinpoint the exact areas that need extra attention. The tool provides farmers with detailed insight into every square meter of their fields and allows to optimise pH values, the levels of acidity, in every area.”
“But it’s not just about technology. Our agronomists visit the fields on a regular basis to guide farmers and offer them practical advice. Their relationship is based on trust, expertise and mutual respect. The ultimate decision is always in the hands of the farmers. Nature is unpredictable in many ways and only they have the necessary insights to know what their fields really need at any given time.”
46 / MESSAGE FROM OUR CO - CEO s | HIGHLIGHTS | GREENYARD’S RELEVANCE | FOOD OF THE FUTURE | PURE POWER OF PLANTS | DRIVEN BY PASSION & PEOPLE
AGRICULTURAL TECHNOLOGIES
PERFORMANCE
Mining data for better service and better quality
“Data are an essential resource in today’s world,” says Roberto Martinez , Category Analyst at Greenyard Fresh Services. “That’s why we are in the process of building a smart platform which integrates all the supplier data that is available within our company and enables us to share vital information between colleagues.”


“Fruit and vegetables have a long tradition of verbal negotiation, but it takes more than just gut feeling to manage the enormous product flows we handle, day in day out, for our customers. For years now, we are generating a lot of data within our company. With the use of new tools, we can use our digital platform to centralise that information, so that we can use it to better service our customers.”
“These data include the size of the farms, their exact location, the volumes we are contracting,
the delivery dates we agreed upon, the traditional start of the season in that particular region, the expected yields based on historical data, and so on. The platform is fed from different sources and includes data from external official sources, such as official export data from the government or weather forecasts.”
“By combining all these data, we can detect certain patterns in quality and volumes. To give just one example: excessive rainfall often has a negative effect on the quality of grapes. So, when we see a lot of rain in a certain region, we can anticipate these quality issues instead of only finding out about them when the product arrives at our site. In the end, the platform gives us all the information we need to give valid feedback to growers and ensure our customers can count on the best quality products, every single day.”
/ 47 GREENYARD APPROACH | ENVIRONMENTAL IMPACT | SOCIAL IMPACT | ECONOMIC IMPACT & GOVERNANCE | GREENYARD AT A GLANCE | FINANCIAL REPORT
ENVIRONMENTAL FOOTPRINT
Better for everyone
“Through the Better for Nature & Farmer program of a large Dutch retailer, Bakker Barendrecht (a Greenyard company) has been collaborating with more than 210 Dutch growers to introduce more sustainable agricultural practices. The program, which is now entering its third year, is the result of the long-term commitment between growers, our Dutch retailer, Bakker and other service providers,” says Hannah Baijer, R&D Specialist at Bakker Barendrecht.
“The aim of the program is to stimulate our growers to systematically work on the topics: climate, biodiversity and soil health. Measures include for instance the installation of solar panels and the introduction of LED lighting, to systematically reduce their environmental footprint, by lowering

their energy consumption. A healthy soil is full of natural life: it ensures strong plants that require less protection. The program has already resulted in 368 kilometres of flower strips on field margins, numerous insect hotels and an increased use of natural enemies to protect crops from insects or pests.”
“The program breathes a strong commitment from all sides. Our growers agree to make the necessary investments, and they are also compensated for extra investments in sustainability. This is yet another great example of how our unique partnership with customers and growers bear fruit."

48 / MESSAGE FROM OUR CO - CEO s | HIGHLIGHTS | GREENYARD’S RELEVANCE | FOOD OF THE FUTURE | PURE POWER OF PLANTS | DRIVEN BY PASSION & PEOPLE
Nation-wide broccoli event amidst Polish fields
In early October, amidst the broccoli fields near Greenyard Frozen Poland’s production plant in Dąbrowa Chełmińska, the local Agro team organised a nation-wide event focused on broccoli. Attendees included broccoli growers, suppliers, partners, representatives from seed companies, and crop protection firms. The event aimed to explore different broccoli varieties and their characteristics.
Thanks to the Polish National Centre for Agricultural Support (KOWR) and Greenyard's partners, participants learned about the latest monitoring techniques, protective measures, and risk management strategies. The event connected stakeholders from the entire food value chain, fostering knowledge sharing and a deeper understanding of the intricate processes managed by Greenyard Frozen Poland for the benefit of buyers and other business partners.
A fruitful presence at Fruit Attraction 2022
Greenyard’s Fresh colleagues connected with each other and fellow food professionals from across the globe at Fruit Attraction in Madrid. As one of Europe's largest fresh fruit and vegetable fairs, with over 90 000 participants from 130 countries, the 14th edition provided the ideal setting to engage with growers, partners, and customers. This was especially significant after almost two years of exclusively digital encounters.
Greenyard seized this opportunity to exhibit its unique 'Fork-to-Field' business model and to showcase the Strategy 2030.


/ 49 GREENYARD APPROACH | ENVIRONMENTAL IMPACT | SOCIAL IMPACT | ECONOMIC IMPACT & GOVERNANCE | GREENYARD AT A GLANCE | FINANCIAL REPORT

50 / UNLEASHING THE PURE POWER OF PLANTS

/ 51 GREENYARD ANNUAL REPORT 2022/2023
Driven by a passionate group of people
ALEXANDER VERBIST
Passionate people make the difference
We are Greenyard!


Finding and attracting the right talent is crucial in realising our ambitions. But it’s not an easy job in today’s tight and demanding labour market. It does help of course that we are a purpose-driven company, in line with many people’s aspiration to contribute to a better world.


“At the Group level, next to our Talent Development Programs, we focus on the development of common tools – such as the new Applicant Tracking System which makes it easier to follow up applications and lowers the threshold for candidates. We also provide support and share best practices in the recruitment and development domain. But it’s not a one-size-fits-all. What works in our Belgian headquarters may not work in our Polish production site or our Peruvian sourcing office. Our first aim is to support and facilitate our local colleagues so that their great ideas can come to fruition.”
Moreover, the world around us is changing fast, and our sector is no different. The use of technology and data in our processes is increasing at a rapid pace and we are mindful of the major changes in regulations and compliance. It means that developing our talent is not just crucial from a people perspective, but also from a business perspective. At the Group level, we have been initiating several programs to make sure our people are ready for the future, including our Leadership and Game-Changer Development tracks, while the divisions are focussing on business-specific training and development.
A safe haven for everyone
We are working in quite a demanding environment, where speed, flexibility and a relentless focus on quality are of the essence. Through our Integrated Customer Relationships with some of Europe’s biggest retailers, we are providing millions of people with the best quality fruit and vegetables, day in, day out. It requires a lot of hard work from everyone, at every level.

52 / MESSAGE FROM OUR CO - CEO s | HIGHLIGHTS | GREENYARD’S RELEVANCE | FOOD OF THE FUTURE | PURE POWER OF PLANTS | DRIVEN BY PASSION & PEOPLE
“We expect a lot from our employees, but we also need to give back to them. Greenyard should be a safe haven for everyone, a place where everyone can feel safe and respected. We are continuously improving health and safety in our workplaces, from the installation of ergonomic desks and workstations to the prevention of work-related incidents.”


A lot of attention also goes out to mental wellbeing. Last year, we have seen many initiatives to raise awareness around this topic, both within the entities and at Group level. For instance, different sessions on the importance of resilience were offered at our corporate office to help people recognise stress indicators and open up the dialogue with colleagues and managers. Mental well-being is also an important part of the local programs, like in the extended Vitality program at Bakker Barendrecht.”
“Nonetheless, cultivating a positive work environment is a collective effort. That is why we introduced an internal Whistleblowing Tool last year, providing a confidential communication channel to give a voice to concerns related to unethical behavior in the workplace. Through ongoing campaigns, targeted at both white and blue-collar workers, we encourage all colleagues to speak up and share their concerns whenever they witness any kind of wrongdoing. The aim is to establish a safe haven with an inclusive culture where everyone feels safe and valued.”
/ 53 GREENYARD APPROACH | ENVIRONMENTAL IMPACT | SOCIAL IMPACT | ECONOMIC IMPACT & GOVERNANCE | GREENYARD AT A GLANCE | FINANCIAL REPORT
People are the real driving force behind Greenyard. It is their hard work, their knowledge and their passion that have made our company what it is today – a real powerhouse in the world of pure-plant food. It is our mission to support, connect and strengthen them and create a workplace where they can fully develop their talents.”
Alexander Verbist, Group HR and Legal Director
A strong company culture
Today, Greenyard has a diverse workforce of more than 8 500 people, consisting of 80 nationalities, speaking a variety of languages, and working across close to 19 different countries. “Despite their differences in background, education and skills, they all have one thing in common – they are Greenyard!”, says Alexander Verbist. “It is our mission to nurture that feeling and make everyone feel part of the Greenyard story.”
Sharing information – about our company, our strategy, our values, our business and our goals – is crucial in this respect. A complete rehaul of our intranet is just one of
many projects we undertook to realise that ambition. We have worked hard on strengthening our internal communications, making it easier for people to share their stories and promote great examples of what we stand for as a company.
“All of these elements enable us to further develop a strong company culture among all our employees, built upon the foundation of our values – passionate, entrepreneurial, reliable, creative and sharing – and most of all, our purpose to contribute to a healthier and more sustainable future for everyone.”
AROUND THE YARD AND A GLOBAL INTRANET
Bringing our Greenyard-stories to life
Our people are our most valuable asset, and even when we are miles apart – quite literally – we want our colleagues to feel the Greenyard vibe in everything we do, since we all are passionate about what we do at Greenyard. That is why we are ramping up our internal communications efforts so that we can bring our Greenyard stories to life. We did that by transforming our quarterly Around the Yard magazine to a 6-weekly digital Around the Yard newsletter. The aim of this newsletter is to connect the entire Greenyard family, people working at a desk, in our operations or people that travel a lot for their work. We do that by sharing local and global news, introducing our employees to each other, sharing colleague’s favourite recipes and so on.
Next to that, we also worked on launching a new, global intranet. It is the one-stop-shop for employees to connect with each other and the company.
Two new channels to share our beautiful stories worldwide and build a strong group of passionate Greenyard ambassadors.

54 / MESSAGE FROM OUR CO - CEO s | HIGHLIGHTS | GREENYARD’S RELEVANCE | FOOD OF THE FUTURE | PURE POWER OF PLANTS | DRIVEN BY PASSION & PEOPLE
DEVELOPING TALENT
The game-changers of tomorrow
Nurturing and developing our talent – at every level – is essential in today’s tight labour market. “Through our Group Development Programs, we stimulate people to look beyond their own entity and their own field of expertise, and work together on strategic themes that will define the future of our organisation,” says Sarah Tijskens , Group HR Business Partner.

“Most of Greenyard’s training and development programs are being organised within the entities or the individual sites – this is the best way to guarantee they are tailored to the specific needs of both the business and the employees themselves. At Group level, we realised an important layer was missing among our entities to nurture talent across
our entire organisation and offer our employees ample opportunities to enhance their skills within our group.”
“Our Leadership Development Track was introduced in 2021 and focuses on top management. In May 2023, we organised our first Game Changers program, in which 20 upcoming talents from different countries and divisions are invited to work together on strategic themes for our company. The program will not only help them to develop their individual talent but will also allow to share knowledge and experiences within our Group and create new ambassadors for our purpose and strategy.

/ 55 GREENYARD APPROACH | ENVIRONMENTAL IMPACT | SOCIAL IMPACT | ECONOMIC IMPACT & GOVERNANCE | GREENYARD AT A GLANCE | FINANCIAL REPORT
Focus on vitality!
“Vitality is the central theme for all the efforts we undertake to promote health and well-being in our company. It can relate to many different things such as energy levels, healthy food, ergonomics, physical exercise, or a good work-life balance. And ultimately, it’s all about feeling good about yourself and your (work) environment,” says Chantal Groot , HR Specialist Vitality at Bakker Barendrecht.
“When we think about health and well-being in the workplace, our ultimate aim is to support people throughout their career and beyond. To remain in good health not just until they retire, but at least another twenty years after that. Individual responsibility is key in this respect, but we do believe there’s a lot we can do as an employer. Our

efforts can range from ergonomic office chairs and workstations to hiring our own physiotherapist, from stress management to budget coaches. In our Work-Life Balance Program, specific attention goes out to the particular life phase you’re in as an employee. Busy colleagues in their twenties or young parents have totally different needs than our middle-aged employees.”
“We’re also promoting healthy food at our company canteen in Ridderkerk. We don’t patronise and tell people what they should eat. But we do put in the extra effort in the presentation of healthy alternatives and our salad bar. It’s little things like that which give people a nudge in the healthier direction.”

56 / MESSAGE FROM OUR CO - CEO s | HIGHLIGHTS | GREENYARD’S RELEVANCE | FOOD OF THE FUTURE | PURE POWER OF PLANTS | DRIVEN BY PASSION & PEOPLE
HEALTH & WELL-BEING
Healthy food – a life-long passion
“I have always been very passionate about food,” says Robin Pétré , who works as an International Business Developer for Greenyard.

“Through the Prince Albert Fund I got the chance to undertake a twelve-month project for a Belgian company outside of Europe. This is how I arrived at Seald Sweet, which is part of Greenyard’s USA operations. Since then, I have taken on the task to map our growth potential and seek new business opportunities on this side of the Atlantic. It has
been quite an exciting opportunity for a young guy like me to be able to develop my talent in a growing, multinational company like Greenyard.”
“Because of my background, I feel very connected to Greenyard’s history and the vision of its founder, Hein Deprez, for a healthier future. It’s great to be able to use my life-long passion for healthy food in my daily work and be part of a company that is creating a positive change in our sector.”
Language course boosts self-confidence
In 2022, Bakker Barendrecht reached out to the Stichting Lezen en Schrijven (Foundation for Reading and Writing) in the Netherlands to organize a language course for its employees. Andrew, one of our forklift operators, was among thirty colleagues who followed the training. “I’m very grateful
Bakker Barendrecht gave me the opportunity to improve my reading and writing skills. Being able to speak Dutch at this level gives me a lot more freedom and confidence, both in my personal life and at work.”

/ 57 GREENYARD APPROACH | ENVIRONMENTAL IMPACT | SOCIAL IMPACT | ECONOMIC IMPACT & GOVERNANCE | GREENYARD AT A GLANCE | FINANCIAL REPORT
PASSION
FOOD
LANGUAGE COURSE
FOR

58 / UNLEASHING THE PURE POWER OF PLANTS
The Greenyard approach: improving life with our sustainability strategy & reporting

/ 59 GREENYARD ANNUAL REPORT 2022/2023
Improving life Sustainability Model
• Business ethics
• Food safety, quality & traceability
• Innovation
• Risk management
Soci a l impac t
• Responsible sourcing
• Health & nutrition
• Talent attraction & employee development
• Health, safety & well-being
• Local community engagement & citizenship
Healthy lifestyles
I M P R O VING LI
Sustainable food supply chains
E
Environment al imp a c t
• Climate change & footprint reduction
• Water stewardship
• Food waste & circular economy
• Circular packaging
• Sustainable agriculture
Societ y
60 / MESSAGE FROM OUR CO - CEO s | HIGHLIGHTS | GREENYARD’S RELEVANCE | FOOD OF THE FUTURE | PURE POWER OF PLANTS | DRIVEN BY PASSION & PEOPLE
Ourpeople Ourcustomers
Suppliers -Ourgrowers - Transportpartners
R egula t or s Sha r eho l der s
Ec o n omic imp a c t & Governance
F
Moving towards pure-plant diets is crucial for healthier lifestyles and simply the best option for our planet.”
Florens Slob, Group Sustainability & Innovation Director
Greenyard operates as a true connector within the world of fruit and vegetables, with a clear understanding of the needs at both ends of this chain. Our sustainability model is driven by our purpose to improve life, as we enable healthier lifestyles through the
products we offer, while at the same time ensuring a sustainable food value chain. To that end, we fully embrace responsible and sustainable sourcing as our guiding principles, and we are dedicated to making a positive impact for both people and the planet.
Enabling healthy lifestyles
Fruit and vegetables are the foundation of any healthy diet as they provide us with essential nutrients such as fibres, minerals and vitamins. Together with our customers we focus on making these healthy, daily essentials available to consumers in a convenient and affordable way while ensuring the best quality and year-round availability.
Ensuring sustainable food value chains
Ensuring the accessibility and affordability of nutritious fruit and vegetables for everyone is a crucial element of our commitment to sustainability. That is why we consistently strive to balance environmental sustainability and social responsibility throughout the entire food value chain.
Greenyard’s sustainability model shows a circle of stakeholders directly involved in both our business model as well as our sustainability performance. Sustainability is embedded in every decision we make, implying that every action we take has impact.
Each choice, on our journey towards healthier lifestyles and more sustainable food value chains, is clustered into three impact domains: Economic Impact & Governance, Environmental Impact and Social Impact.
Within these three domains we have incorporated all the material topics that we identified within the double materiality assessment. On these topics we have either developed policies or a strategic approach. We report on our actual performance and future plans further in this report – which has a limited assurance on specifically identified KPIs.
With our approach, we can provide a clear and up-to-date status while ensuring compliance with future regulatory reporting requirements. In the course of 2023, we will analyse the requirements of the EU-CSRD (Corporate Sustainability Reporting Directive). Although some additional reporting elements may be required, we expect both our sustainability model and our double materiality analysis will be reconfirmed, as they were designed with the CSRD in mind.
Together with our customers, growers and other stakeholders we firmly believe that each step we take in the right direction can create a significant impact. Our Sustainability Roadmap and model will serve as our guiding compass on this journey.
/ 61 GREENYARD APPROACH | ENVIRONMENTAL IMPACT | SOCIAL IMPACT | ECONOMIC IMPACT & GOVERNANCE | GREENYARD AT A GLANCE | FINANCIAL REPORT
Materiality matrix Double Materiality Assessment
Our most recent materiality assessment was conducted at the beginning of 2022, and forms the basis for our latest results, which are presented in the materiality matrix further on. This matrix helps to prioritise the most impactful ESG issues that currently matter most to our stakeholders. The double materiality assessment was performed by a specialised consultant with the future demands of the CSRD in mind. The assessment confirmed Greenyard’s strategy and sharpened the key targets we are working on.
In the timeframe between this assessment and reporting period of this report, Greenyard’s business model has not changed substantially. However, the war in Ukraine has sparked significant changes in the political and European sphere, rendering the reliance on fossil fuels and the urgency for transitioning to alternative energy sources more apparent than ever. Additionally, the effects of inflation have also played a role in shaping this landscape. While these impacts are huge, this does not change anything on Greenyard’s current materiality matrix. We will give updates on the materiality matrix every three years or when deemed necessary due to significant changes.
Health, Safety & Wellbeing
Climate Change and Footprint Reduction
Food Safety, Quality & Traceability
Sustainable Agriculture
Responsible Sourcing
Business Ethics
Diversity & Inclusion
Cyber Security
Circular Packaging
Innovation and New Technologies
Talent Attraction & Employee Development
Local Community Engagement & Citizenship
Food Waste & Circular Economy
Health and Nutrition
Water Stewardship
62 / MESSAGE FROM OUR CO - CEO s | HIGHLIGHTS | GREENYARD’S RELEVANCE | FOOD OF THE FUTURE | PURE POWER OF PLANTS | DRIVEN BY PASSION & PEOPLE
Business Impact of Greenyard Importance to Stakeholders medium medium high
high
The assessment of Greenyard considered both the impact on people and the environment, as well as the sustainability issues that affect our business, which is referred to as double-materiality. The main topics were determined by examining relevant third-party ESG ratings, disclosure standards, trend reports, analyses of reports by peer companies, as well as Greenyard’s own analyses and documentation. Interviews with selected customers, suppliers, growers and management, and by-proxy workshops completed the assessment.
We will monitor all the material topics either from a sustainability perspective or from a business and risk perspective. The business and risk perspective is reported separately as part of our financial report, while the sustainability perspective is included within this part of the report.
In our most recent sustainability report, Greenyard communicated the findings of the materiality assessment, which prompted the formulation of a sustainable agri-

culture policy. To support this topic Greenyard joined a biodiversity learning community organised by The Shift, which gathers different companies to jointly develop policies and targets on this topic. We decided to await the outcomes of this process before publishing our policy and take along the learnings from our participation. In parallel, the Greenyard Fresh division is an active member of the Better for Nature & Farmer program that addresses biodiversity. We have similar activities with the growers that supply our Long Fresh divisions.
For our Frozen business we will perform a climate change sensitivity analysis in the course of 2023. The finding of that study will be available after the publication of this report. We will continue to do similar analyses over the coming years, but we also trust the common sense and expertise of our sourcing specialists to act on both climate change mitigation as adaptation.
Finally, Greenyard has also identified talent attraction and development as another essential topic to accelerate its strategy. For more information on this topic, see page 52.
/ 63 GREENYARD APPROACH | ENVIRONMENTAL IMPACT | SOCIAL IMPACT | ECONOMIC IMPACT & GOVERNANCE | GREENYARD AT A GLANCE | FINANCIAL REPORT
Communities & dialogue Stakeholder engagement
As a responsible company, Greenyard commits to a sustainability strategy that reflects the views of its stakeholders and addresses the issues that really matter. To establish a formal process on this topic, our double materiality assessment will be reviewed annually and updated every three years. Greenyard’s key stakeholders consist of different actors, ranging from customers, employees, growers and suppliers to shareholders and investors, banks, consumers, governmental institutions and regulators and NGOs.
Greenyard is open for any comments on its approach and actively engages in external discussions and learning communities to exchange thoughts and gain insights. Our plans are shaped through continuous dialogue with our stakeholders and our understanding of the impact of our activities along the value chain.
As a leading player in fruit and vegetables, Greenyard actively participates in industry associations and stakeholder alliances to drive our industry forward both on a national and an international level. Senior experts and managers serve as board members or participate in a wide range of projects and working groups.

We consider these initiatives essential for the effective promotion of healthy lifestyles and increasing the consumption of fruit and vegetables. Additionally, they enable a more sustainable growth of produce and foster responsible business behaviour towards everyone involved in the food value chain.
The local communities where Greenyard has its distribution centres and factories are significant to us. Not only because our employees are from these communities, but also due to the potential positive or negative impact we may have. Greenyard is involved in these communities as an employer and acts as a responsible and active part of society.
Greenyard recognises a similar impact upstream in the value chain, within the communities where we source our products. We bring significant economic value to these communities, but we also have a responsibility to ensure the growing of our produce is done with utmost care for the local environment and the well-being of all people involved.
64 / MESSAGE FROM OUR CO - CEO s | HIGHLIGHTS | GREENYARD’S RELEVANCE | FOOD OF THE FUTURE | PURE POWER OF PLANTS | DRIVEN BY PASSION & PEOPLE
Stakeholder group Engagement method
Employees
• Dedicated employee communications
• Management meetings
• Performance evaluation reviews
• Frequent feedback sessions
• Code of Conduct
Customers
• Business reviews with key customers
• Daily contacts in the field (sales, quality, NPD, CSR, …)
• Customer audits & questionnaires
Growers & suppliers
• Communicate expectations on social, environmental and ethical topics through product specifications
• Business reviews with key growers and suppliers
• Due diligence & audits to evaluate supplier performance
• Training
Public organisations (industry associations, NGOs, policymakers, knowledge institutions)
• Board representation in industry associations
• Participation in working groups & stakeholder committees
Organisations/Tools
• Employee communication: Newsflash, Around the Yard
• Code of Conduct e-learning tool

• Key Account Management
• Food safety: BRC, IFS, QS, …
• Sustainability: CDP, Ecovadis
• Customer specific questionnaires
• Greenyard quality agreements
• Greenyard sourcing connections
• Good Agricultural Practices: GlobalGAP, Vegaplan, …
• Food safety: BRC, IFS, QS, …
• Social compliance: GRASP, Rainforest Alliance, SA8000, …
• Industry associations: Freshfel, Profel, International Fresh Produce Association, …

• Sustainability alliances: SBTi, SIFAV, The Shift, …
• Meetings, roundtables and conferences
• Internships, lectures
• Knowledge institutions: Flanders Food, KU Leuven, UGent, Wageningen University & Research, Food Valley, ProteInn Club, Brightlands Materials Centre, … Investors
• Information dispersion through different deliverables
• Bilateral contact via investor roadshows, conferences
• Support on equity research by brokers
• ESG questionnaires & ratings
• Annual report, press releases
• Capital Markets Days
• Investor calls
• Equity research documents
• MSCI, Sustainalytics, Vigeo Eiris, World Benchmarking Alliance
/ 65 GREENYARD APPROACH | ENVIRONMENTAL IMPACT | SOCIAL IMPACT | ECONOMIC IMPACT & GOVERNANCE | GREENYARD AT A GLANCE | FINANCIAL REPORT
Key targets
Sustainability Roadmap & Ambitions
The Greenyard Sustainability Roadmap was developed in collaboration with senior management of our different entities and with the broader group of sustainability ambassadors working across the Group’s divisions and locations. The approach was approved and endorsed by Greenyard’s Board of Directors and the Leadership Team.

At the start of 2022, Greenyard’s Roadmap and the related key targets were confirmed with a double materiality assessment. Shortly after the summer of 2022, this structured approach proved to be a springboard for the sustainability-linked credit facility that was communicated at the beginning of 2023. According to our plans we will review and update the Roadmap in 2023. We will do so after a gap-analysis on the reporting requirement, related to the upcoming CSRD, has been performed. We do not expect significant changes other than adding relevant targets.
Progress and changes in the financial year 2022-2023
In parallel with the realisation of the sustainability linked credit facility, Greenyard has translated the longer-term targets into annual targets for each division, and ultimately for each entity. These annual targets on division and entity level are internal targets to enable more effective steering towards our ultimate long-term targets in 2025 (reporting year 2025-2026) and 2030.
As of 2022, all KPIs are measured at specific locations or plants. Most KPIs are reported and followed up monthly, except when quarterly or annual updates are more relevant. The KPIs are uploaded in our reporting tool and verified by local business owners and the financial team. Reporting on progress is done at Group level. Within our sustainability reporting tool, it is broken down into country, division and Group level. This reporting is discussed periodically with senior management and the Board.
Based on trend analyses, benchmarks and comparisons, appropriate conclusions and actions are taken to make sure we achieve our ambition levels. We are continuously improving our reporting process by – amongst others –introducing it in the budget process, further sharpening the analysis, updating the ESG improvement plans and working towards a fact-based ESG culture. The Group Sustainability Director and the CFO, along with their teams, work closely together on this ongoing improvement project.
The key targets of Greenyard’s Roadmap remain the same. When we indicate “by 2025”, we refer to the reporting year 2025-2026. For our climate change targets, the baseline is different to be fully in line with our SBTi-commitments (Science Based Targets initiative). More details on our approach, progress and future plans are presented per topic within this report.
66 / MESSAGE FROM OUR CO - CEO s | HIGHLIGHTS | GREENYARD’S RELEVANCE | FOOD OF THE FUTURE | PURE POWER OF PLANTS | DRIVEN BY PASSION & PEOPLE
1. Climate change – adaptation and mitigation
• We will realise a 50% reduction of Scope 1 and Scope 2 CO 2-emissions by 2025, and 70% by 2030, from a 2020 baseline.
• We commit that 70% of our suppliers (by spend, covering purchased goods and services, upstream transportation and distribution, and downstream transportation and distribution) will be working on having science-based targets by 2026.
2. Minimise food waste
• We will reduce any avoidable food waste in our own production by 25% by 2025 and by 50% by 2030 from a 2019 baseline.
• We will valorise all residual streams and by-product flows of our food production by 2025.
3. Lower the water footprint of fruit and vegetables
• We will assess the water risks of all our growers by 2025 and set up projects to optimise water usage in our operations.
• We will reduce our primary water use by 10% by 2025, from a 2019 baseline, and focus on lowering the water intensity accordingly.
4. Minimise the environmental footprint of our packaging
• We will realise 100% recyclable packaging by 2025 and align our packaging with recycling schemes in key markets to ensure actual recycling.
• We will reduce the amount of packaging we use and optimise our packaging footprint without reducing shelf-life (target to be defined in 2023).
• We will use 30% recycled material in non-food contact packaging by 2030.
5. Ensure responsible and sustainable sourcing
• We commit that 100% of our grower base located in high-risk countries will be certified for social compliance by 2025 and those in medium-risk countries before 2030. We will report on this in line with our SIFAV commitment.
/ 67 GREENYARD APPROACH | ENVIRONMENTAL IMPACT | SOCIAL IMPACT | ECONOMIC IMPACT & GOVERNANCE | GREENYARD AT A GLANCE | FINANCIAL REPORT
1. Climate change – adaptation and mitigation
• We will realise a 50% reduction of Scope 1 and Scope 2 CO 2-emissions by 2025, and 70% by 2030, from a 2020 baseline.
• We commit that 70% of our suppliers (by spend, covering purchased goods and services, upstream transportation and distribution, and downstream transportation and distribution) will be working on having science-based targets by 2026.
Everything’s gone green
By 2025, Greenyard wants to reduce its operational CO2-emissions – Scope 1 and 2 – by 50% compared with 2020. For 2030, we aim for a 70% reduction. “Procurement has an important role to play in the realisation of these ambitions. We’re on a tight schedule, but we’re all set to reach our 2025 targets,” says Adrien Gentile , Group Procurement Director.

“The lion’s share of our CO2-emissions come from the cooling, freezing and heating processes in our production entities, along with our transport and logistical activities. In 2020, electricity accounted for about almost half of our emissions (42%), followed by natural gas (38%) and diesel (15%).
“Our initial focus was on the switch to green electricity. At the end of the financial year 20222023, we have already secured the supply of the needed renewable electricity to achieve our 2025 plan on electricity lowering our Scope 2 emissions. We have gradually switched contracts that were up for renewal to green electricity on a country-by-country basis. In 2023, Poland and Germany will take big steps, with Belgium following in 2024. France and the United Kingdom, who have a low emission factor due to the high share of nuclear energy, will follow in 2030.”
“At the same time, we are re-evaluating investments in solar and wind power at our own sites –the energy crisis has opened new possibilities for revised business cases. We are also initiating contacts with companies that are making investments in offshore production. With the gradual introduction of electric trucks and the electrification of processes that currently run on natural gas, we expect our call for green electricity will continue to grow.”
68 / MESSAGE FROM OUR CO - CEO s | HIGHLIGHTS | GREENYARD’S RELEVANCE | FOOD OF THE FUTURE | PURE POWER OF PLANTS | DRIVEN BY PASSION & PEOPLE
Reducing our impact step by step
“We have been a member of the Floriculture Sustainable Initiative (FSI) since 2018, in which we collaborate with international partners on a responsible production and trade of flowers and plants. As part of this partnership, we initiated a project to calculate the CO2-footprint of the products we supply to our German customer,” says Chiel van der Kooij , Quality Management Lead at Greenyard Fresh Solutions Flowers.

“Using the toolkit that was developed by FSI, we are mapping the footprint of our products through the entire lifecycle – from the moment the seeds go into the ground to the moment they arrive at the store. This enables us to analyse the impact in each phase and gives us insight into the effects of different measures.”
“Following a baseline measurement in 2020, we can already see what progress is being made. In Europe, we can clearly see the effect of the energy crisis. Growers have taken drastic measures to reduce their energy consumption and have invested heavily in renewable energy sources. For our overseas products, we are investigating how we can remove the barriers to use more sea freight to further reduce our footprint. We have been looking into the use of cooled containers – the so-called reefers – and improved packaging to prevent product waste during the long trip.”
/ 69 GREENYARD APPROACH | ENVIRONMENTAL IMPACT | SOCIAL IMPACT | ECONOMIC IMPACT & GOVERNANCE | GREENYARD AT A GLANCE | FINANCIAL REPORT
2. Minimise food waste
• We will reduce any avoidable food waste in our own production by 25% by 2025 and by 50% by 2030 from a 2019 baseline.
• We will valorise all residual streams and by-product flows of our food production by 2025.
There is no such thing as waste
Early 2023, Greenyard Fresh Belgium set up a partnership with Recycling Partners Belgium (RPB).

“The aim is to make our waste and materials chain more sustainable by using advanced monitoring tools and RPB’s extensive network of collectors and recyclers,” says Ann-Sophie Paesen, Continuous Improvement Engineer at Greenyard Fresh Belgium.
“Our main activities are in the convenience department where we are producing pre-cut vegetable mixes for soups and other dishes, alongside a wide range of lettuce mixes. Everything starts with preventing waste at the very start, by ensuring incoming products are processed as soon as possible. Our planners combine historical data with weather forecasts to accurately predict the actual demand from our customers, so that we have a good insight on how much we need to produce even before they send us their orders”
“Furthermore, we are also adjusting the machine transitions by incorporating funnels, sprayand/or blow systems to prevent cut vegetables from falling off the production line. Once these modifications are finished, we will ensure the use of a higher percentage of the valuable fresh vegetables we use as our input. We will assess and monitor all our waste streams, with maximum separation of all recyclable materials at the source. We will also be able to identify best possible collectors and processors for each stream. We plan to upcycle our green waste, which is now being processed in local biogas installations. Our plastic waste, including large packaging foils and protective equipment we use during production, will be processed for further recycling by a specialised external partner.”
“But we’re also looking towards the future. The use of Artificial Intelligence may eventually help us to automate and optimise the cutting of the lettuce hearts to minimise waste. Recuperating rubisco, a very promising pure plant protein, from our green waste is another exciting avenue. So, we still have a lot of great projects to look forward to!”
70 / MESSAGE FROM OUR CO - CEO s | HIGHLIGHTS | GREENYARD’S RELEVANCE | FOOD OF THE FUTURE | PURE POWER OF PLANTS | DRIVEN BY PASSION & PEOPLE
Food waste – every kilo counts
“Preventing waste – and food waste in particular – is one of our main priorities. Everything starts with collecting accurate data. We are monitoring and measuring waste after the end of every shift. This gives us insight into where waste is generated and allows us to take the necessary measures,” says Piotr Ośwałdowski, Sustainability & Operational Excellence Manager at Greenyard Frozen Poland.


“This has already led to many improvements in our production processes – last year, we have been working very hard on machine modifications to avoid spills on our conveyors. These improvements range from small and quick fixes to more elaborate investments. We also call on our own people on the work-floor to make suggestions through Kaizen initiatives on where they see possibilities to avoid potential spills.”
“Furthermore, together with our Sales team, we are looking into recuperating certain off-grade products to be used in other products such as soups, juices or jams. This is an interesting option for product flows that do not meet our specific requirements in shape or size but are still perfect for human consumption. We also don’t shy away from the non-standard use of organic waste. For example, last year, we sold 200 tons of cherry pits to be used as an alternative fuel for heating.”
/ 71 GREENYARD APPROACH | ENVIRONMENTAL IMPACT | SOCIAL IMPACT | ECONOMIC IMPACT & GOVERNANCE | GREENYARD AT A GLANCE | FINANCIAL REPORT
3. Lower the water footprint of fruit and vegetables
• We will assess the water risks of all our growers by 2025 and set up projects to optimise water usage in our operations.

• We will reduce our primary water intensity by 10% by 2025 from a 2019 baseline.
Water stewardship at Greenyard Fresh Belgium
Following a successful pilot installation in 2021, Greenyard Fresh Belgium and Pidpa, a Belgian integrated water utilities company, are now working towards an agreement to install an innovative water purification system in combination with the already existing on-site groundwater extraction. The next step involves obtaining the necessary permits to fully deploy this solution.
The new water system will reduce Greenyard Fresh Belgium's freshwater intake for cleaning and rinsing by 75%, allowing them to reuse over 100 000m³ of water being purified and reused each year. The purification system will also ensure that the water quality is equivalent to drinking water, which is crucial for maintaining food processing standards. Approximately 105 000 m³ of water will be safely filtered and reused, while the remaining 35 000m³ will be sourced from on-site groundwater extraction, with the option to switch to city water if necessary.
This project is perfectly in line with Greenyard’s commitment to lower its water footprint as part of their sustainability ambitions. By the end of 2025, the Group plans to decrease its primary water use by 10% compared to 2019.
72 / MESSAGE FROM OUR CO - CEO s | HIGHLIGHTS | GREENYARD’S RELEVANCE | FOOD OF THE FUTURE | PURE POWER OF PLANTS | DRIVEN BY PASSION & PEOPLE
4. Minimise the environmental footprint of our packaging

• We will realise 100% recyclable packaging by 2025 and align our packaging with recycling schemes in key markets to ensure actual recycling.
• We will reduce the amount of packaging we use and optimise our packaging footprint without reducing shelf-life (target to be defined in 2023).
• We will use 30% recycled material in non-food contact packaging by 2030.
5. Ensure responsible and sustainable sourcing
• We commit that 100% of our grower base located in high-risk countries will be certified for social compliance by 2025 and those in medium-risk countries before 2030. We will report on this in line with our SIFAV commitment.
/ 73 GREENYARD APPROACH | ENVIRONMENTAL IMPACT | SOCIAL IMPACT | ECONOMIC IMPACT & GOVERNANCE | GREENYARD AT A GLANCE | FINANCIAL REPORT
Sustainability topics
United Nations Sustainable Development Goals
When developing our Sustainability Roadmap, we matched the material topics with the United Nations Sustainable Development Goals (SDGs). We drew inspiration from the 17 SDGs, along with the UN Global Compact Principles and the Unicef Childrens Rights and Business principles. We narrowed our focus to five SDGs that directly correlate with our business and strategy.
Our role as a connector between consumers and farmers within the food value chain is an essential prerequisite for achieving success in both business and sustainability. This crucial aspect is clearly depicted in our Sustainability Model (see page 60), which highlights the integration of sustainability into our operations. A logical step, as we are a purpose-driven company that relies on products of nature and strives to improve life in everything we do.
As a global player, we recognise that everything we do has an economic, environmental and social impact. Our pure-plant product portfolio offers great opportunities as a category on its own. At the same time, we embrace our responsibility to care for our environment and ensure fair treatment within the entire food value chain. With our Strategy 2030 and our Sustainability Roadmap, we add value to society and meet global customer needs. This is also reflected in the SDGs we chose to focus on. A broader rationale for the selected SDGs can be found in the Sustainability section on the Greenyard website.

74 / MESSAGE FROM OUR CO - CEO s | HIGHLIGHTS | GREENYARD’S RELEVANCE | FOOD OF THE FUTURE | PURE POWER OF PLANTS | DRIVEN BY PASSION & PEOPLE
Promote healthy lifestyles with a diet based on fruits & vegetables.
Minimise food waste , create awareness on the need to transform our food system.
Promote sustained, inclusive and sustainable economic growth, full and productive employment and decent work for all.
Reduce our footprint and build a resilient food supply chain while fostering nature and respecting planetary boundaries.
Build a resilient and sustainable food chain and promote sustainable agriculture.
/ 75 GREENYARD APPROACH | ENVIRONMENTAL IMPACT | SOCIAL IMPACT | ECONOMIC IMPACT & GOVERNANCE | GREENYARD AT A GLANCE | FINANCIAL REPORT

76 / UNLEASHING THE PURE POWER OF PLANTS
Environmental impact

/ 77 GREENYARD ANNUAL REPORT 2022/2023
Climate change is a key material topic for all Greenyard’s stakeholders. While we know that a good biodiversity and healthy soil are important, our business relies on different interconnected topics. Respecting nature’s complexity and value, we acknowledge that the food sector is operating beyond planetary boundaries. Even though fruit and vegetables have a relatively small footprint, it is still our duty to reduce our footprint and embrace our responsibility. Our Fork-to-Field approach connects all stakeholders in our value chain and enables a resilient, environmentally friendly business that benefits society and, in the end, nature as well.

MESSAGE FROM OUR CO - CEO s | HIGHLIGHTS | GREENYARD’S RELEVANCE | FOOD OF THE FUTURE | PURE POWER OF PLANTS | DRIVEN BY PASSION & PEOPLE 78 /
Carbon footprint Climate change & footprint reduction
On average, fruit and vegetables have a relatively low carbon footprint when compared to other food categories. To reduce our footprint and respect planetary boundaries, we need to team up with all partners within the food value chain. Everything starts with our own direct emissions, caused by activities that are under our own control. Environmental footprint reductions are far more than just greenhouse gas emissions, although these emissions are a valuable metric.
Our approach
Greenyard reports the carbon footprint of its activities within the Group annually by calculating its Scope 1, Scope 2 and Scope 3 greenhouse gas emissions. We measure the performance of the most material KPIs of our Scope 1 and 2 emissions monthly. This enables our business entities to monitor and manage their footprint.
Our Scope 1 and 2 emissions cover our own operations (consisting of factories operated by Greenyard, but excluding co-packers), our own warehousing (consisting of distribution centres operated by Greenyard, excluding third-party warehousing) and our own logistics (consisting of fleets operated by Greenyard, including our company cars). Scope 3 emissions cover the sourced fruit and vegetables, third party logistics, packaging, waste, and business flights. The data is calculated, verified and reported in line with the GHG-Protocol.
For Scope 1 and 2 greenhouse gas emissions our target is to reduce emissions by 50% by the end of 2025 from a 2020 baseline and by 70% in 2030. For Scope 3, Greenyard commits that 70% of its suppliers (by spend
covering purchased goods and services, upstream and downstream transportation and distribution) will have science-based climate targets by the end of 2026.
Greenyard’s corporate greenhouse gas emission reduction targets for its Scope 1, 2 and 3 emissions are in line with limiting the global temperature rise to 1,5°C. They were validated by SBTi (Science Based Targets initiative –certificate GREN-BEL-001-OFF) in April 2022. The Group discloses its climate-related risks and impact under the terms of the CDP (2022 score B). This way we ensure consistency in the information provided to stakeholders in line with the recommendations of the Task Force on Climate-related Financial Disclosures (TCFD). As Greenyard falls under the scope of EU Taxonomy Regulation (EU 2020/852) we analysed the eligibility and alignment of our activities against the Climate Delegated Act (EU 2021/2139; on climate change mitigation and adaptation). Any disclosures and extra explanation can be found as from page 129.
/ 79 GREENYARD APPROACH | ENVIRONMENTAL IMPACT | SOCIAL IMPACT | ECONOMIC IMPACT & GOVERNANCE | GREENYARD AT A GLANCE | FINANCIAL REPORT
decreased Scope 1 and 2 emissions on a like-for-like basis putting the overall reduction versus 2020 on 13%.
Our progress
This year, Greenyard’s Scope 1 and 2 emissions decreased by 9% on a like-for-like basis putting the overall reduction versus 2020 on 13%. We are making excellent progress in achieving our targets. This progress is mainly driven by the switch to renewable and low-carbon energy sources, and our continued focus on energy-efficiency, including lowering our gas-use. We also had lower fugitive emissions due to refrigerant leakages. This year, 16% of our electricity consumption came from renewable sources. Next to a switch to green energy we see the emissions of our lease car fleet improving due to an increasing number of electrical vehicles.
By 2030, Greenyard commits to reduce its Scope 1 and 2 greenhouse gas emissions with 70% from the same baseline. The Group is actively investigating several initiatives to make the transition from natural gas to other energy sources for the steam and heat generation in the production plants of our Prepared and Frozen division. Today the production costs are still significantly higher for alternative energy sources (mainly via electrification) compared to natural gas. The significant impact of this
transition on primary processes necessitates early planning of our efforts to achieve our saving targets by 2030.
By 2026, Greenyard commits that 70% of its suppliers will have science-based targets. Within the past year Greenyard did a survey with 350 of its largest suppliers. From this survey we concluded that currently around 12% of our suppliers have committed to set science-based targets and a larger group is actively working on climate mitigation. Next to this we see a growing share of our customers implementing SBTi-validated targets Additionally, our procurement department has organised trainings with our buyers to help raise extra awareness on this topic. We have started to collect primary data from our suppliers (ca. 15%) to further improve the reporting of our Scope 3 emissions.

With a view to further assist our suppliers to calculate their environmental and carbon footprint, Greenyard is taking a leading role in the Freshfel Environmental Footprint Initiative, an industry initiative to establish common rules, known as Product Environmental Footprint Category Rules (PEFCR). The methodology will be developed with the support of Wageningen Economic Research
Scope 1: 2,26% Scope 2: 1,66%
Scope 3: 96,08%
Scope 3: Purchased goods & services: 59,45%
Upstream transport & distribution: 22,02%
Downstream transport & distribution: 13,71%
Other*: 0,89%
* Includes fuel- and energy-related activities not included in Scope 1 and 2, waste generated in operations and business travel
80 / MESSAGE FROM OUR CO - CEO s | HIGHLIGHTS | GREENYARD’S RELEVANCE | FOOD OF THE FUTURE | PURE POWER OF PLANTS | DRIVEN BY PASSION & PEOPLE
Scope 1, 2 & 3 emissions (in tonne CO 2 -eq. )
in the next two years. Once developed, the PEFCR for fruit and vegetables will be available for sector-wide use as an open resource. In line with these developments, Greenyard started working with the LCA tool Glimpact to calculate its products’ footprint and identify the best levers for action to reduce their impact across 16 impact categories. We are convinced that the new methodology will help retailers to work even more on the sustainability of our category and that it will help to guide consumers to make healthier choices in their daily diet, without having to compromise on taste.
Taking into account the very long delivery times for electric vehicles, the move towards a full electric car policy in our core markets is slowly starting to show on our parking lots. Today around 15% of our lease car fleet is fully electric. . We anticipate a steady growth in the coming years as we are now exclusively purchasing electric vehicles. Our primary focus is on markets with accessible electric charging infrastructure, including the Netherlands, Belgium, the United Kingdom, France, Austria, and Germany.
Greenyard added a specific field in its CAPEX approval tool, which enables to include different sustainability
aspects in every CAPEX request. To facilitate the choice for more sustainable alternatives we work with an internal carbon price of 100 euro per tonne CO2 which can be included in business cases. Most important to us is the awareness created by this approach within our entities, as well as the extra information they provide with investment requests.
In line with TCFD and future CSRD requirements, Greenyard is preparing a follow-up on last year’s quantitative scenario-analysis of its supply chain. After an initial trial on the grape supply chain, this year’s exercise will focus on the key production regions of our processing operations throughout Europe. The production regions will be analysed against the rcp45 and rcp85 scenarios both for 2030 and 2050. The conclusions bring extra substance to the insights of our agronomists and will assist the sourcing teams for the medium and the long term.
We will continue to invest in these scenario analyses to support our sourcing strategy. We will focus on specific areas and product groups step by step. The analysis for our Frozen and Prepared divisions will be completed during summer and featured into the forthcoming sustainability report.
/ 81 GREENYARD APPROACH | ENVIRONMENTAL IMPACT | SOCIAL IMPACT | ECONOMIC IMPACT & GOVERNANCE | GREENYARD AT A GLANCE | FINANCIAL REPORT
Scope 1 – Stationary combustion Scope 1 – Mobile combustion Scope 1 – Fugitive emissions Scope 2 – Electricity Fresh Frozen Prepared by source (market-based approach) Scope 1 & 2 emissions (in tonne CO 2 -eq. ) by division (market-based approach) 38,4% 39,3% 22,3% Other: 0,1% 38,4% 4,4% 15,0% 42,1%
Future plans
Greenyard’s ambitions and targets are defined in our Sustainability Roadmap. The targets for the financial year 2025-2026 are clear, and in reach with the current progress. Further transitions to renewable and low-carbon energy are or will be contracted in the coming years. We also actively investigate new projects to maximise on-site renewable energy production. As most locations are leased, this is done in close cooperation with the real estate owners, with Greenyard as the off-take partner for the produced energy via a power purchase agreement.

For Greenyard’s Long Fresh division, we are investigating alternative fuels and electrification of processes with the aim to switch to alternative steam generation for the peeling and blanching of vegetables and the pasteurisation process within our Prepared division. The investigation, this and next year, is needed to reach Greenyard’s future target of 70% reduction by 2030. To speed up this process, government support could bridge the current gap on cost compared to natural gas. In the Netherlands this is already the case. Greenyard is an advocate that governments investigate similar regulations in other countries as well.
Within our transport activities, alternative fuels will be accountable for most of the savings towards 2030 and beyond. Certain regulations are likely to enhance the adoption of these new technologies, and there are government initiatives aimed at supporting this transition. Additionally, we will explore other interventions such as specific tire options and driver behaviour training.
For our cold storage, we focus on replacing older machine rooms whenever it makes sense from a technical and an economical perspective. This will ensure we replace cooling engines that still use refrigerant with a high global warming potential in the coming seven to ten years.
Building upon a first survey in the past financial year, we will further engage with suppliers to grow the number of suppliers committed to science-based targets. To this end, Greenyard is also supporting initiatives that provide farmers with tailored advice in this domain. Over the next three years the Klimrek-T project will assist Belgian farmers with climate and water scans to identify improvement areas and assess the financial and practical feasibility of climate adaptation and mitigation measures.
As the SBTi finalised its guidance for FLAG-targets earlier this year, we have started to measure our biogenic emissions in the supply chain and plan to submit our target for validation by the end of 2024. We will consider submitting a net-zero target for validation simultaneously.
82 / MESSAGE FROM OUR CO - CEO s | HIGHLIGHTS | GREENYARD’S RELEVANCE | FOOD OF THE FUTURE | PURE POWER OF PLANTS | DRIVEN BY PASSION & PEOPLE
Water consumption Water stewardship
Our approach
The cost of water, compared to that of energy or raw materials, is low. This sometimes makes it difficult to build a sound business case from a purely economical perspective. Greenyard takes its responsibility to reduce water usage from a strategic perspective, as we understand the true value of fresh water. Within our operations we focus on the optimisation of water usage and on cleaning and reusing processing water.
We measure water consumption and water discharge at all our sites. At sites where water usage is material, it is a standard procedure to take measurements on a daily basis. Constant monitoring ensures the quality of water effluent discharge is always in line with the standards of local regulations and permits.

The food production processes at Greenyard Prepared and Frozen use considerable amounts of fresh water. The same goes for our Convenience production lines at Greenyard Fresh Belgium, where we produce fresh-cut vegetables and salads. At other locations, like in our distribution centres, the water consumption is far lower. The water is used to wash, transport and process our products and produce steam for peeling, heating or preservation.
While Greenyard primarily focusses on internal water use, the availability of fresh water throughout our value chain is equally essential for the cultivation of fruit and vegetables. Within the chain, we map the water risk in the different areas where we grow our products. Understanding our water risk is key to optimise our footprint and where needed adapt the way we source our products.
Greenyard uses the WWF Water Risk Filter to assess the water-related risks of the different processing sites. Only one site, which depends for 90% on municipal (drinking) water and 10% on groundwater, is located in an area which is labelled as a water stress area (WWF Water Risk Filter water scarcity score >3). This site’s consumption accounts for around 3% of Greenyard water withdrawals. For this specific location, Greenyard started a project to enable the reuse of up to 75% of the processing water, saving significantly on the withdrawals. All other sites are in areas with low water stress. We aim to reduce our primary water use by 10% by 2025 from a 2019 baseline and achieve similar savings in water intensity.
/ 83 GREENYARD APPROACH | ENVIRONMENTAL IMPACT | SOCIAL IMPACT | ECONOMIC IMPACT & GOVERNANCE | GREENYARD AT A GLANCE | FINANCIAL REPORT
It is important to understand that Greenyard has absolute water reduction targets while its production can fluctuate. We are therefore measuring water intensity and also investigating to set targets on this. For example, weather conditions can cause a more complex harvest season resulting in smaller batches and more cleaning of production lines, which causes a higher use of water. Other types of products will influence water usage just as well.
By mapping our growers and using the WWF tool, Greenyard gives its sourcing departments insight into potential supply risks and creates awareness around this important topic. While we are strong at mitigating supply risks, thanks to our global sourcing capabilities, we acknowledge our responsibility to safeguard sustainable water usage throughout our supply chain. Around 34% of the volumes sourced by Greenyard originate from countries with water stress (WWF Water Risk Filter water scarcity score >3). When water is managed in the right way in relatively dry areas, this can be the best environmental choice for some products. Dryer areas in general have a lower pest pressure resulting in lower use of crop protection products. We seek to support growers to work more efficiently and assist with certification where needed.
Greenyard discloses its water-related risks and impact in detail under the terms of CDP (water security) and we have received the score B in 2022.
Our progress
This year, Greenyard consumed 3,99 million m³ water in its own operations, a decrease by 4,2%. This reduction can mainly be attributed to lower processed volumes and an increased emphasis on conserving water. Smaller batches in production, due to a very dry summer period, did demand extra efforts in production. Considering our expectations and the goals set for 2025, we find the current savings to be in alignment. Greenyard has taken the next steps in major water reuse projects within both our Frozen and Prepared divisions, as well as within Fresh Belgium.
For the Fresh Convenience operation in Sint-KatelijneWaver, we signed an LOI with Pidpa (a municipal water supplier) to work on the design and permits for an on-site water purification plant to reuse up to 75% of the processing water. For our Belgian Prepared and Frozen sites, we are investigating options together with suppliers and industry experts. For the sites of our Frozen division in the United Kingdom and Poland we also took actions to lower the water use.
Greenyard has committed to map the water risk for its entire grower base by 2025. During our fourth year the focus was on various Greenyard Fresh business entities, bringing the coverage to 85% of our suppliers. Steady progress is expected in the next years, reaching 90% next year and 100% by 2025.
reuse of processing water
LOI with Pidpa (a municipal watersupplier) to work on the design and permits for an on-site water purification plant
Greenyard takes part in the Sustainability Initiative for Fruit and Vegetables (SIFAV). Under SIFAV, all private sector partners commit to actively promote best water practices, water use efficiency, and collective action in three jointly selected catchments. Ica in Peru was selected as the first catchment for collective action. Next to aligning our approach to support responsible water management, Greenyard and four other SIFAV members and the SIFAV Secretariat have, with co-funding of IDH, decided to move towards action and fund several engagement activities with Ica suppliers and the wider group of SIFAV partners in Europe.
Moreover, a pre-selection of possible projects that contribute to the resilience of the Ica catchment was presented in March, from which the infiltration ditches upstream in the Ica catchment was selected for developing a full project plan.
84 / MESSAGE FROM OUR CO - CEO s | HIGHLIGHTS | GREENYARD’S RELEVANCE | FOOD OF THE FUTURE | PURE POWER OF PLANTS | DRIVEN BY PASSION & PEOPLE
Future plans
In the coming years, Greenyard will focus on locations with the highest water usage to further develop the defined projects. More specifically, these are our Prepared site in Bree and our Frozen site in Westrozebeke, both situated in Belgium. In the coming year, this should lead to more specific plans and business cases for these projects. Next to this, all other Frozen locations will investigate saving and reusing water. We are rolling out similar plans for some smaller water reuse or saving projects.
The engineering, permitting and contracting phase for the water purification plant for Greenyard Fresh Belgium will be done within the next financial year. This should lead to a final decision on the realisation of this plant.
Greenyard will continue its progress on its grower mapping and will roll out the implementation of water standards across the group. Within our participation in the Sustainability Initiative for Fruit and Vegetables (SIFAV) we are already working on the implementation of water standards for 70% of volume from high water-risk countries towards 2025. The SIFAV basket of standards was agreed last year, along with the list of risk countries. Elsewhere we look forward to supporting the execution of the Ica catchment project, provided the funding among the different project partners can be agreed in the coming months. It would be the first multi-value chain project managing shared water risks.

/ 85 GREENYARD APPROACH | ENVIRONMENTAL IMPACT | SOCIAL IMPACT | ECONOMIC IMPACT & GOVERNANCE | GREENYARD AT A GLANCE | FINANCIAL REPORT
Water consumption (m³) by division 8% 59% 33% Overall water risk Greenyard volumes (based on score country of origin) Low risk (≤ 2,33) Medium risk (> 2,33 and < 3,66) High risk (≥ 3,66) 39% 59% 2% Fresh Frozen Prepared
Circular economy
Food waste & circular economy

More than 99% of packaging is recyclable
Greenyard focusses on avoidable food waste and is committed to reduce all avoidable food waste to a minimum. The same goes for other waste streams such as packaging materials. Preventing waste of perishable goods can be challenging, and packaging can be a sensible solution for certain products. Factors such as weather conditions during growth and harvest can influence the quality of the goods and with that raise the risk of potential food waste. Given these limitations, we are convinced our business model is the best possible way to prevent food waste. With our Integrated Customer Relationship model (ICR), we establish an efficient connection between our customers’ demands and the actual production of fruit and vegetables by our growers. This collaborative approach allows us to maintain in close contact and act as a connecting partner between various value chain partners, before and during the growing season.
Our approach
Greenyard has waste collection systems at all its operating sites which comply with local legislation and related standards. Our primary focus lies in waste prevention, together with our customers and our suppliers. We strive to maximise recycling or valorisation and ensure the closure of material loops for all waste streams. This is the case for all other regular waste types such as cardboard, paper, plastics, residual waste, as well as for bio-waste and by-products.
At Greenyard, we have separated the reporting of our by-product streams from food waste this year. Particularly for larger by-product streams, we already have sustainable solutions to transform them into feed. Additionally, we are exploring alternative options to maximise the value of these streams. Most of our by-products stem from the processing operations of our Frozen and Prepared divisions, encompassing peelings from carrots, potatoes, and peas, among others. If these by-products are unsuitable for human or animal consumption, they are diverted towards bio-fermentation or composting. If we have any overstocks (due to lower-than-expected demands for example) that cannot be sold to customers, we always try to ensure this is kept within the food chain for example by delivering them to food-processing companies or to food banks. In the past year we donated around 4 million kilograms of fruit and vegetables to food banks and charities.
Our Fork-to-Field approach is a first and important baseline to optimise the value chain and prevent food waste. This approach works best in strategic partnerships with customers, where all relevant data is shared. By comparing these models, we can determine that our most comprehensive ICR models have the lowest amount of food waste within our portfolio. Therefore, we try to convince our customers as much as we can to team up with us to implement customised ICR models.
86 / MESSAGE FROM OUR CO - CEO s | HIGHLIGHTS | GREENYARD’S RELEVANCE | FOOD OF THE FUTURE | PURE POWER OF PLANTS | DRIVEN BY PASSION & PEOPLE
Our progress
In the past year, Greenyard generated around 193 000 tonnes of by-products and waste, this is a decrease of 2% compared to last year. Around 58% of this is re-used. The main destination for these by-products is animal feed. To further grow our recycling efforts and volumes, we collaborate with specialised waste management companies. Sometimes, recycling options are hindered when materials that are usually recyclable – such as paper, carboard, and plastics – have been in contact with food. Good internal collection systems are crucial. We have put extra focus on the quality of separate collection on the floor and will continue to do so. This includes simple adjustments like harmonising the colour of the waste bins or provide instructions in multiple languages and with pictures.
Greenyard continuously investigates new options to prevent food waste, including tests with forecasting tools. This is not an easy one for fresh produce, as it is perishable, and quality depends on a lot of different parameters. Next to this, the demand is influenced by different parameters such as weather, events, and promotions, which are easier to predict using forecasting models. During the testing phase, our organisation relies on internal planning and forecasting departments to make informed decisions. Moreover, the scheduling of employees for order-picking, packing, and transportation depends on accurate forecasting of demand and supply as well.
In the past year, Greenyard continued trials with different shelf-life extension technologies. Various types of coatings were tested, some of which have shown promising results. However, it is important to note that these technologies come with additional costs which must be compensated by a longer shelf-life. Additionally, we have been focussing on measuring the potential shelf-life of fruits based on their characteristics, allowing us to give better advice on shelf-life to customers. The combination of our efforts should result in a further reduction in the coming years.
/ 87 GREENYARD APPROACH | ENVIRONMENTAL IMPACT | SOCIAL IMPACT | ECONOMIC IMPACT & GOVERNANCE | GREENYARD AT A GLANCE | FINANCIAL REPORT
Plastic packaging Corrugated board packaging Metal packaging Glass packaging (Food) waste 0,3% 58% 38,6% 3,1% Waste to be re-used Waste for recycling Waste for energy recovery Landfill or incineration without energy recovery Packaging material mix (by weight) 15% 61,7% 7,4% 15,8%
Aside from food waste, Greenyard aims to have 100% of its consumer packaging recyclable by 2025. Most of the packaging is prescribed by our customers. This year, we used about 65 532 tonnes of consumer packaging for our products. The main packaging materials consist of plastics and cardboard in the Fresh division, plastics in the Frozen division, and steel cans and glass in the Prepared division. Further efforts in using recyclable packaging alternatives result in a share of recyclable consumer packaging of 99,5%.
The only packaging that Greenyard currently uses, which is not 100% recyclable, are the stand-up pouches for soups and sauces. This type of packaging is increasingly popular because of its low weight, which results in a better footprint concerning transport. We are convinced that within the coming years packaging producers will also find sustainable solutions for the pouch packaging. Greenyard is actively participating in a number of trials for this.
Future plans
Greenyard will continue the pre-mentioned projects on forecasting demand and supply. Within the coming financial year, we will map characteristics of different waste and product flows even better to understand and find possibilities for valorisation. Elsewhere we are closely following research projects initiated by Wageningen University and Flanders Food aimed at developing toolboxes to assist food operators in reducing food waste.

On packaging we expect the stand-up pouches research project, which we started in 2022, to be finalised. Meanwhile we have joined the TACTIC research project led by Pack4Food and Flanders Food focusing on assessing and communicating the sustainability of packaging. We stay committed to use 100% recyclable consumer packaging by 2025. Furthermore, we will also investigate upcoming EU and national legislation on plastic packaging in relation to food and fresh fruit and vegetables in particular. When we use packaging, we use it to protect the products and to ensure a better shelf-life. While Greenyard supports the vision to use as little packaging as possible, it is important to ensure this does not affect shelf-life and generate additional food waste. We believe policy makers should focus on minimising food waste while maximising high-quality recycling of packaging (either through selective collection methods or via recycling technology). This could have a better effect than to focus solely on lowering the amount of plastic packaging.
Greenyard has already achieved its goal of having 30% recycled content in (non-)food packaging by 2030. In fact, the percentage of recycled content in both our metal and glass packaging is even higher. Nevertheless, we will investigate new goals in coming years, working towards 2030 and in line with EU policies.
88 / MESSAGE FROM OUR CO - CEO s | HIGHLIGHTS | GREENYARD’S RELEVANCE | FOOD OF THE FUTURE | PURE POWER OF PLANTS | DRIVEN BY PASSION & PEOPLE
Good practices Sustainable agriculture & biodiversity
All of the approximately 2,6 million tonnes of fruit and vegetables Greenyard sources worldwide each year, are compliant with regulatory requirements in the EU and the country of origin. Every piece of fresh produce that enters our value chain should therefore be produced in a sustainable manner. We acknowledge that the sector can further improve, particularly in the area of biodiversity (resulting in further optimisation of the use of fertilisers, crop protection and water).
Our approach
Greenyard requires growers to adopt good agricultural practices and obtain certifications, including GlobalGAP and FSA. These include integrated pest management in which best practices and new regulations continue to evolve. Based on more stringent regulations we also see innovative products in terms of biological control and more pest resistant varieties. While Greenyard does not own any farmland itself, it does play a connecting role between the various stakeholders, for example by teaming up with suppliers to test new varieties or more sustainable products.
A lot of the growers Greenyard works with are already partners for a long term. For both Greenyard Frozen and Prepared the connection to growers is often established via contract growing. In the case of our Prepared division and for some locations of our Frozen division this is organised via a producer association. This enables us to help improve agricultural practices, share best practices and collaborate with growers to improve product quality and ensure availability, especially regarding crops that could be more impacted by climate change.
Within Greenyard’s Fresh division, we have many longterm Integrated Grower Relationships with both producer groups and individual growers. We expect growers to align with relevant standards but leave the production as such
6,5% organic
to the growers. Within our total pool of growers, we also support programs to transform towards more regenerative, sustainable or organic farming. The cooperation can go as far as establishing dedicated producer groups to further develop organic production for international markets,or improve quality and production standards as we did in Italy. In some specific areas – such as Latin America and Africa – we engage (often together with partners) in capacity-building with smallholders by informing or educating farmers to prepare them for certification.
Greenyard commits to zero-deforestation in its supply chain by 2025. While deforestation risks for fruit and vegetables are generally considered as a low to medium risk, Greenyard is mindful of any risks related to deforestation. It could be argued that packaging materials like paper and cardboard may have an impact on deforestation. Although packaging is often prescribed by our customer, we focus on utilising FSC, PEFC or similar certified paper and cardboard. Greenyard discloses its forestrelated risks and impact in detail under the terms of CDP (forests) and it received the score C in 2022.
Our progress
Within the current market we see some pressure on organic sales within retail. Still, we can report that our own share in organic remains stable, representing around 7% of Greenyard Fresh volumes and more than 4% of Greenyard Prepared and Frozen volumes. Despite organic produce having a clear standard and description today, we also notice and acknowledge that conventional production is increasingly focussing on sustainable agriculture.
Greenyard is developing a biodiversity policy together with its agronomy experts. We have decided to take extra time to develop this policy and to publish a first version in 2023. That way we will be able to take along the learnings from our participation in the Biodiversity Action Lab of
/ 89 GREENYARD APPROACH | ENVIRONMENTAL IMPACT | SOCIAL IMPACT | ECONOMIC IMPACT & GOVERNANCE | GREENYARD AT A GLANCE | FINANCIAL REPORT
The Shift in Belgium, the many tests and projects we have been involved in over the past few years, and the Better for Nature & Farmer program that we actively support in The Netherlands.
Over the past year, there have also been various tests and initiatives regarding sustainable agriculture. These include assessments of soil quality, implementation of precision farming techniques through digital tools for mapping and providing guidance to farmers, as well as testing with new varieties. In response to customer demands and intensified regulations, Greenyard is setting up initiatives to minimise the usage of crop protection and fertilizers in various projects. Elsewhere biodiversity, deforestation, soil degradation and the use of fertilisers and pesticides are included in the risk assessment framework which form an integral part of Greenyard’s sustainability due diligence approach.
Future plans
An important part of Greenyard’s future plans is to develop a biodiversity policy and set up the measurements that are needed to manage this policy. The policy
Biodiversity – using the power of our natural ecosystem
Andreas Nesseler is a German farmer who has been growing peas for Greenyard Prepared for many years. A couple of years ago, he decided to make the shift to organic farming. “I am running the farm together with my son, who convinced me to make the switch, following his positive experiences with organic farming during his education.”
“We had to completely rethink the way we did things. The importance of biodiversity is huge – we completely depend on our ecosystem to feed the
as such is now set for 2023, measurements are to be in place in the next two years. Moreover, we plan to set science-based targets for nature (SBTN) by 2025.
As we already make use of the WWF Risk Filter to map our suppliers in terms of water risk, the recently added feature to assess biodiversity risk will enable to gain further understanding of the biodiversity risks in our supply chain. We will disclose our supply chain’s biodiversity risks as from next financial year.
We will continue working on various joint programs with our customers, such as the Better for Nature & Farmer program in The Netherlands. Additionally, we will expand this way of working towards the broader supply chain for fresh produce. In Greenyard’s Long Fresh segment, we will continue to work closely with farmers and grower associations.

Our biodiversity policy will continue to focus on pragmatic ways to move towards regenerative agriculture. This should ensure a sustainable food chain and a good match between ecology and economy. The digital tools we are currently testing, should ultimately result in a more standardised way of working with our growers in our Long Fresh division.
soil. Your farm suddenly looks very different, with smaller fields to change crops faster and the presence of bee hotels, flower beds, small trees and sandheaps. It’s a bit like going back to the way people did things in the past, but it’s a great sight to behold when I make my daily round on my bicycle.”
90 / MESSAGE FROM OUR CO - CEO s | HIGHLIGHTS | GREENYARD’S RELEVANCE | FOOD OF THE FUTURE | PURE POWER OF PLANTS | DRIVEN BY PASSION & PEOPLE
ORGANIC FARMING
Geothermal energy for sustainable tomatoes

Harting Holland is a family-owned tomato greenhouse in the Westland region of the Netherlands and has been a long-time supplier for Bakker Barendrecht, a Greenyard company. Since 2014, they have been using geothermal energy to produce heat for its greenhouses, saving almost 10 million m3 of gas every year, the equivalent of 18 000 tonnes of CO2 .
“As a family business we are always taking a longterm view to safeguard a sustainable future for our business. We started looking into geothermal energy as early as 2008, when our sector was confronted with an energy crisis, very similar to what has happened recently in Europe. It became very clear we needed to phase out our dependence on fossil fuels,” says business owner John Harting
“Together with our neighbour grower, we drilled a geothermal well of 2 500 metres deep into the porous layers of an old sand riverbed running below our respective sites. The water, which has a temperature of 87 degrees at this depth, is pumped up and fed through heat exchangers, which allows us to heat the greenhouses with clean fossil-free energy. The cooled water is then pumped back into the earth, where it is reheated over time. Today, about 90% of our heat demand is covered by geothermal energy. We only use other energy sources during the coldest periods of the year.”
“Since then, many other geothermal sources have been developed in our region, with plans to develop a connected heat network where energy can be shared between businesses and even used to heat the homes of families from nearby villages and cities. This perspective makes us even more proud of our pioneering work.”
/ 91 GREENYARD APPROACH | ENVIRONMENTAL IMPACT | SOCIAL IMPACT | ECONOMIC IMPACT & GOVERNANCE | GREENYARD AT A GLANCE | FINANCIAL REPORT
GEOTHERMAL ENERGY

92 / UNLEASHING THE PURE POWER OF PLANTS
Social impact

/ 93 GREENYARD ANNUAL REPORT 2022/2023
An important social aspect of our sustainability strategy is ensuring the availability and affordability of the healthy products that we bring to the market, whether in fresh, frozen or prepared format. Through the active promotion of fruit and vegetables, we stimulate consumers to increase the share of fruit and vegetables in their daily diets. This benefits their own health and results in lower healthcare costs in the long run. To do our part, we constantly keep in mind the accessibility and convenience of our products, ensuring the healthy choice is also the easy one.

Ecology (environmental impact) and affordability can be a balancing act in the short term. Greenyard acknowledges this and teams up with farmers to support their compliance efforts, always keeping the longterm benefits and needs in mind.
More and directly tangible are the social aspects happening today and impacting all people involved in our food supply chain. We have established our policy in this respect with our internal Code of Conduct and our external Supplier Code of Conduct. We prioritise fostering an environment of respect for all individuals involved in the food value chain, placing particular emphasis on ensuring safe working conditions and fair wages. We expect that those collaborating with us, directly or indirectly, adopt a similar approach, and we exclusively engage with suppliers who comply to social laws and regulations, and commit to enhancing their performance in this regard.
MESSAGE FROM OUR CO - CEO s | HIGHLIGHTS | GREENYARD’S RELEVANCE | FOOD OF THE FUTURE | PURE POWER OF PLANTS | DRIVEN BY PASSION & PEOPLE 94 /
Code of Conduct Responsible sourcing
> 80% certified growers
Greenyard expects all its employees to value and respect anyone who works with us, safeguard human rights and be conscious about any impact our activities have on the environment. These expectations have been listed more explicitly in our Code of Conduct and translated for our suppliers in a Supplier Code of Conduct which was introduced in 2022 and is being rolled out in 2023.
Greenyard actively focuses on social standards, responsibility, transparency and traceability, in close collaboration with growers and suppliers. We consider certification on social standards as a first and important line of defence. We are further embedding the safeguarding of human rights with regards to risk analysis and due diligence. This is done in line with our own values and guided by the upcoming EU Corporate Sustainability Due Diligence Directive (CSDDD) and the increasing demands from our customer.
Our approach
Our company sources more than 2,6 million tonnes of fruit and vegetables worldwide each year. Around 47% of our volumes originate from high- and medium-risk countries (SIFAV classification based on World Governance Indicators), driven largely by overseas volumes from the Fresh division. We have the clear ambition to get 100% of our grower base in high-risk origins certified for social compliance by 2025 and in medium-risk origins no later than 2030.
While we actively push for social compliance as a prerequisite for doing business with us, we also want to give growers time to work on their certification(s). Actively working towards full compliance is very important, as is the willingness of suppliers to acknowledge and report shortcomings. Within our Supplier Code of Conduct we do request all current and future suppliers to confirm their
compliance with international and national employment legislation and to adhere to the international instruments dealing with human rights, children’s rights and responsible business conduct.
As established in the way of working we developed within SIFAV, we are using a risk-based approach. Within SIFAV a clear list of comparable standards is agreed with all partners requesting more stringent certifications in high-risk countries compared to medium-risk countries. We ask our suppliers to assure social compliance using assessment tools and certification schemes included in the SIFAV basket of social standards (including GRASP, Rainforest Alliance and SA8000).
A broader Group Sustainability due diligence approach is under development. It is based on OECD Guidelines for multinational enterprises and will be compliant with the German Supply Chain Due Diligence Law and the upcoming EU CSDDD. This approach looks beyond the human rights impact in the food supply chain and also includes the environmental impact, both with food suppliers and other suppliers (including transport and packaging), as well as our own operations.
Our progress
Today about 82% of our growers based in high-risk countries are certified on social compliance, on track with our target of 100% by 2025. For medium-risk countries the share is also around 79%, with an action plan being rolled out in our Polish operations to gradually increase the number of certified growers over the coming years. Combined this leads to a little over 80% certified growers in high and medium risk countries. Fair Trade represents about 2% of Greenyard Fresh volumes, in line with the overall market. The number also reflects what our customers request us to source.
/ 95 GREENYARD APPROACH | ENVIRONMENTAL IMPACT | SOCIAL IMPACT | ECONOMIC IMPACT & GOVERNANCE | GREENYARD AT A GLANCE | FINANCIAL REPORT
Following the introduction of our Supplier Code of Conduct last year, we are further shaping our sustainability due diligence approach. We developed a risk identification and assessment framework for food suppliers starting with the entities supplying the German market. Within the framework of SIFAV a risk assessment methodology and an online tool have been developed covering 18 ESG risk domains which we use as a basis for our risk analysis. Greenyard also joined SEDEX as a buying member at Group level enabling further risk assessments for our non-food suppliers and our own operations.


Preventive and mitigation measures have been identified for the relevant risks. These will be further formalised as part of our Group sustainability due diligence approach and where relevant also in our Supplier Code of Conduct. While certifications play a key role in our prevention measures, we also conduct on-site visits and, upon request from our customers, second-party audits with our suppliers to gain first-hand experience of their growing practices and working conditions. We have also conducted a trial to conduct third-party sustainability audits with suppliers to ensure the effectiveness of our due diligence approach. Elsewhere a comprehensive training package from EcoVadis Academy is being rolled out among all Sustainability Ambassadors.
Projects to improve living wages and income for farmers projects have been carried out in close cooperation with retailers. We do need the help of retailers to keep these
projects alive and further develop methods to ensure that the extra income of living wage projects go to the workers on the different farms.
We have visited the Global Child Forum (GCF) conference to learn from other companies on this topic and how this can be integrated in our policies on human rights. We have always considered children’s rights as an integral part of human rights but decided upon the learnings from conversations with GCF to also take in the context of the UN Convention on the Rights of Children (CRC) and the UN Children’s Rights and Business Principles as an integral part of our Supplier Code of Conduct explicitly. An important part we learned from discussion with GCF and other companies is the broader view on Children’s rights. Where we have always put focus on human rights in general and the prevention of child labour we will work more on the broader view of workers and their families, education and the positive impact of our products on human health.
Future plans
We plan to finalise our Group Sustainability due diligence approach over summer and take along the learnings from the German Supply Chain Due Diligence Law (LkSG) implementation as of 2023. Greenyard is in the process of rolling out a new supplier approval tool (Agriplace) to assess our growers in a standardised way. The first countries using this tool supply the German market where this will be used to monitor compliance with risk prevention and mitigation measures, in line with the LkSG.

96 / MESSAGE FROM OUR CO - CEO s | HIGHLIGHTS | GREENYARD’S RELEVANCE | FOOD OF THE FUTURE | PURE POWER OF PLANTS | DRIVEN BY PASSION & PEOPLE
Social compliance: beyond ticking all the boxes

“Ensuring social compliance within our supplier base is a crucial part of Greenyard’s sustainability strategy. At Bakker Barendrecht we have made a clear commitment to have 100% of our volumes sourced in high-risk countries compliant to the BSCI social standard or equivalent, and those in medium-risk countries before 2030. With well above 80% of growers in high-risk countries already certified across all suppliers to Greenyard, we are well on our way to reach our 2025 target,” says Frank Brinkman, Strategic Sourcing Expert at Bakker Barendrecht, a Greenyard company.

“At the time we started to work on social compliance for suppliers in medium-risk countries, we first looked at the definition of medium-risk countries. We decided to go beyond the definition as set out by the United Nations. Recent reports have found malpractices in many allegedly low-
risk countries, even within the European Union. The situation is especially precarious in countries where many migrant workers are active, as they are often dependent on their employers not just for their income but for their housing as well. That’s why we are adding a larger number of countries to our medium-risk list.”
“Moreover, we believe the audits and assessments that are being carried out should be more than just ticking the boxes in a checklist. In specific cases, on top of social audits, more in-depth assessments by third-party organisations are carried out. Including observations in the field and surroundings of companies and interviews with workers and other stakeholders. It’s the only way to make sure the paperwork matches what actually happens in the field.”
/ 97 GREENYARD APPROACH | ENVIRONMENTAL IMPACT | SOCIAL IMPACT | ECONOMIC IMPACT & GOVERNANCE | GREENYARD AT A GLANCE | FINANCIAL REPORT
SUSTAINABILITY STRATEGY
Nutritional value Health & nutrition
Fruit and vegetables bring a great combination of high nutritional value, fibres, minerals and vitamins that are essential to our well-being. The recommended daily consumption of fruit and vegetables as published by the EU, national policy makers as well as science partners, is significantly higher than the average intake per capita. This means there is a good match between sustainability and economy for Greenyard, as there is growth opportunity with a positive impact on health and well-being, if the consumption grows via our customers (retail and food service).
The EU Green Deal promotes sustainable food consumption and a shift towards healthy, sustainable diets. A diet with less red and processed meat and more fruit and vegetables will not only reduce the risk of life-threatening diseases, but it will also reduce the negative environmental impact of food production systems.
Our approach
Our job is to ensure fruit and vegetables are available and affordable to all and are well presented, ensuring the healthy choice is also an easy and convenient choice. By offering our customers full category management and a strong product range in Fresh, Fresh convenience, Frozen and Prepared we team up with them to grow the category. We offer a year-round attractive assortment in Fresh, including meal-kits, fresh-cut vegetables and salads. Our Prepared and Frozen divisions turn fruit and vegetables into convenience products, always available, independent of the season.
In ready-to-heat meals within our Frozen and Prepared division the meals are seasoned and can include salt, sugar or fats. Here we continue our efforts in further reducing sugar levels in new product and recipe developments, in close cooperation with our customers.
Greenyard also takes part in initiatives to promote pureplant proteins as we are able to produce these products that have a positive impact on health and sustainability.
Our progress
We do not have a specific KPI on Nutriscores. As a private label company, we develop recipes together with our customers which is always a combination of taste, nutrition value, quality and price. A (high) Nutriscore is usually part of this.
Within our Fresh division all fresh products would get a Nutriscore A, as these products are 100% pure-plant. In our Frozen division, the majority of products has an A-score as they are only shortly blanched and frozen directly after harvesting and washing. Most of our ready-to-eat meals or combinations have either an A- or B-score. Some products – mostly those which include a cheese-type or creamy sauce, or cream soups – will still be a Nutriscore C. We are looking into various ways to also improve the scores on these specific products, for example by rethinking the recipes where possible. Within our Prepared division this will also be the case for some specific sauces and dips.
originate from fruit & vegetables
98 / MESSAGE FROM OUR CO - CEO s | HIGHLIGHTS | GREENYARD’S RELEVANCE | FOOD OF THE FUTURE | PURE POWER OF PLANTS | DRIVEN BY PASSION & PEOPLE
of revenues
Greenyard signed a five-year partnership with We’re Smart, the world’s foremost culinary reference for fruit and vegetables. For the next five years, both companies will further accelerate the active promotion of sustainable and healthy eating, through the pure power of plants. They will join forces to encourage consumers around the world to make smarter food choices and at the same time reduce their carbon footprint. In their joint ambition to accelerate the transition towards healthier diets for all, they will support consumers by, amongst others, sharing easy to create pure-plant food experiences through a variety of channels as well as collaborating on pure-plant food innovations in the coming years. A first initiative was the launch of a new Instagram-channel, @greenyard.stories, to inspire end consumers on how to create delicious, more sustainable and healthy meals.

Future plans
We will continue to promote the consumption of fruit and vegetables, both via our own channels and in close cooperation with our customers.
Through voluntary efforts and covenants with authorities, the industry has systematically reduced the amount of added salt and sugar, making these products healthier. An important challenge is to ensure the taste remains at a similarly high level. Most of these product adjustments have been done already in the past years, and we will continue to invest time and effort in new and better recipes.
While the choices for specific products are always made in close cooperation with our customers, we aim to start reporting on the Nutriscores of our products in the coming years knowing already that a high percentage will be in A- or B-scores and the ones in C or lower will take efforts to change.
We expect to further expand our product range with healthy, accessible, and convenient products. In May 2023 Greenyard expanded its pure-plant product range with the acquisition of the Dutch – Italian start-up Gigi Gelato. A game-changing brand that pairs fruit and vegetables in innovative ways, to create a healthy alternative to the traditionally indulgent gelato. Gigi Gelato offers a pure-plant food experience, with no dairy, additives, or artificial aromas.
/ 99 GREENYARD APPROACH | ENVIRONMENTAL IMPACT | SOCIAL IMPACT | ECONOMIC IMPACT & GOVERNANCE | GREENYARD AT A GLANCE | FINANCIAL REPORT
Investing in our talent Talent attraction & employee development
Greenyard offers a wide range of formal and informal training programmes to its employees and this in the local entities as well as on Group Level. Training of our employees needs to ensure is essential for enhancing skills, improving productivity, fostering employee satisfaction, adapting to change, ensuring quality, mitigating risks, and promoting career development.

During the COVID period, we got acquainted with many new ways of working. We collaborated more online or where possible in a hybrid format with part of our employees working in our offices and others from home. We identified a risk of becoming less attached to the company working this way, and increased communications and introduced specific programs for talent and leadership development across the different divisions. Live meetings with our senior management were resumed, to further boost connection and cooperation.
This year we report an average of ten hours of training for each employee. This may seem like a low number, but it excludes the many knowledge sharing sessions for specific roles across the divisions and entities, such as sustainability or quality functions. We also put extra focus on giving different departments and teams the possibility to present their strategy and goals in meetings with other departments and colleagues.
To attract and retain our young talent, we have a traineeship in one of our divisions. This comes with an extensive program for young graduates and enables them to do a few different assignments during a period of almost two years. We aim to take the learnings of this program and develop similar approaches for other divisions. 80 nationalities
100 / MESSAGE FROM OUR CO - CEO s | HIGHLIGHTS | GREENYARD’S RELEVANCE | FOOD OF THE FUTURE | PURE POWER OF PLANTS | DRIVEN BY PASSION & PEOPLE
21% 79%
Diversity of our management
Diversity & Inclusion
Greenyard respects diversity in all its forms – nationality, religion, culture, language, age, gender and sexual preference – and ensures equal opportunities for all its employees. We focus on the evolution towards a gender balance at all levels and at retaining employees across all age categories by providing a supportive work environment. As a global player in fruit and vegetables, Greenyard’s workforce is socially diverse with more than 80 different nationalities working in the various divisions.
If we consider our top management, we aim to have managers with a strong background on specific topics or within our sector. At the same time, they should be result-oriented while understanding of the importance of well-being and development of our people. Being a people-oriented company goes hand in hand with being performance-driven as long as we empower our people to be able to perform to the best of their ability. We also want our organisation to be a safe haven, where people find trust and support.
Looking at diversity and inclusion within our top management and senior management we have two main conclusions. Looking at the smaller group of directors
who report to our CEOs and our CFO we can only conclude that we need to give more attention to this topic as this group consists of mainly Western-European males. We do have a good variety in different ages. At other levels of the organisation, we do already have a better mix and a reasonable balance between male and female managers. Within our headquarters, which needs to be a connecting link to all our entities, we have a diverse workforce and a good mix of gender, nationality and age. Here the international character of our company is well reflected. Being situated close to Brussels and Antwerp with a lot of international workers helps to find the right people.
As diversity and inclusion are important to us, we will further develop a strategy to ensure that we have the right balance within the management of our company. We aim to work towards a better balance with the top layers of our organisation. Greenyard also aims to be an active provider of social employment, for which we have many opportunities in different levels of our organisation.
/ 101 GREENYARD APPROACH | ENVIRONMENTAL IMPACT | SOCIAL IMPACT | ECONOMIC IMPACT & GOVERNANCE | GREENYARD AT A GLANCE | FINANCIAL REPORT
Female, blue collar Male, blue collar Female, white collar Male, white collar < 20 y 41 – 50 y 21 – 30 y 51 – 60 y 31 – 40 y 61 – 70 y Diversity of our employees 48% 21% 18% 13% 25% 29% 16% 1% 5% 25%
An important aspect is ensuring a safe haven for all our workers. We take a firm stand against any form of bullying, racism, discrimination, harassment, violence, exclusion and negative behaviour among employees. It goes without saying that any illegal and unethical business practices are unacceptable. While this is clearly laid down in our Code of Conduct, we continue to ask extra attention for this and we encourage our employees to speak up if anything should happen that is not in line with our policy. This is being enabled and supported by dedicated communication campaigns and a whistleblowing tool that is accessible to the entire workforce.
It is elementary that all our colleagues not only feel safe and comfortable within our company, but also help to create and safeguard an open and inclusive culture. In 2022, we launched an extensive internal campaign in all our global entities, and across our approximately 8 500 employees. The aim is to motivate people to speak up when they see or experience inappropriate and unethical behaviour – whether it is someone being bullied or discriminated against, or someone compromising the quality of our products or favouring one of our suppliers. In 2023 a follow-up campaign has been launched to further raise awareness.

102 / MESSAGE FROM OUR CO - CEO s | HIGHLIGHTS | GREENYARD’S RELEVANCE | FOOD OF THE FUTURE | PURE POWER OF PLANTS | DRIVEN BY PASSION & PEOPLE
Responsibility Health, safety & well-being
As a responsible company, we always prioritise the health and safety of our employees. Regardless of their job, role or function, everyone must feel protected and safe at work. But in a broader sense, we also want our company to be a safe haven. We expect a lot from our people, but we also need to give back. We want our organisation to be like a second home, where people find trust and support to perform to the best of their ability.

All Greenyard sites have Employee Health and Safety policies in place, in line with the context of the location and the activities. A Group Health and Safety Manager was appointed in 2022 to coordinate actions across different divisions and actively work on the development of a safety culture, measuring performance in a standardised way and exchanging best practices.
We are working actively to minimise the number of work accidents and strive towards zero accidents and especially a zero-accident culture. To measure our progress, we track the number, frequency rate and severity of accidents on our sites. The number of work accidents with lost time decreased by 14%, whereas the frequency rate decreased by 1,5%.
Next to safeguarding the physical health of our people, Greenyard is dedicated to prioritising the well-being and mental health of its employees. In the framework of Happy Healthy Greenyard , various initiatives have been taken. Including resilience and stress management workshops, but also creating opportunities to connect and boost team spirit through participating in sports events, after work drinks and other informal gatherings. By fostering a culture that values the well-being of our employees, we aim to enhance their overall job satisfaction, productivity, and long-term success within the organisation.
/ 103 GREENYARD APPROACH | ENVIRONMENTAL IMPACT | SOCIAL IMPACT | ECONOMIC IMPACT & GOVERNANCE | GREENYARD AT A GLANCE | FINANCIAL REPORT 2018 / 2019 2019 / 2020 2020 / 2021 2021 / 2022 314 306 316 295 Evolution work accidents with lost time
2022 / 2023 256
Taking valuable lessons from every incident
“Through the establishment of our Health and Safety Community, we continue working on a true safety culture within Greenyard. This community enables our local prevention managers to share their expertise across different divisions and sites and take lessons from every incident that occurs. Since we use a variety of ‘rolling transport’ like forklifts, reach trucks and electrical pallet trucks (EPT), risks related specifically to these types or internal transport are therefore one of our top priorities,” says David De Bruyn, Group Health & Safety Manager.

“Handling perishable goods means we need to be flexible in our operations. We are often working with temporary colleagues and depending on the season and the products that are coming in, we
have to completely reset machines and production lines. All these elements come with their own specific safety hazards.”
“By sharing experiences within our Health and Safety Community, we can leverage the knowledge we have in our company and implement best practices across the different sites. It also enables us to take valuable lessons from every incident. In many sites, we are making progress on implementing a Fast Intervention Team (FIT) that investigates major incidents on-site: what happened exactly, why did it happen, and most importantly how can we prevent it from happening again? Every incident is reported and discussed among the community, so everyone can learn from it.”
104 / MESSAGE FROM OUR CO - CEO s | HIGHLIGHTS | GREENYARD’S RELEVANCE | FOOD OF THE FUTURE | PURE POWER OF PLANTS | DRIVEN BY PASSION & PEOPLE
HEALTH & SAFETY COMMUNITY
Engagement
Local community engagement & citizenship
We are all part of society – this is also true for our company. Our ambition is to improve life – through our pure-plant products, our added-value services and our connecting role in the food value chain. We can only fulfil this role if we also support our local communities as best as we can. In many of our entities, we collaborate with local food charities by providing them with surplus food that we cannot supply to our customers but is still perfect for consumption. In this way, we also try to provide the most vulnerable people in our society with great, pure-plant food.

/ 105 GREENYARD APPROACH | ENVIRONMENTAL IMPACT | SOCIAL IMPACT | ECONOMIC IMPACT & GOVERNANCE | GREENYARD AT A GLANCE | FINANCIAL REPORT

106 / UNLEASHING THE PURE POWER OF PLANTS
Economic impact & governance

/ 107 GREENYARD ANNUAL REPORT 2022/2023
Our Greenyard Code of Conduct clearly defines how we expect all our employees to act in a responsible, ethical and legally compliant way. The Code links back to globally recognised principles, including the Universal Declaration of Human Rights, the UN Sustainable Development Goals, UN Global Compact, the International Labour Organisaton (ILO) Declaration on Fundamental Principles and Rights at Work, the OECD Guidelines for multinational enterprises and the EU Code of Conduct on responsible food business and marketing practices. We have translated this internal Code of Conduct to an external Supplier Code of Conduct including specific topics like Children’s Rights. We encourage people to speak up if they run into situations that do not feel right to them. We encourage our employees to discuss situations first with their managers or trust persons within our organisation and we have a whistleblowing system in place. Our whistleblowing system, in combination with a grievance mechanism, is also published on our website and can be used by suppliers or any party involved within our supply chain to report any alleged misconduct. This should ensure that anyone working with us feels safe, welcome and treated in the right way. For our employees their work situation should feel as a safe haven where they can be who they want to be and develop themselves to the best of their abilities. We have a clear management structure, with committed and informed managers who live our values and act according to our ethical framework. Our sustainability governance structure and our roadmap are supported by our senior management, who regularly report to our Board of Directors on our sustainability performance.

MESSAGE FROM OUR CO - CEO s | HIGHLIGHTS | GREENYARD’S RELEVANCE | FOOD OF THE FUTURE | PURE POWER OF PLANTS | DRIVEN BY PASSION & PEOPLE 108 /
Roadmap Governance
Greenyard has a clear sustainability strategy, roadmap and model, which is supported by the leadership of the company and the senior management. The selection of key targets and focus of our roadmap is confirmed by a double materiality analysis. As of January 2023, Greenyard’s loans are linked to a selection of the sustainability targets embedding it even more within our decision making. All of this can be considered as part of our governance structure to drive the execution of our sustainability roadmap.
Our purpose and strategy clearly demonstrate that sustainability is an integral part of our course of action. But to reach our goals we have a separate execution structure in place. The actual execution is done in the business. It is there that we save energy, use less water or packaging, prevent food waste and ensure responsible sourcing. In the business, we have to team up with different customers and comply with their demands on sustainability. And at the same time, we need to team up with all other partners in our value chain. Greenyard is a true connecting partner in this.
In our business we have a group of Sustainability Ambassadors who facilitate and guide this process. Every entity has a Sustainability Lead who acts as the local coordinator on sustainability. The different Sustainability Leads report (non-hierarchical) to the Group Sustainability and Innovation Director who reports directly to the co-CEOs and is responsible for the day-to-day management of our Group Sustainability Roadmap.
There are regular meetings with all Group Sustainability Ambassadors to inform everyone on specific topics, share best practices and to help building a sustainability culture. These meetings take place four to six times a year. In the process of building the Sustainability Roadmap and to review the roadmap in 2023 the Group Sustainability and Innovation Director is supported by the Sustainability Committee, consisting of several senior representatives across various functions, markets and areas of expertise.
The Group Sustainability and Innovation Director has regular meetings with the co-CEOs and reports back to the Leadership Team on milestones and important projects. The Board of Directors is updated on the progress we make as part of the regular business updates by the co-CEOs, who are ultimately responsible for the strategy and its implementation, and whose management incentives are linked to the Group’s sustainability performance. Next to this the Group Sustainability and Innovation Director is invited to attend Board meetings on specific sustainability topics and to report on progress at least once a year.
Our governance approach is underpinned by two Codes: the Greenyard Code of Conduct and the Greenyard Supplier Code of Conduct. Our Code of Conduct outlines the unified social norms and responsibilities for all Greenyard operations and is applicable to all our employees. It defines our core values and the principles we live up to in the spirit of protecting our business, respecting the people we work with and our duty to foster nature. To help employees understand the Code of Conduct, a user-friendly e-learning module is mandatory for all Greenyard employees.
/ 109 GREENYARD APPROACH | ENVIRONMENTAL IMPACT | SOCIAL IMPACT | ECONOMIC IMPACT & GOVERNANCE | GREENYARD AT A GLANCE | FINANCIAL REPORT
Our Supplier Code of Conduct sets out the standards in terms of environmental, social and governance matters that we expect from all direct suppliers of Greenyard – whether raw material suppliers, service providers, co-packers, contractors or agents.
A grievance mechanism is in place for anyone who wishes to report misdemeanours of any kind. A whistleblowing policy guarantees absolute anonymity and empowers our employees to actively contribute to creating a safe haven for everyone. The same goes for suppliers and their employees. Any report is handled by a dedicated investigation team which has internal procedures in place. The introduction of a user-friendly Whistleblower software tool along with a company-wide campaign (Speak Up) resulted in eight Whistleblower reports this year. Following investigations, three cases were confirmed and remediated.
We have a range of control procedures to ensure that these codes and policies are being followed. Greenyard seeks assurance in respect of human rights, labour regulations and health and safety regulations by means of regular audits at each of its facilities. Compliance with topics that are material to Greenyard’s sustainability agenda are reported annually in our sustainability report.
In addition to this sustainability report, Greenyard discloses information about its environmental, social and governance performance to specialist ESG rating agencies including CDP, EcoVadis, Moody’s ESG, MSCI and Sustainalytics. Greenyard is also among 350 keystone companies which are covered by the Food & Agri benchmark by the World Benchmarking Alliance. Other ratings or benchmarks are not actively followed up by Greenyard.

Greenyard achieved B for CDP Climate change and B for CDP Water security in 2022. In January 2023, Greenyard received an ESG Risk Rating of 30.1 and was assessed by Sustainalytics to be at high risk of experiencing material financial impacts from ESG factors. Greenyard’s ESG Risk Rating places it 30th percentile in the food products industry assessed by Sustainalytics1 . As of 2022 Greenyard also received an MSCI ESG Rating of AA 2
1 ©2023 Sustainalytics. All rights reserved. This sustainability report contains information developed by Sustainalytics (www.sustainalytics.com). Such information and data are proprietary of Sustainalytics and/or its third-party suppliers (Third Party Data) and are provided for informational purposes only. They do not constitute an endorsement of any product or project, nor an investment advice and are not warranted to be complete, timely, accurate or suitable for a particular purpose. Their use is subject to conditions available at https://www.sustainalytics.com/legal-disclaimers.
2 The use by Greenyard of any MSCI ESG RESEARCH LLC or its affiliates (“MSCI”) data, and the use of MSCI logos, trademarks, service marks or index names herein, do not constitute a sponsorship, endorsement, recommendation, or promotion of Greenyard by MSCI. MSCI services and data are the property of MSCI or its information providers, and are provided ‘as-is’ and without warranty. MSCI names and logos are trademarks or service marks of MSCI.
110 / MESSAGE FROM OUR CO - CEO s | HIGHLIGHTS | GREENYARD’S RELEVANCE | FOOD OF THE FUTURE | PURE POWER OF PLANTS | DRIVEN BY PASSION & PEOPLE
Setting the right standards for all our suppliers
“Our internal Code of Conduct serves as an imperative guide for all our employees to uphold the values and principles we wish to honour in our everyday business. In 2022, we have translated these principles into a Supplier Code of Conduct, which is now being rolled out to suppliers across our entire organisation,” says Frederik Tirez , Legal and Compliance Counsel at Greenyard.

“Our Supplier Code of Conduct sets out the environmental and social standards that we expect from all direct Greenyard suppliers – whether they are growers, raw material suppliers, service providers, co-packers, contractors or agents. The guiding principles will certainly not come as a surprise to our long-term suppliers, but the Code does formal-

ise these principles in a more explicit way. By signing off, our suppliers confirm their compliance with international and national employment legislation and their commitment to respect human rights in their activities.”
“We are currently in the process of rolling out the Supplier Code of Conduct to all our suppliers across our entire organisation. The implementation is handled by our sourcing and procurement departments, who have direct contact with most of our suppliers. We have also included a reference to the Supplier Code of Conduct in our terms and conditions.”
/ 111 GREENYARD APPROACH | ENVIRONMENTAL IMPACT | SOCIAL IMPACT | ECONOMIC IMPACT & GOVERNANCE | GREENYARD AT A GLANCE | FINANCIAL REPORT
SUPPLIER CODE OF CONDUCT
Financially embedding sustainability with Sustainability Linked Loans

Greenyard took its sustainability commitment to the next level last year through sustainability linked loans. We have ambitious goals in our Sustainability Roadmap to contribute to a healthier planet. To reinforce our dedication, we converted our existing bank loans to Sustainability Linked Loans, with KPIs focusing on climate change action, water usage, and responsible sourcing. The aim is to reduce our Scope 1 and 2 emissions by over 50% within the loan term. We're actively
engaging with our suppliers and growers to have them set their own climate targets and consequently lower our Scope 3 emissions. Regarding water usage, we plan to save 480 000m3, equivalent to almost 12% reduction compared to the reference year. Additionally, we aim to source 93% of goods from certified growers in high and medium risk countries, aligned with the Sustainability Initiative Fruit and Vegetables (SIFAV).

IS A JOURNEY
On a journey, with a clear destination
“As a mother, sustainability is a topic that is close to my heart. I believe it is every generation’s duty to leave a better world for their children. Greenyard holds a central position to create positive change in our sector, in the eating habits of people and in the way we produce and consume food,” says Valentine Deprez , member of Greenyard’s Board of Directors and actively engaged in sustainability.
“Greenyard has all the building blocks in place for a great future as a growth company – we have a gigantic product portfolio that contributes to a healthier future for everyone. But despite all this,
we must be aware we are not there yet. There are still many challenges ahead. As a global player, we have an enormous responsibility towards everyone who is working in our supply chain – whether close to home or on the other side of the world.”
“Sustainability is often compared to a journey, and I think that’s very true. It’s about acknowledging where you stand today and where you still need to improve. But the most important thing is to know your destination. You need to have a clear vision on where you are going and have the courage and persistence to pursue that vision.”
112 / MESSAGE FROM OUR CO - CEO s | HIGHLIGHTS | GREENYARD’S RELEVANCE | FOOD OF THE FUTURE | PURE POWER OF PLANTS | DRIVEN BY PASSION & PEOPLE
SUSTAINABILITY
Reporting tool Measure & act
As we want sustainability to be part of our daily operations, we measure the crucial KPIs on location level and where relevant we do this on a monthly base. This supports local management to act and steer towards the reduction of our environmental footprint based on actuals. The KPIs on energy use (electricity and gas), (food) waste and water are measured on a monthly base.

Reporting is done in our own sustainability reporting tool. All KPIs have a clear definition and we organise update trainings on the use of the tool yearly, as well as on relevant updates like newly available reports. We review the input on a quarterly base, with a focus on data consistency and understanding outliers. This way we ensure we collect data in a consistent manner from every division, entity and location. The data is entered manually into the system by our local sustainability ambassadors. We request them to have also evidence available for the reported figures. This can for example be the meter readings, invoices or other internal databases.
We use all the collected data for both our sustainability report and for the limited assurance audit process on the most important group of KPIs. With the sustainability reporting, in alignment with our double materiality assessment, we seek to offer a good transparency on the impact of our operations and our value chain. We foresee that in the coming years more datapoints will be added, also linked to evolving legislation and reporting criteria like the EU Taxonomy and the CSRD. We anticipated already on future requirements by having a limited assurance on our sustainability data. We aim to keep being ahead of upcoming regulation even though the increasing demands on reporting – especially for larger companies like Greenyard – is taking up a significant amount of valuable time that we also need to spend on real sustainability projects. The list of KPIs that have been reviewed externally is listed in the limited assurance report on page 139. The level of external reporting is a consolidated figure mostly on Group level and partly on divisional level.
Internally, the monthly reporting schedule runs parallel with our financial reporting at Group level and enables management to analyse our performance, detect trends and deviations and steer our operations in the right direction. We have quarterly meetings with the CFO to report on the progress. In the past year this was predominantly on setting up the reporting as such. The sustainability team is supported in this reporting effort by the Accounting & Controlling department.
/ 113 GREENYARD APPROACH | ENVIRONMENTAL IMPACT | SOCIAL IMPACT | ECONOMIC IMPACT & GOVERNANCE | GREENYARD AT A GLANCE | FINANCIAL REPORT
Responsibility
Food safety, quality & traceability

Greenyard has a fundamental responsibility to ensure people can trust the safety and quality of all our products.
Our approach
We have implemented a wide range of processes across our entire supply chain to ensure food safety and quality. All products supplied by Greenyard are compliant with regulatory requirements in the EU and the country of sale as well as being safe for consumer usage and consistent in quality. Our Quality and Safety Policies outline the steps required to identify, control and monitor points of potential safety risk. They cover every stage of the supply chain and apply to all operating sites and product categories. All sites comply with the most stringent international food quality standards. Within our regular quality control procedures, we conduct more than 90 000 laboratory tests on products and processing equipment every year.
The company’s focus on food safety and quality covers the entire production chain. All growers and suppliers must comply with clear and strict product specifications. When selecting new suppliers, we set high standards for food safety and quality. We conduct formal risk assessments on all our growers and suppliers, using assurance schemes which comply with the Global Food Safety Initiative, and we review their certification status every year.
Making sure our products and ingredients are fully traceable is a critical part of food safety, as well as a legal requirement. It also enables us to guarantee high-quality products and promote sustainability in our supply chain. Organic, Fair Trade and Rainforest Alliance products are supplied through a chain of custody schemes, which guarantees that they have been sourced in a fully sustainable way.
Our progress
As a global food business operator, Greenyard recognises the critical importance of maintaining high standards of food safety across all its operations. Our commitment to ensuring the safety and quality of our products begins with compliance with local regulations and goes far beyond that.
At Greenyard, we take a proactive approach to food safety culture, continuously improving our internal requirements to meet the evolving needs of the industry, as well as regulatory requirements. We recognise the importance of staying ahead of the curve, which is why we have renewed our Group Quality and Food Safety Policy to ensure that we maintain the highest standards of food safety across our entire company.
114 / MESSAGE FROM OUR CO - CEO s | HIGHLIGHTS | GREENYARD’S RELEVANCE | FOOD OF THE FUTURE | PURE POWER OF PLANTS | DRIVEN BY PASSION & PEOPLE
It pleases us to say that we are one of the frontrunners in the application of new scientific insights to approach and improve a company's food safety culture. Recently, we successfully concluded the QDNA project, in close cooperation with the University of Ghent and Flanders Food, which aimed to develop methodologies to evaluate the food safety culture of a company and identify potential routes for improvement. Based on the project's outcomes, we have developed our own Food Safety Culture Program, which is currently being rolled out across all our divisions and countries.
Future plans
In the next two years, our Food Safety Culture Program will serve as a basis to embed food safety in the entire organisation, in ways that are even more effective than what was already the case. We will continue to prioritise food safety in our operations, demonstrating our commitment to our customers and stakeholders by ensuring the safety and quality of our products.
Food quality & safety
In parallel, we plan to fully implement our renewed Quality and Food Safety Policy to further enhance our standards across all divisions and our supply chain. We will take state-of-the-art data management systems into use to reinforce compliance across our supply chain. Additionally, we will expand our cooperating frameworks within the quality and food safety community, allowing experts to work together more closely and find common solutions to common challenges.
It serves to show that at Greenyard, we are dedicated to maintaining the highest level of food safety standards and continuously improving our practices. We believe that by working together, we can make a positive impact on the industry and contribute to a sustainable future.
/ 115 GREENYARD APPROACH | ENVIRONMENTAL IMPACT | SOCIAL IMPACT | ECONOMIC IMPACT & GOVERNANCE | GREENYARD AT A GLANCE | FINANCIAL REPORT
Indicator 2020/2021 2021/2022 2022/2023 Number of tests conducted on products 66 716 65 027 73 764 Number of tests conducted on equipment and facilities 28 906 28 703 27 654 Number of IFS-certified facilities 25 27 27 Number of BRC-certified facilities 11 11 11 Number of FSSC 22000-certified facilities 3 3 3 Number of ISO 9001-certified facilities 2 1 1 Number of Primus GFS-certified facilities 1 1 1 Number of audit days carried out by certification bodies 257 260 223
Product development Innovation
The Group has a consumer-centric approach to product development which involves taking into account consumer needs such as health, convenience, pleasure, affordability and sustainability. The goal is to drive forward product innovation in each division. In the past financial year, as well as in previous years, many new products, product varieties, dishes and packaging have been developed and successfully marketed. Some of these products have also been recognised for their innovative character and nominated for industry awards.
Development quality and the circulation of information throughout the organisation are monitored throughout the process by the internal research and development
(R&D) departments. Fresh and Long Fresh employ respectively 20 and 8 dedicated permanent staff to develop new products and engage in research partnerships. There are currently a number of R&D programmes in place, which are co-financed by external national and international institutions. The Group’s R&D budget amounts to € 3,0m.
The Group’s food processing operations continue to invest in the best-performing and innovative machinery and installations. This allows them to develop products at a rapid pace, aligned with market trends and consumer expectations.

116 / MESSAGE FROM OUR CO - CEO s | HIGHLIGHTS | GREENYARD’S RELEVANCE | FOOD OF THE FUTURE | PURE POWER OF PLANTS | DRIVEN BY PASSION & PEOPLE
Our approach Tax transparancy
In 2022-2023, the cash taxes for corporate income taxes contributed by Greenyard to local tax authorities amounted in total to € 13 495m. Next to the aforementioned amount, the Group also contributes significant other amounts of taxes in all of the jurisdictions where activities are carried out such as payroll taxes, social security and VAT. In line with the Group’s tax policy, a correct determination and timely payment of the taxes due in compliance with applicable tax laws are pursued. The taxes paid by the Group are a key part of its wider economic and social impact and the Group is aware that it plays an important role in the development and/or stability of the jurisdictions where it operates. Therefore, the correct payment of taxes is considered an important element of the Group’s commitment to grow in a sustainable and socially inclusive manner.
The Group commits to conduct its tax matters in a consistent way with the following objectives:
• Compliance with all relevant tax laws and regulations and minimisation of the risk of violating any tax regulation or the risk of abuse of any tax measures. The Group has a dedicated tax team working closely with the Group’s business to provide advice and guidance where needed to ensure accuracy and compliance with tax law. When considering how Group entities structure business arrangements, tax implications are analysed in parallel with other consequences such as capital efficiency and legal and regulatory aspects when deciding between potential alternative set-ups.
• Application of professional diligence and care in the management of all risks associated with tax matters. In certain circumstances where the application and/ or the interpretation of tax regulations is unclear, the Group pursues help from external specialist advisers to support decisions. When appropriate the competent local tax authorities are consulted.
• Fostering a good relationship with local tax authorities, based on values of correctness, open communication and transparency. The Group consults competent local tax authorities on the tax impact of certain transactions and is part of (informal horizontal) monitoring programs in certain jurisdictions. Moreover, detailed and accurate documentation is proactively prepared on the group’s transfer pricing policy in accordance with the OECD Transfer Pricing Guidelines and this is shared with the tax authorities in a timely manner. The Group is also complying with CbCR and is preparing for other tax measures coming up such as public CbCR and Pillar 2.
• The Group only uses tax incentives and reliefs where appropriate and in line with business activities. The Group does not carry out transactions that are primarily tax driven nor does it set up business and/or make investments in jurisdictions classified as tax havens with the aim to reduce taxes on operational activities elsewhere. Any presence in jurisdictions with tax rates lower than Belgium are driven by business operations. Reference is made to the consolidated financial statements for reporting of financial, business and tax information for each jurisdiction in which the Group operates.
/ 117 GREENYARD APPROACH | ENVIRONMENTAL IMPACT | SOCIAL IMPACT | ECONOMIC IMPACT & GOVERNANCE | GREENYARD AT A GLANCE | FINANCIAL REPORT

118 / UNLEASHING THE PURE POWER OF PLANTS
Greenyard at a glance

/ 119 GREENYARD ANNUAL REPORT 2022/2023
Operational footprint
Closely collaborating with world's largest food retailers and food service companies
Greenyard has the zest to call the world’s largest food retailers and food service companies its customers. They rely on us for a steady and high-quality supply of fresh, frozen and prepared fruits and vegetables.

Thanks to strong and long-term relationships with our customers, we offer our expertise, global scale, and knowledge to co-create a pure plant product offering that enhances their business by meeting the everchanging consumer needs.
Our unique and complementary mix of three divisions, Fresh, Frozen and Prepared, allows us to meet the needs of every consumer. No matter their lifestyle or age. No matter the occasion. A quick afternoon snack, a convenient and healthy meal tomorrow, or dinner with friends next weekend.
Greenyard’s pure-plant powered arrangement and short food supply chain also contribute to a healthier planet. We supply our produce to a range of different markets fitted to their respective size and taste preferences, meaning nature provides us with her bounty at her own rhythm. Additionally, we carefully source products for our Frozen or Prepared ranges, to meet other types of consumer needs in a sustainable way.
Providing people around the globe with healthy fruit and vegetables is so much more than sourcing and selling produce. We need to ensure that the product that ends up on their plates exactly matches their expectations. And this in one of the most complex food categories out there. Delivering top-notch quality products is key. Ensuring a constant quality starts on the fields where the produce is grown.
120 / MESSAGE FROM OUR CO - CEO s | HIGHLIGHTS | GREENYARD’S RELEVANCE | FOOD OF THE FUTURE | PURE POWER OF PLANTS | DRIVEN BY PASSION & PEOPLE
GREENYARD FRESH
Fresh quality and variety
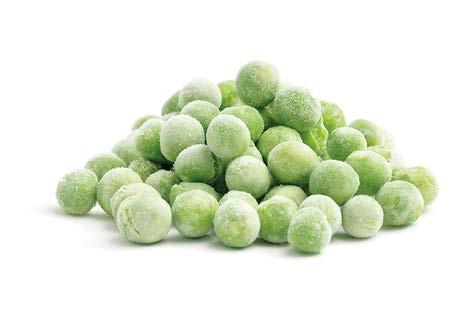

25 distribution sites
Worldwide market leader that offers an exceptionally wide range of high-quality fresh fruit and vegetables, sourced from selected growers all over the world, to key retailers. With strategically located distribution centres, our Fresh division offers them best-in-class integrated services that improve their performance and increase sales of healthy consumer products.
approx.
1 900 000 tons/sales volume
approx.
5 300 employees
GREENYARD FROZEN
9 facilities
approx. 485 000 tons/sales volume
Global pioneer and market leader in processing freshly harvested fruits and vegetables into innovative, frozen food products that are easy to store and consume; meeting the needs of modern consumers who want to enjoy healthy and tasty food, with minimal preparation time. Our Frozen division offers excellent service and advanced logistics for frozen plant-based products to retailers, food service companies and the food industry in general.
approx.
2 200 employees
/ 121 GREENYARD APPROACH | ENVIRONMENTAL IMPACT | SOCIAL IMPACT | ECONOMIC IMPACT & GOVERNANCE | GREENYARD AT A GLANCE | FINANCIAL REPORT
The best of nature, always fresh
GREENYARD PREPARED
The best of nature, available all-year round
2 facilities
250 000 tons/sales volume
Global player in freshly preserved fruit and vegetables, and other ambient food products that are easy to store and ready to eat. Our Prepared division supplies three market segments with an extensive product portfolio: retailers, food service companies and the food industry. Ranging from classic preserved products in cans or jars to dips, sauces, and soups in a variety of packaging.

1 000 employees
At Greenyard, we work very closely together with our growers, connecting them to our customers.
By combining our sourcing and technical expertise with our extensive network of state-of-the-art distribution centres and processing facilities, we have developed the capacity to offer world-leading added-value services. The produce we source from our growers, is thoroughly controlled by our quality department on all relevant aspects, to ensure it matches the exact requirements and specifications of each individual customer. Before it is delivered to these customers it is stored in our distribution centres under optimal conditions. For specific products like mango, avocado or bananas we also provide independent ripening services.
Our integrated and close collaboration with the world’s largest retailers and food service companies help them to expand their offering, develop new markets and successfully anticipate consumer trends. Long-term and solid relationships with retailers allow us to keep the consumer top-of-mind in all our activities.
Starting from consumer demand, and closely working together with both ends of the chain is unique to our business. It does not only allow us to optimally link supply with the actual consumer demand, it also enables us –together with our customers – to actively drive the shift towards healthier lifestyles and an increased consumption of fruit and vegetables. Always working towards an ever more sustainable food value chain.
122 / MESSAGE FROM OUR CO - CEO s | HIGHLIGHTS | GREENYARD’S RELEVANCE | FOOD OF THE FUTURE | PURE POWER OF PLANTS | DRIVEN BY PASSION & PEOPLE
USA SWEDESBORO
approx.
approx.
THE NETHERLANDS
Greenyard Fresh facility
Greenyard Frozen facility
Greenyard Prepared facility
BELGIUM
POLAND
CZECH REPUBLIC PRAGUE
* As from February 2023 Greenyard Fresh UK ceased its operations in Spalding.
/ 123 GREENYARD APPROACH | ENVIRONMENTAL IMPACT | SOCIAL IMPACT | ECONOMIC IMPACT & GOVERNANCE | GREENYARD AT A GLANCE | FINANCIAL REPORT
AUSTRIA
VIENNA
ITALY VERONA
1+2. GDANSK
3+4. POZNAN
5. ZABIA WOLA
6. DĄBROWA CHEŁMIŃSKA
7. LIPNO
7 5 3 4 8 6 1 2
8. ADAMÓW
SPAIN
1. VALENCIA
1 2
2. ALMERIA
FRANCE
1. RUNGIS
2. COMINES
3 2 1
3. MORÉAC
UNITED KINGDOM
1. BOSTON
2. KING’S LYNN
3 2 1
3. SPALDING
2 3 4 6 5 1
GERMANY
1. HAMBURG
2. DUISBURG
3. LEIPZIG
4. FRANKFURT
5. EITTING
SWEDESBORO 1 2 3
6. MÜNCHEN
1. LANGEMARK
2. WESTROZEBEKE
3. BOOM
4+5+6. SINT-KATELIJNE-WAVER
7. RIJKEVORSEL
8. BREE
1. WADDINXVEEN
3 4 5 6 1 2 7 8
2+3. RIDDERKERK
Sourcing footprint
As close by as possible, as far away as necessary
Today’s consumers expect all year-round availability of their favourite fruit and vegetables. Greenyard has built a strong, worldwide grower and supplier network with whom we have been working for a very long time. Sometimes decades. By teaming up and providing them with data-driven feedback this results in a unique way of working and steady supply of high-quality products for our customers.
For all our products we look for the most fitting location to grow them. If products must travel longer distances from field to market, we focus on the optimisation of transport and the best conditions to minimise waste along the food value chain. We annually source over 2,6 million tonnes of fruit and vegetables from 90 countries, of which around 65% comes from Europe.
Next to our fresh produce that is available via all yearround programs to our customers, we also promote our long-fresh portfolio. These are frozen and prepared products that are, of course, always available for a broad consumer range. A truly healthy, sustainable, convenient and affordable offering. All frozen and prepared products come from fields within 150 kilometres of our production plants. The time between harvesting and the frozen product can be as little as one hour. This very fast handling allows us to harvest the product at the best moment in time and to preserve all its health benefits, always staying close-to-crop. At the same time this allows consumers to enjoy these products later, when it suits them best.
124 / MESSAGE FROM OUR CO - CEO s | HIGHLIGHTS | GREENYARD’S RELEVANCE | FOOD OF THE FUTURE | PURE POWER OF PLANTS | DRIVEN BY PASSION & PEOPLE
Greenyard volume share by origin
> 5%
1-5%
0,5-1%
< 0,5%
/ 125 GREENYARD APPROACH | ENVIRONMENTAL IMPACT | SOCIAL IMPACT | ECONOMIC IMPACT & GOVERNANCE | GREENYARD AT A GLANCE | FINANCIAL REPORT

Approx. 8 500 11 25 2 600 > 80 18 employees production sites distribution centres (Frozen & Prepared) (Fresh) Net Sales Adjusted EBITDA-margin Adjusted EBITDA (Like-for-Like) (post-IFRS 16) (post-IFRS 16) 4 638,0 m 3,6 % € 167,3 m
126 / MESSAGE FROM OUR CO - CEO s | HIGHLIGHTS | GREENYARD’S RELEVANCE | FOOD OF THE FUTURE | PURE POWER OF PLANTS | DRIVEN BY PASSION & PEOPLE
Key figures
Approx. 8 500 11 25 2 600 > 80 18 Kton sales volume sales countries out of 20 of EU top-20 retailers Profit Net Financial Debt Leverage € 9,3 m € 277,3 m 2,2 x / 127 GREENYARD APPROACH | ENVIRONMENTAL IMPACT | SOCIAL IMPACT | ECONOMIC IMPACT & GOVERNANCE | GREENYARD AT A GLANCE | FINANCIAL REPORT

128 / UNLEASHING THE PURE POWER OF PLANTS
EU taxonomy

/ 129 GREENYARD ANNUAL REPORT 2022/2023
The EU Taxonomy Regulation (EU 2020/852) aims to define the criteria for determining whether an economic activity can be considered environmentally sustainable and in line with the EU objectives laid down in the EU Green Deal, including EU Climate targets. By defining what is sustainable it is believed that a transition towards a more sustainable economy is fostered as investments can be directed towards Taxonomy aligned activities.
Within the EU Taxonomy six environmental objectives are defined.
1. Climate change mitigation
2. Climate change adaptation
3. The sustainable use and protection of water and marine resources
4. The transition to a circular economy
5. Pollution prevention and control
6. Protection and restoration of biodiversity and ecosystems
At this moment, the Technical Screening Criteria (TSC) are only available for the first two objectives, climate change mitigation and climate change adaptation. These criteria are published within the commission delegated regulation (EU) 2021/2139. It is not yet clear when the TSC for the other 4 criteria will be published.
The TSCs determine the conditions under which an economic activity qualifies as contributing substantially to climate change mitigation or climate change adaptation and as well whether that economic activity causes no significant harm to any of the other environmental objectives.
Not all sectors and economic activities are explicitly mentioned or indicated within the EU Taxonomy. The Commission has focussed first on activities that could have a large (negative) impact on climate change and where transition to more sustainable alternatives makes most sense. The wholesale of fruits & vegetables as well as food production (frozen / prepared) are not explicitly mentioned and therefore the main revenue generating activities of Greenyard are not eligible.

Greenyard supports the objectives and ambition of the EU Taxonomy, which are fully in line with the strategy of Greenyard and its sustainability roadmap. However, we also want to stress that all new regulation on reporting has a significant impact on the cost and effort for companies for only reporting instead of real climate action. This is because of the complexity of the new European regulatory framework, which is also still evolving and because different interpretations on how to apply it.
We expect that with the future publication of TSC’s for the other environmental objectives and evolving clarifications on how to report, combined with pragmatic and sector wide standardisation, reporting on the EU Taxonomy criteria will be made easier and as well more
130 / MESSAGE FROM OUR CO - CEO s | HIGHLIGHTS | GREENYARD’S RELEVANCE | FOOD OF THE FUTURE | PURE POWER OF PLANTS | DRIVEN BY PASSION & PEOPLE
Introduction
Eligible activities of Greenyard under EU Taxonomy
Greenyard falls under the scope of EU Taxonomy Regulation. As such and as per Taxonomy Disclosure Delegated Act of (EU 2021/2178) the company has assessed if the economic activities of the Group are eligible to report on in line with the KPI definitions and TSC’s given within the first two annexes of Climate Delegated Act (EU 2021/2139).
Greenyard’s key revenue-generating activities consist of the wholesale and distribution of fresh fruit and vegetables and the production of frozen and prepared fruit and vegetables, which are not covered in either of the annexes of the Climate Delegated Act and do not match the description of the TSC’s that classifies economic activities as sustainable. This means the main revenue generating activities of the company are out of scope of the currently published TSC’s of the EU Taxonomy.
Greenyard does engage in economic activities that support the main activities like the transport of the fruits and vegetables to Greenyard customers.
Within the EU Taxonomy regulation companies are required to report on the proportion of turnover (revenues), capital expenditures (CAPEX) and operating expenditures (OPEX) that is associated with environmentally sustainable economic activities, and to what extent these activities are aligned (i.e. contributing to one or more environmental objectives). Whereas our main revenue generating activities are not eligible and will therefore not be reported on we have also considered if any expenses could be eligible and potentially be aligned through either CAPEX or OPEX related expenditures. A definition of CAPEX and OPEX within the EU Taxonomy we used for the analysis is given below as well.
Greenyard reviewed each of the described activities within the EU Taxonomy Climate Delegated Act and concluded that only the following activities could be considered as eligible. Per activity a short explanation is given how we consider this activity to be eligible to report on. The related amounts of Turnover, CAPEX and OPEX can be found in the specific tables at the end of this section.
/ 131 GREENYARD APPROACH | ENVIRONMENTAL IMPACT | SOCIAL IMPACT | ECONOMIC IMPACT & GOVERNANCE | GREENYARD AT A GLANCE | FINANCIAL REPORT
Cat. EU Taxonomy activity description Revenue CAPEX OPEX 6 Transport 6.6 Freight transport services by road (for only 2 further specified entities) X X X 7 Construction & Real Estate 7.3 Installation, maintenance and repair of energy efficiency equipment X 7.4 Installation, maintenance and repair of charging stations for electric vehicles in buildings (and parking spaces attached to buildings) X
Definition of Turnover, CAPEX and OPEX within the EU Taxonomy
The turnover KPI represents the proportion of the net turnover derived from products or services that are taxonomy-aligned. In the case of Greenyard for the current published set of criteria only a very limited amount of turnover could be labelled as taxonomy eligible (only 0,2%) and this revenue is not aligned.
The Capex KPI represents the proportion of the capital expenditure of an activity that is already taxonomy-aligned or part of a credible plan to extend or reach taxonomy alignment. For reference we mention that the CAPEX used in the Eu Taxonomy tables is CAPEX excluding decommissioning provisions. Greenyard monitors CPEX with an internal tool, whenever an entity requests CAPEX also extra information is requested on how this CAPEX contributes to our sustainability goals. While this helps us in realisation of our sustainability roadmap this methodology is not yet fully aligned with the EU Taxonomy, in the coming years we will further finetune this tool also to the TSC’s of the EU Taxonomy. For this analysis the tool helped to identify potential aligned CAPEX and to judge if any CAPEX investment that have a specific sustainability aspect in it in line with the current published TSC’s.
To look at alignment of OPEX KPI the EU Taxonomy considers the spend on OPEX directly attributed to CAPEX needed for the transition to more sustainable operations to be eligible or attributed to already taxonomy aligned activities. The operating expenditure covers direct non-capitalised costs relating to research and development, renovation measures, short-term lease, maintenance and other direct expenditures relating to the day-to-day servicing of assets of property, plant and equipment that are necessary to ensure the continued and effective use of such assets. This definition is narrower than compared to our accounting definition of operating expenses.
We have estimated the specific OPEX categories and concluded that this is not a significant amount within the overall OPEX of Greenyard and that it would not be aligned OPEX. We therefore will report it as not aligned.
The EU Taxonomy allows for an exemption where the operational expenditure is not material for the business model, which is applicable in this case.
We will further explain more qualitative on the different categories:
6 Transport
The main activity of Greenyard is the wholesale of fruits and vegetables (NACE code 46.319). Transportation is a small part of all activities performed by Greenyard. Greenyard does have a small own truck fleet, but transport activities are mostly outsourced to sub-contractors. Transport is for example used to deliver the sorted, packed fruits and vegetables products to the distribution centers of retail customers.
Transport (in different forms) is an economic activity that is included in the EU Taxonomy (Annex 1 – category 6). Within the activities of Greenyard transport is clearly facilitating to the main activity of Greenyard. Transport is part of the overall cost price of the main product or service Greenyard invoices to its customers. Within the Greenyard financial reporting (where Greenyard is following the IFRS accounting standards) the transport part is not reported separately but only as an integral part of the overall Turnover.
Following the Taxonomy guidelines leads to excluding Greenyard’s transportation activities from EU Taxonomy disclosures, as they are facilitating to the main activities of Greenyard, mostly outsourced and the price of transport is included in the price of the product.
In two entities Greenyard has a specific transport business that does fit into the specific definition of the EU taxonomy category 6.6 while this is not a significant or material part of our revenues we will report the related revenues and related CAPEX and OPEX of these activities. The reported Revenues do not contain any intercompany sales.
132 / MESSAGE FROM OUR CO - CEO s | HIGHLIGHTS | GREENYARD’S RELEVANCE | FOOD OF THE FUTURE | PURE POWER OF PLANTS | DRIVEN BY PASSION & PEOPLE
6.6 Freight Transport by road
In two specific entities (Bakker Trans SRO in the Czech Republic and Greenyard Transport Belgium), Greenyard is acting as a pure transport company. These economic activities are in line with the description of EUT activity
6.6 Freight transport services by road.
This is the only revenue that Greenyard considers eligible under the EU Taxonomy. As these transport activities are not performed with zero emission vehicles none of the turnover is aligned. The same accounts for CAPEX and OPEX, which is 0% aligned. Within the CAPEX and OPEX (not aligned) the numbers refer to the overall OPEX and CAPEX of Greenyard and within the reported figures also the related CAPEX and OPEX of transport activities in other entities of Greenyard are reported (where transport is a facilitating activity).
Please note that the revenues of these specific activities are only around 0,2% of the total turnover of Greenyard and therefore not considered material.
7 Construction & Real Estate
Section 7 of the EU taxonomy focusses primarily on real estate developers and building & construction companies. Greenyard does not have any eligible turnover in category 7 as it is not a real estate developer or construction company and did also not construct any buildings for its own use.
Within section 7 of the EU Taxonomy Greenyard will report this year on 2 sections (7.3 and 7.4) which both have a direct relation to Greenyard’s sustainability strategy. On category 7.6 (Installation, maintenance and repair of renewable energy technologies, on-site) we give a short explanation, but we will not report on this as there was no CAPEX or OPEX to report on within this category in the reporting year.
7.3 Installation, maintenance and repair of energy efficiency equipment
One of the technical screening criteria within chapter 7.3 of the EU Taxonomy is the transition towards LED lighting. The process of LED-ification is ongoing within Greenyard. While the amount of Capx per year is not significant, changing lights in large distribution centres does take a lot of effort (working at hight, a lot of trans-
port activities on the floor) therefore we try to combine this with regular maintenance. Other activities are are installation or replacing of insulation materials within our factories for example insulation of tubes that transport warm water and steam. The same accounts for the “cold side” of our operation where we use insulation to keep rooms at a cold or freezing temperature. Here we included any insulation of cold stores and the walls and roofs of temperature controlled storing facilities storing facilities and ripening rooms. Investments can also be on improving of the efficiency of equipment used for the cooling or heating process.
We did not include any replacement of boilers, while a new boiler will as well have a positive effect as these will in general be more energy efficient as the older ones they replace. We expect that when sector specific criteria will be available for our sector the technical screening criteria will as well be more specific on our processes. The CAPEX spend on LED lighting is separately measured within this category but not aligned yet.
7.4 Installation, maintenance and repair of charging stations for electric vehicles in buildings (and parking spaces attached to buildings)
To support the transition towards electric vehicles we are rolling out the installation of charging stations at the different locations. This is mainly to support the transition of our lease (passenger) car fleet to employees to electric vehicles in the coming years. Any new lease car that is ordered needs to be electric as of 2022. Under 7.4 the related eligible CAPEX is reported which is not aligned.
7.6 Installation, maintenance and repair of renewable energy technologies, on-site
On several locations where Greenyard operates a DC or factory also solar panels are installed. The Installation, maintenance and repair of renewable energy technologies like solar panels is not done by Greenyard but by the landlord or an energy company investing in these installations. Greenyard can be the customer for the off take of the Green Energy produced this is done with a power purchase agreement (PPA).
/ 133 GREENYARD APPROACH | ENVIRONMENTAL IMPACT | SOCIAL IMPACT | ECONOMIC IMPACT & GOVERNANCE | GREENYARD AT A GLANCE | FINANCIAL REPORT
Only in one case the solar roof itself was originally invested by Greenyard. This is the solar roof at the location in Bree. Within the reporting year no CAPEX or OPEX was related to this specific roof. In all other cases it is a third party who owns and operates the PV panels. Therefore, for this reporting year, Greenyard will report zero CAPEX and OPEX regarding category 7.6. As we might report on this category coming years for any investments related to the realization of new solar panel roofs or other renewable energy technologies, we labelled category 7.6 to follow up on coming years.
Extra disclosures on non-eligible activities
Activities 5.6 and 5.8 of the EU Taxonomy are defined as “construction and operation of dedicated facilities for the treatment of separately collected bio-waste through anaerobic digestion (5.6) or composting (5.8) with the resulting production and utilisation of biogas and digestate and/or chemicals.
Greenyard is not eligible as it does not construct, own or operate such specific mentioned facilities for biowaste. Today Greenyard is a supplier to such facilities, as it delivers mixed organic waste flows that come free at different locations. Greenyard aims to minimize (food) waste overall and to use by-product flows as feed (only if it is not possible to keep them in the food chain). The bio / organic waste is collected by waste management companies that either treat it in their own facilities or bring the waste to other companies who in their turn operate a facility for composting or digestion.
Other qualitative information
With the actions we take we contribute most to climate change mitigation. To determine if an activity substantially contributes to climate change mitigation or adaption, we looked at the specific technical screening criteria (TSC) set out in the Climate Delegated Act. The main activities of Greenyard, being wholesale of fruits & vegetables as well as food production (frozen / prepared) are not eligible. Only a very limited amount of the turnover relating to some dedicated transport activities is eligible. Based on the description of the EU Taxonomy activities only a small part of the CAPEX and OPEX is eligible.
Technical screening criteria (TSC) defining “substantial contribution” (is tussentitel)
To determine if an activity substantially contributes to climate change mitigation or adaption, we looked at the specific technical screening criteria (TSC) set out in the Climate Delegated Act. Today Greenyard reports only a limited amount of eligible turnover, the same accounts for CAPEX and OPEX. If we take a look at the actual amounts the conclusion should be that this is not material. To judge alignment, we applied the TSC to the best of our knowledge and with prudence. In case of any doubt on alignment we reported it as not-aligned.
Do No Significant Harm and Minimum Social Safeguards
A high-level assessment of alignment was performed on the 2022 eligible CAPEX. Only the CAPEX linked to the installation, maintenance and repair of charging stations for electric vehicles (activity 7.4) could be considered aligned if also the Do No Significant Harm criteria are met. The relevant Do No Significant Harm (DNSH)-principle for this activity is related to climate adaptation and involves a robust climate risk and vulnerability assessment of the assets where charging stations have been installed.
Greenyard estimates none of its assets are at risk from one or more of the physical climate risks listed in Section II of the Regulation (EU) 2020/852 but has not yet performed a detailed climate risk and vulnerability of Greenyard’s assets. Such an analysis is contemplated during FY2024, therefore we report today also no alignment yet on the EU Taxonomy regarding our CAPEX. We are also assessing the incorporation of Technical Screening Criteria and DNSH-principles in our CAPEX process, to ensure effective and efficient reporting in the future. Elsewhere Greenyard complies with the minimum social safeguards (MSS). The applicable elements mentioned within Article 18 of the EU taxonomy on MSS are all an integral part of the Code of Conduct and the Supplier Code of Conduct of Greenyard.
134 / MESSAGE FROM OUR CO - CEO s | HIGHLIGHTS | GREENYARD’S RELEVANCE | FOOD OF THE FUTURE | PURE POWER OF PLANTS | DRIVEN BY PASSION & PEOPLE
Proportion of turnover from products or services associated with Taxonomy-aligned economic activities - disclosure covering year 22/23
/ 135 GREENYARD APPROACH | ENVIRONMENTAL IMPACT | SOCIAL IMPACT | ECONOMIC IMPACT & GOVERNANCE | GREENYARD AT A GLANCE | FINANCIAL REPORT
Substantial contribution criteria DNSH criteria (Does Not Significantly Harm) Economic activites (1) Code(s) (2) Absolute turnover (3) Proportion of turnover (4) Climate change mitigation (5) Climate change adaption (6) Water and marine resources (7) Circular economy (8) Pollution (9) Biodiversity and ecosystems (10) Climate change mitigation (11) Climate change adaption (12) Water and marine resources (13) Circular economy (14) Pollution (15) Biodiversity and ecosystems (16) Minimum safeguards (17) Taxonomy aligned proportion of turnover, year N (18) Taxonomy aligned proportion of turnover, year N-1 (19) Category (enabling activity or) (20) Category (transitional activity) (21) 1 000 EUR % % % % % % % Y/N Y/N Y/N Y/N Y/N Y/N Y/N Percent Percent E T A. TAXONOMY-ELIGIBLE ACTIVITIES A.1 Environmental sustainable activities (Taxonomy-aligned) Turnover of environmental sustainable activities (Taxonomy-aligned (A.1) 0 0,0% A.2 Taxonomy-Eligible but not environmental sustainable activities (not Taxonomy-aligned activities) Freight transport services by road 6.6 8 203 0,2% Turnover of Taxonomy-eligible but not environmentally sustainable activities (not Taxonomy-aligned activities) (A.2) 8 203 0,2% TOTAL (A.1 + A.2) 8 203 0,2% B. TAXONOMY-NON-ELIGIBLE ACTIVITIES Turnover of Taxonomy-non-eligible activities (B) 4 681 907 99,8% TOTAL (A + B) 4 690 110 100% Substantial contribution criteria DNSH criteria (Does Not Significantly Harm) Economic activites (1) Code(s) (2) Absolute turnover (3) Proportion of turnover (4) Climate change mitigation (5) Climate change adaption (6) Water and marine resources (7) Circular economy (8) Pollution (9) Biodiversity and ecosystems (10) Climate change mitigation (11) Climate change adaption (12) Water and marine resources (13) Circular economy (14) Pollution (15) Biodiversity and ecosystems (16) Minimum safeguards (17) Taxonomy aligned proportion of turnover, year N (18) Taxonomy aligned proportion of turnover, year N-1 (19) Category (enabling activity or) (20) Category (transitional activity) (21) 1 000 EUR % % % % % % % Y/N Y/N Y/N Y/N Y/N Y/N Y/N Percent Percent E T A. TAXONOMY-ELIGIBLE ACTIVITIES A.1 Environmental sustainable activities (Taxonomy-aligned) CAPEX of environmental sustainable activities (Taxonomy-aligned (A.1) 0 0,0% A.2 Taxonomy-Eligible but not environmental sustainable activities (not Taxonomy-aligned activities) Freight transport services by road 6.6 5 751 8,4% Installation, maintenance and repair of energy efficiency equipment 7.3 677 1,1% Installation, maintenance and repair of charging stations for electric vehicles in buildings 7.4 462 0,7% CAPEX of Taxonomy-eligible but not environmentally sustainable activities (not Taxonomy-aligned activities) (A.2) 6 890 10,1% TOTAL (A.1 + A.2) 6 890 10,1% B. TAXONOMY-NON-ELIGIBLE ACTIVITIES CAPEX of Taxonomy-non-eligible activities (B) 61 343 89,9% TOTAL (A + B) 68 233 100% Proportion of CAPEX from products or services associated with Taxonomy-aligned economic activities - disclosure covering year 22/23
Proportion of OPEX from products or services associated with Taxonomy-aligned economic activities - disclosure covering year 22/23
Template 1 Nuclear and fossil gas related activities
Row Nuclear energy related activities
1 The undertaking carries out, funds or has exposures to research, development, demonstration and deployment of innovative electricity generation facilities that produce energy from nuclear processes with minimal waste from the fuel cycle.
2 The undertaking carries out, funds or has exposures to construction and safe operation of new nuclear installations to produce electricity or process heat, including for the purposes of district heating or industrial processes such as hydrogen production, as well as their safety upgrades, using best available technologies.
3 The undertaking carries out, funds or has exposures to safe operation of existing nuclear installations that produce electricity or process heat, including for the purposes of district heating or industrial processes such as hydrogen production from nuclear energy, as well as their safety upgrades.
Fossil gas related activities
4 The undertaking carries out, funds or has exposures to construction or operation of electricity generation facilities that produce electricity using fossil gaseous fuels. NO
5 The undertaking carries out, funds or has exposures to construction, refurbishment, and operation of combined heat/cool and power generation facilities using fossil gaseous fuels.
6 The undertaking carries out, funds or has exposures to construction, refurbishment and operation of heat generation facilities that produce heat/cool using fossil gaseous fuels.
Template
aligned economic activity referred to in Section 4.26 of Annexes
in the denominator of the applicable KPI
in the denominator of the applicable KPI
aligned
activity referred to in Section 4.30 of Annexes
aligned economic activity referred to in Section 4.31 of Annexes I
referred to in rows 1 to 6 above
136 / MESSAGE FROM OUR CO - CEO s | HIGHLIGHTS | GREENYARD’S RELEVANCE | FOOD OF THE FUTURE | PURE POWER OF PLANTS | DRIVEN BY PASSION & PEOPLE
Substantial contribution criteria DNSH criteria (Does Not Significantly Harm) Economic activites (1) Code(s) (2) Absolute turnover (3) Proportion of turnover (4) Climate change mitigation (5) Climate change adaption (6) Water and marine resources (7) Circular economy (8) Pollution (9) Biodiversity and ecosystems (10) Climate change mitigation (11) Climate change adaption (12) Water and marine resources (13) Circular economy (14) Pollution (15) Biodiversity and ecosystems (16) Minimum safeguards (17) Taxonomy aligned proportion of turnover, year N (18) Taxonomy aligned proportion of turnover, year N-1 (19) Category (enabling activity or) (20) Category (transitional activity) (21) 1 000 EUR % % % % % % % Y/N Y/N Y/N Y/N Y/N Y/N Y/N Percent Percent E T A. TAXONOMY-ELIGIBLE ACTIVITIES A.1 Environmental sustainable activities (Taxonomy-aligned) OPEX of environmental sustainable activities (Taxonomy-aligned (A.1) 0 0,0% A.2 Taxonomy-Eligible but not environmental sustainable activities (not Taxonomy-aligned activities) Freight transport services by road 6.6 3 012 6,3% OPEX of Taxonomy-eligible but not environmentally sustainable activities (not Taxonomy-aligned activities) (A.2) 3 012 6,3% TOTAL (A.1 + A.2) 3 012 6,3% B. TAXONOMY-NON-ELIGIBLE ACTIVITIES OPEX of Taxonomy-non-eligible activities (B) 45 072 93,7% TOTAL (A + B) 48 084 100% Additional EU-taxonomy templates index
Row Economic activities Amount and proportion (the information is to be presented in monetary amounts and as percentages) CCM + CCA Climate change mitigation (CCM) Climate change adaptation (CCA) Amount % Amount % Amount % 1 Amount and proportion of taxonomy-
I and II to Delegated Regulation 2021/2139
0 0 0 0 0 0 2 Amount and proportion of taxonomy- aligned economic activity
Annexes I and II to Delegated Regulation 2021/2139 in the denominator
0 0 0 0 0 0 3 Amount and proportion of taxonomy- aligned economic activity
to
Annexes I and II to Delegated Regulation 2021/2139 in the denominator
0 0 0 0 0 0 4 Amount and proportion of taxonomy- aligned economic activity
to
Annexes I and II to Delegated Regulation 2021/2139
0 0 0 0 0 0
Amount and
of taxonomy-
I and II to Delegated Regulation 2021/2139
0 0 0 0 0 0
Amount and proportion of taxonomy-
and II to Delegated Regulation 2021/2139
0 0 0 0 0 0
and
of other taxonomy-aligned
0 0 0 0 0 0 8 Total applicable KPI 0 0 0 0 0 0
2 Taxonomy-aligned economic activities (denominator)
referred to in Section 4.27 of
of the applicable KPI
referred
in Section 4.28 of
of the applicable KPI
referred
in Section 4.29 of
5
proportion
economic
in the denominator of the applicable KPI
6
in the denominator of the applicable KPI
7 Amount
proportion
economic activities not
in the denominator of the applicable KPI
NO
NO
NO
NO
NO
and proportion
Template 3 Taxonomy-aligned economic activities (numerator)
economic activity referred to in Section 4.26 of Annexes
in the numerator of the applicable KPI
aligned economic activity referred to in Section 4.27 of Annexes
in the numerator of the applicable KPI
and proportion of taxonomy- aligned economic activity referred to in Section 4.28 of Annexes
and proportion of
and proportion
in the numerator of the applicable KPI
aligned economic activity referred to in Section 4.29 of Annexes
in the numerator of the applicable KPI
aligned economic activity referred to in Section 4.30 of Annexes
in the numerator of the
7 Amount and proportion of other taxonomy-eligible but not taxonomy-aligned economic activities not referred to in rows 1 to 6 above in the denominator of the applicable KPI
activities in the denominator of the applicable KPI
/ 137 GREENYARD APPROACH | ENVIRONMENTAL IMPACT | SOCIAL IMPACT | ECONOMIC IMPACT & GOVERNANCE | GREENYARD AT A GLANCE | FINANCIAL REPORT Template 5 Taxonomy non-eligible economic activities Row Economic activities Amount 1 000 EUR % 1 Amount and proportion of economic activity referred to in row 1 of Template 1 that is taxonomy-non-eligible in accordance with Section 4.26 of Annexes I and II to Delegated Regulation 2021/2139 in the denominator of the applicable KPI 0 0 2 Amount and proportion of economic activity referred to in row 2 of Template 1 that is taxonomy-non-eligible in accordance with Section 4.27 of Annexes I and II to Delegated Regulation 2021/2139 in the denominator of the applicable KPI 0 0 3 Amount and proportion of economic activity referred to in row 3 of Template 1 that is taxonomy-non-eligible in accordance with Section 4.28 of Annexes I and II to Delegated Regulation 2021/2139 in the denominator of the applicable KPI 0 0 4 Amount and proportion of economic activity referred to in row 4 of Template 1 that is taxonomy-non-eligible in accordance with Section 4.29 of Annexes I and II to Delegated Regulation 2021/2139 in the denominator of the applicable KPI 0 0 5 Amount and proportion of economic activity referred to in row 5 of Template 1 that is taxonomy-non-eligible in accordance with Section 4.30 of Annexes I and II to Delegated Regulation 2021/2139 in the denominator of the applicable KPI 0 0 6 Amount and proportion of economic activity referred to in row 6 of Template
that is taxonomy-non-eligible in
Section 4.31 of Annexes I and II to Delegated Regulation 2021/2139 in the denominator
the applicable KPI 0 0 7 Amount and proportion of other taxonomy-non-eligible economic activities not
to
in the denominator of the applicable KPI CAPEX: 61 343 OPEX: 45 072 Turnover: 4 681 907 CAPEX: 89,9% OPEX: 93,7% Turnover: 99,8% 8
proportion of taxonomy-non-eligible
CAPEX: 61 343 OPEX: 45 072 Turnover: 4 681 907 CAPEX: 89,9% OPEX: 93,7% Turnover: 99,8%
1
accordance with
of
referred
in rows 1 to 6 above
Total amount and
economic
Row Economic
Amount and proportion (the information is to be presented in monetary amounts and as percentages) CCM + CCA Climate change mitigation (CCM) Climate change adaptation (CCA) Amount % Amount % Amount % 1 Amount
taxonomyaligned
I and II to Delegated Regulation 2021/2139
0 0 0 0 0 0 2 Amount
I and II to Delegated Regulation 2021/2139
0 0 0 0 0 0 3 Amount
I and II to Delegated Regulation 2021/2139
0 0 0 0 0 0 4 Amount
I and II to Delegated Regulation 2021/2139
0 0 0 0 0 0 5 Amount
I and II to
Regulation 2021/2139
applicable KPI 0 0 0 0 0 0 6 Amount and proportion of taxonomy- aligned economic activity referred to in Section 4.31 of Annexes I and II to Delegated Regulation 2021/2139 in the numerator of the applicable KPI 0 0 0 0 0 0 7 Amount and proportion of other taxonomy-aligned economic activities not referred to in rows 1 to 6 above in the numerator of the applicable KPI 0 0 0 0 0 0 8 Total amount and proportion of taxonomy-aligned economic activities in the numerator of the applicable KPI 0 0 0 0 0 0 Template 4 Taxonomy-eligible but not taxonomy-aligned economic activities Row Economic activities Amount and proportion (the information is to be presented in monetary amounts and as percentages) CCM + CCA Climate change mitigation (CCM) Climate change adaptation (CCA) Amount 1 000 EUR % Amount 1 000 EUR % Amount % 1 Amount and proportion of taxonomyeligible but not taxonomy-aligned economic activity referred to in Section 4.26 of Annexes I and II to Delegated Regulation 2021/2139 in the denominator of the applicable KPI 0 0 0 0 0 0 2 Amount and proportion of taxonomyeligible but not taxonomy-aligned economic activity referred to in Section 4.27 of Annexes I and II to Delegated Regulation 2021/2139 in the denominator of the applicable KPI 0 0 0 0 0 0 3 Amount and proportion of taxonomy- eligible but not taxonomy-aligned economic activity referred to in Section 4.28 of Annexes I and II to Delegated Regulation 2021/2139 in the denominator of the applicable KPI 0 0 0 0 0 0 4 Amount and proportion of taxonomy- eligible but not taxonomy-aligned economic activity referred to in Section 4.29 of Annexes I and II to Delegated Regulation 2021/2139 in the denominator of the applicable KPI 0 0 0 0 0 0 5 Amount and proportion of taxonomy- eligible but not taxonomy-aligned economic activity referred to in Section 4.30 of Annexes I and II to Delegated Regulation 2021/2139 in the denominator of the applicable KPI 0 0 0 0 0 0 6 Amount and proportion of taxonomy- eligible but not taxonomy-aligned economic activity referred to in Section 4.31 of Annexes I and II to Delegated Regulation 2021/2139 in the denominator of the applicable KPI 0 0 0 0 0 0
CAPEX: 6 890 OPEX: 3 012 Turnover: 8 203 CAPEX: 10,1% OPEX: 6,3% Turnover: 0,2% CAPEX: 6 890 OPEX: 3 012 Turnover: 8 203 CAPEX: 10,1% OPEX: 6,3% Turnover: 0,2% 0 0
Total
KPI CAPEX: 6 890 OPEX: 3 012 Turnover: 8 203 CAPEX: 10,1% OPEX: 6,3% Turnover: 0,2% CAPEX: 6 890 OPEX: 3 012 Turnover: 8 203 CAPEX: 10,1% OPEX: 6,3% Turnover: 0,2% 0 0
activities
and proportion of
of taxonomy-
taxonomy-
of taxonomy-
Delegated
8
amount and proportion of taxonomy eligible but not taxonomy- aligned economic activities in the denominator of the applicable

138 / UNLEASHING THE PURE POWER OF PLANTS
Assurance statement auditor

/ 139 GREENYARD ANNUAL REPORT 2022/2023
Greenyard NV
Document subtitle= Verdana Heading 12 0/0 single
Greenyard NV
Independent assurance report on selected environmental, social and governance performance indicators published in the Annual Report
2022/2023 of Greenyard NV for the year ending 31 March 2023
Deloitte Bedrijfsrevisoren / Reviseurs d’Entreprises


140 / MESSAGE FROM OUR CO - CEO s | HIGHLIGHTS | GREENYARD’S RELEVANCE | FOOD OF THE FUTURE | PURE POWER OF PLANTS | DRIVEN BY PASSION & PEOPLE
Independent assurance report on selected environmental, social and governance performance indicators published in the Annual Report 2022/2023 of Greenyard NV for the year ended 31 March 2023
To the board of directors
We have been engaged to conduct a limited assurance engagement on selected environmental, social and governance performance indicators (“Selected Information”) published in the Annual Report 2022/2023 of Greenyard NV (“the Company”) for the year ending 31 March 2023 In preparing the Selected Information, Greenyard NV applied the criteria as specified in the table below. The Selected Information needs to be read and understood together with the Applicable Criteria.
The Selected Information in scope of our engagement are listed in the table below and are identified with in section “Data tables” of the Annual Report 2022/2023 as from p.148:
Water intensity
Own indicator: The water use of the Frozen and Prepared divisions divided by their processed volumes
Share of grower base mapped for water risk
& by-products for human consumption (charity)
Own indicator: The share of volumes originating from regions with high, medium and low overall water risk according to the WWF Water Risk Filter. Waste
Overstock & by-products for animal feed
Volume of waste materials, by waste stream
Certification Share of grower base certified for social compliance

Volume of primary packaging, by material
Own indicator: The share of volumes from high and medium risk origins supplied by suppliers who are certified for social compliance according to the SIFAV basket of social standards
301-1
Packaging
Primary packaging material that is recyclable
Own indicator: The share of the total volume of packaging which is recyclable. Assumed is that glass, metal, paper and cardboard are 100% recyclable. For plastics the share of nonrecyclable plastics is deducted.
/ 141 GREENYARD APPROACH | ENVIRONMENTAL IMPACT | SOCIAL IMPACT | ECONOMIC IMPACT & GOVERNANCE | GREENYARD AT A GLANCE | FINANCIAL REPORT Greenyard NV | 31 March 2023 1
Selected Information Applicable Criteria Impact category Indicator in scope of assurance Energy Energy Intensity GRI 302-3 Total fuel consumption, by fuel type GRI 302-1 Total electricity consumption, by energy source GRI 302-1 GHG Scope 1 GHG emissions GRI 305-1 Scope 2 GHG emissions GRI 305-2 Water Volume of effluent water discharged, by destination GRI 303-4 Volume of freshwater consumption, by source GRI 303-3
Overstock
GRI 306-4
GRI 306-4
GRI 306-4
GRI
+
306-5
GRI
Greenyard NV | 31 March 2023
Sourcing
Volume share of organic products
Volume share of Fair Trade products
Reported/registered breaches against the Greenyard Code of Conduct
Own indicator: organic products refers to the volume share of certified organic products
Own indicator: Fair Trade refers to the volume share of certified Fair Trade products
Own indicator: Number of internal whistleblower reports which were founded and confirmed as breach against Greenyard’s Code of Conduct following internal investigations
Governance
Lawsuits or fines for noncompliance with regulations related to wellbeing and social matters
Lawsuits or fines for noncompliance with regulations regarding corruption and fraud
SBTi Number of suppliers with SBTi targets
Own indicator: Number of lawsuits or fines exceeding €5 000 for non-compliance with regulations related to wellbeing (incl. occupational health and safety) and so cial matters.
Own indicator: Number of lawsuits or fines exceeding €5 000 for non-compliance with regulations regarding corruption, fraud, (direct & indirect)bribery, money-laundering and financing terrorism.
Own indicator: Share of suppliers (by procurement spend, scope Purchased goods and services, upstream and downstream transport and logistics) committed to setting science-based targets
Based on our work as described in this report, nothing has come to our attention that causes us to believe that the above-mentioned Selected Information as included in the Annual Report 2022/2023 of Greenyard NV, has not been prepared, in all material respects, in accordance with the Applicable Criteria.
R Responsibility of the board of directors
The board of directors of Greenyard NV is responsible for the preparation of the Selected Information and the references made to it presented in the Annual Report as well as for the declaration that its reporting meets the requirements of Applicable Criteria.
The board of directors is also responsible for:
Selecting and establishing the Applicable Criteria;
Preparing, measuring, presenting and reporting the Selected Information in accordance with the Applicable Criteria;
Designing, implementing, and maintaining internal processes and controls over information relevant to the preparation of the Selected Information to ensure that they are free from material misstatement, including whether due to fraud or error;
Providing sufficient access and making available all necessary records, correspondence, information and explanations to allow the successful completion of the Services;
Confirming to us through written representations that you have provided us with all information relevant to our Services of which you are aware, and that the measurement or evaluation of the underlying subject matter against the Applicable Criteria, including that all relevant matters, are reflected in the Selected Information.
142 / MESSAGE FROM OUR CO - CEO s | HIGHLIGHTS | GREENYARD’S RELEVANCE | FOOD OF THE FUTURE | PURE POWER OF PLANTS | DRIVEN BY PASSION & PEOPLE
2
Greenyard
Our responsibilities
Our responsibility is to express a conclusion on the Selected Information based on our procedures. We conducted our engagement in accordance with International Standard on Assurance Engagements ISAE 3000 (Revised) Assurance Engagements Other than Audits or Reviews of Historical Financial Information , issued by the International Auditing and Assurance Standards Board (IAASB), in order to state whether anything had come to our attention that causes us to believe that the Selected Information have not been prepared, in all material respects, in accordance with the Applicable Criteria.
Applying these standards, our procedures are aimed at obtaining limited assurance on the fact that the Selected Information do not contain material misstatements. The procedures performed in a limited assurance engagement vary in nature and timing from, and are less in extent than for, a reasonable assurance engagement and consequently, the level of assurance obtained in a limited assurance engagement is substantially lower than the assurance that would have been obtained had a reasonable assurance engagement been performed.
Our work was performed on the data gathered and retained in the reporting scope by Greenyard NV as mentioned above. Our conclusion covers therefore only the abovementioned Selected Information of the Annual Report 2022/2023 and not all information included in the Annual Report 2022/2023 The limited assurance on the Selected Information was only performed on the Selected Information coverin g the year ending 31 March 2023
We are required to plan and perform our work to addres s the areas where we have identified that a material misstatement of the description of activities undertaken in respect of the Selected Information is likely to arise. The procedures we performed were based on our professional judgment. In carrying out ou r limited assurance engagement on the description of activities undertaken in respect of the Selected Information, we performed the following key procedures:
Obtaining an understanding of the Company’s business, including internal controls relevant to collection of the Selected Information. This included inquiry with Greenyard NV management responsible for operational performance in the areas responsible for the data underlying the Selected Information;
Considering the risk of material misstatement of the Selected Information;
Performing analytical procedures;
Recalculation of relevant formula’s used in manual calculations and assessment whether the data has been appropriately consolidated;
Assessing management’s assumptions and estimates ;
Examining, on a sample basis, internal and external supporting evidence and performing consistency checks on the consolidation of the Selected Information
Read the narrative accompanying the Selected Information with regard to the Applicable Criteria, and for consistency with our findings.
We apply International Standard on Quality Control 1 and, accordingly, maintain a comprehensive system of quality control including documented policies and procedures regarding compliance with ethical requirements, professional standards and applicable legal and regulatory requirements.
In conducting our engagement, we have complied with the independence and other ethical requirements of the Code of Ethics for Professional Accountants issued by the International Ethics Standards Board for Accountants (IESBA), which is founded on fundamental principles of integrity, objectivity, professional competence and due care, confidentiality and professional behaviour.
/ 143 GREENYARD APPROACH | ENVIRONMENTAL IMPACT | SOCIAL IMPACT | ECONOMIC IMPACT & GOVERNANCE | GREENYARD AT A GLANCE | FINANCIAL REPORT
3
NV | 31 March 2023
Greenyard NV | 31 March 2023
Inherent limitations of thhe Selected Information
We obtained limited assurance over the preparation of the Selected Information in accordance with the Applicable Criteria. Inherent limitations exist in all assurance engagements.
Inherent limitations of the Selected Information
We obtained limited assurance over the preparation of the Selected Information in accordance with the Applicable Criteria. Inherent limitations exist in all assurance engagements. Any internal control structure, no matter how effective, cannot eliminate the possibility that fraud, errors or irregularities may occur and remain undetected and because we use selective testing in our engagement, we cannot guarantee that errors or irregularities, if present, will be detected.
Any internal control structure, no matter how effective, cannot eliminate the possibility that fraud, errors or irregularities may occur and remain undetected and because we use selective testing in our engagement, we cannot guarantee that errors or irregularities, if present, will be detected.
The self-defined Applicable Criteria, the nature of the Selected Information, and absence of consistent external standards allow for different, but acceptable, measurement methodologies to be adopted which may result in variances between entities. The adopted measurement methodologies may also impact comparability of the Selected Information reported by different organizations and from year to year within an organization as methodologies develop.
Use of our report
The self-defined Applicable Criteria, the nature of the Selected Information, and absence of consistent external standards allow for different, but acceptable, measurement methodologies to be adopted which may result in variances between entities. The adopted measurement methodologies may also impact comparability of the Selected Information reported by different organizations and from year to year within an organization as methodologies develop.

This report is made solely to the board of directors of Greenyard NV in accordance with ISAE 3000 (Revised) and our agreed terms of engagement. Our work has been undertaken so that we might state to the board of directors those matters we have agreed to state to them in this report and for no other purpose.
U Use of our report
This report is made solely to the board of directors of Greenyard NV in accordance with ISAE 3000 (Revised) and our agreed terms of engagement. Our work has been undertaken so that we might state to the board of directors those matters we have agreed to state to them in this report and for no other purpose.
Without assuming or accepting any responsibility or liability in respect of this report to any party other than the Company and its board of directors, we acknowledge that the board of directors may choose to make this report publicly available for others wishing to have access to it, which does not and will not affect or extend for any purpose or on any basis our responsibilities. To the fullest e xtent permitted by law, we do not accept or assume responsibility to anyone other than Greenyard NV and its board of directors as a body, for our work, for this report, or for the conclusions we have formed.
Signed at Zaventem
Deloitte Bedrijfsrevisoren/Réviseurs d’Entrreprises BV/SRL
Without assuming or accepting any responsibility or liability in respect of this report to any party other than the Company and its board of directors, we acknowledge that the board of directors may choose to make this report publicly available for others wishing to have access to it, which does not and will not affect or extend for any purpose or on any basis our responsibilities. To the fullest e xtent permitted by law, we do not accept or assume responsibility to anyone other than Greenyard NV and its board of directors as a body, for our work, for this report, or for the conclusions we have formed.
Represented by
Signed at Zaventem
D Deloitte Bedrijfsrevisoren/Réviseurs d’Entreprises BV/SRL
Represented by
Kurt Dehoorne Sofian Milad
Member of Deloitte Touche Tohmatsu Limited

144 / MESSAGE FROM OUR CO - CEO s | HIGHLIGHTS | GREENYARD’S RELEVANCE | FOOD OF THE FUTURE | PURE POWER OF PLANTS | DRIVEN BY PASSION & PEOPLE
Bedrijfsrevisoren/Réviseurs
Registered Office: Gateway building, Luchthaven Brussel Nationaal 1 J, B -1930 Zaventem VAT BE 0429.053.863 - RPR Brussel/RPM Bruxelles - IBAN BE86 5523 2431 0050 - BIC GKCCBEBB
Deloitte
d’Entreprises BV/SRL
Greenyard NV | 31 March 2023
Bedrijfsrevisoren/Réviseurs
Registered Office: Gateway building, Luchthaven Brussel Nationaal 1 J, B-1930 Zaventem VAT BE 0429.053.863 - RPR Brussel/RPM Bruxelles - IBAN BE86 5523 2431 0050 - BIC GKCCBEBB Member of Deloitte Touche Tohmatsu Limited
Deloitte
d’Entreprises BV/SRL

/ 145 GREENYARD APPROACH | ENVIRONMENTAL IMPACT | SOCIAL IMPACT | ECONOMIC IMPACT & GOVERNANCE | GREENYARD AT A GLANCE | FINANCIAL REPORT

146 / UNLEASHING THE PURE POWER OF PLANTS
Data tables

/ 147 GREENYARD ANNUAL REPORT 2022/2023
Environmental impact
1 GHG emission calculations are performed in May and make use of the most recent available emission factors from the different databases at the time of calculation.
2 Based on average-data method, except upstream transport were the distance-based method was used. Capital goods, employee commuting, processing of sold products, end of life treatment of sold products and investments are excluded due to their negligible share of emissions..
* As a result of an improvement in data collection, the 2021-22 figures have been restated from those published in the previous Sustainability Report. ** KPIs in scope of the limited assurance assignment by the statutory auditor for the year 2022/2023.
148 / MESSAGE FROM OUR CO - CEO s | HIGHLIGHTS | GREENYARD’S RELEVANCE | FOOD OF THE FUTURE | PURE POWER OF PLANTS | DRIVEN BY PASSION & PEOPLE Scale of the organisation* Unit 2020/2021 like-for-like 2021/2022 2022/2023 Total employees, by country* FTE 8 668 8 702 8 470 Austria % 1,5 1,5 1,5 Belgium % 30,7 32,1 32,4 Czech Republic % 3,1 3,2 3,3 France % 7,5 7,7 7,6 Germany % 9,1 9,0 8,8 Italy % 0,7 0,7 0,7 Netherlands % 17,4 17,4 18,5 Poland % 15,6 14,4 14,2 Spain % 1,1 1 1,1 United Kingdom % 9,5 9,3 8,1 United States % 2,6 2,5 2,7 Overseas sales & sourcing offices % 1,2 1,2 1,1 Climate action1 Unit 2020/2021 like-for-like 2021/2022 2022/2023 Scope 1 GHG emissions** Ton CO2-eq 72 377 72 634 66 934 Scope 2 GHG emissions – Location based* / ** Ton CO2-eq 83 343 80 706 77 487 Scope 2 GHG emissions – Market based* / ** Ton CO2-eq 61 095 54 217 49 008 Scope 3 GHG emissions2* Ton CO2-eq - 2 929 654 2 840 884 Total fuel consumption, by fuel type* / ** MWh 333 380 318 753 306 662 Natural gas % 77,8 77,2 74,9 Fuel oil for transport % 21,8 22,2 22,4 Fuel oil for heating % 0,4 0,6 2,7 Total electricity consumption, by energy source** MWh 296 099 306 119 296 605 Non-renewable energy from a variety of fuel sources % 90 89 84 Renewable energy self-generated or purchased % 10 11 16 Energy-intensity Long Fresh segment** MWh/ton 0,75 0,73 0,75 Share of suppliers (by procurement spend) committed to setting science-based targets % - - 12
Sustainable agriculture**
* As a result of an improvement in data collection, the 2021-22 figures have been restated from those published in the previous Sustainability Report. ** KPIs in scope of the limited assurance assignment by the statutory auditor for the year 2022/2023.
/ 149 GREENYARD APPROACH | ENVIRONMENTAL IMPACT | SOCIAL IMPACT | ECONOMIC IMPACT & GOVERNANCE | GREENYARD AT A GLANCE | FINANCIAL REPORT Water stewardship Unit 2020/2021 like-for-like 2021/2022 2022/2023 Volume of freshwater consumption, by source** Million m³ 4 083 4 161 3 988 Municipal water % 52 52 52 Groundwater % 47 47 47 Rainwater % 1 1 1 Water intensity Long Fresh segment** m³/ton 6,20 6,46 6,49 Volume of effluent water discharged, by destination* / ** Million m³ 3 486 3 506 3 382 Surface water % 91 92 91 Third party % 9 8 9 Wastewater Chemical Oxygen Demand (COD) Ton - - 978 Wastewater Biological Oxygen Demand (BOD) Ton - - 893 Zero waste* Volume of food donated to charities** Ton 2 112 3 344 4 877 Volume of by-products and waste materials, by stream*/** Ton 195 266 196 207 192 861 Waste to be re-used** % 59.6 61,6 58,0 Waste for recycling** % 36,9 35,3 38,6 Waste for energy recovery** % 3,2 2,9 3,1 Landfill or incineration without energy recovery** % 0,3 0,3 0,3 Volume of hazardous waste Ton 106 173 52 Circular packaging* / ** Volume of primary packaging, by material Ton 65 782 61 236 65 532 Glass % 60,4 58,8 61,7 Metal % 13,7 16,5 15,0 Plastic % 20,3 17,3 15,8 Cardboard % 5,5 7,3 7,4 Wood % 0,02 0,01 0,1 Primary packaging material that is recyclable % 98,6 98,8 99,5
Volume share of organic products Fresh segment % 5,4 7,3 7,3 Volume share of organic products Long Fresh segment % 3,6 4,4 4,5
Social impact
Diversity & inclusion
* As a result of an improvement in data collection, the 2021-22 figures have been restated from those published in the previous Sustainability Report. ** KPIs in scope of the limited assurance assignment by the statutory auditor for the year 2022/2023.
150 / MESSAGE FROM OUR CO - CEO s | HIGHLIGHTS | GREENYARD’S RELEVANCE | FOOD OF THE FUTURE | PURE POWER OF PLANTS | DRIVEN BY PASSION & PEOPLE Responsible sourcing Unit 2020/2021 like-for-like 2021/2022 2022/2023 Share of grower base in high and medium risk origins certified for social compliance** % - 77 80 Volume share of Fair Trade products Fresh segment* / ** % 1,5 1,7 1,6 Health & nutrition Value share of fruit & vegetable products % 94,2 93,8 93,8 Reformulated products introduced with reduced salt or sugar levels Number 27 22 19
Gender distribution amongst employees Female % 39 39 39 Male % 61 61 61 Gender distribution amongst management Female % 23 22 21 Male % 77 78 79 Unadjusted gender pay gap % - - 12 Age distribution amongst employees ≤20 % 1 1 1 21-30 % 16 16 16 31-40 % 26 27 25 41-50 % 29 28 29 51-60 % 23 23 24 61-70 % 5 5 5 Employee workplace Office employee % 23 20 20 Warehouse/operations employee % 77 80 80 Own vs third-party employees Own employees % 67 68 69 Third-party employees % 33 32 31
Economic impact & Governance
3 Number of internal reports received according to Greenyard’s whisteblowing policy.
4 Number of internal whistelblower reports which were founded and confirmed as breach against Greenyard’s Code of Conduct following internal investigations.
5 Number of lawsuits or fines exceeding €5 000 for non-compliance with regulations related to wellbeing (incl. occupational health and safety) and social matters.
6 Number of lawsuits or fines exceeding €5 000 for non-compliance with regulations regarding corruption, fraud, (direct & indirect)bribery, money-laundering and financing terrorism.
* As a result of an improvement in data collection, the 2021-22 figures have been restated from those published in the previous Sustainability Report.
** KPIs in scope of the limited assurance assignment by the statutory auditor for the year 2022/2023.
/ 151 GREENYARD APPROACH | ENVIRONMENTAL IMPACT | SOCIAL IMPACT | ECONOMIC IMPACT & GOVERNANCE | GREENYARD AT A GLANCE | FINANCIAL REPORT Social dialogue Unit 2020/2021 like-for-like 2021/2022 2022/2023 Employees covered by collective bargaining agreements* % 59 59 60 Employees represented by works council or health & safety committee % - - 87 Employees participating in engagement surveys % - - 42 Employee development Average hours of training per employee Hours 8,4 13,1 10 Number of employees receiving training Number - 4 921 4 225 Health, safety and wellbeing* Work-related accidents wit lost time Number 316 295 256 Frequency rate Fresh segment Number - - 30 Severity rate Fresh segment Number - - 0,31 Frequency rate Long Fresh segment Number 35 48 48 Severity rate Long Fresh segment Number 1,09 1,59 1,66 Governance Unit 2020/2021 like-for-like 2021/2022 2022/2023 Grievance mechanism Whistleblower reports received3 Number 0 0 8 Confirmed breaches against the Greenyard Code of Conduct4 Number 0 0 3 Lawsuits or fines for non-compliance with regulations related to wellbeing and social matters5*/** Number 0 1 0 Lawsuits or fines for non-compliance with regulations regarding corruption and fraud6** Number 0 0 0 Facilities certified on social compliance Number - 6 6 Food safety,
and
Facilities operating to an international food safety system % 100 100 100 Audit days carried out by certification bodies Days 257 260 223 Analyses on products Number 66 716 65 027 73 764 Analyses on equipment and facilities Number 28 906 28 703 27 654
quality
traceability

152 / UNLEASHING THE PURE POWER OF PLANTS
GRI-index

/ 153 GREENYARD ANNUAL REPORT 2022/2023
General Disclosures
1. Organizational profile
102-1
Name of the organization Greenyard NV
102-2 Activities, brands, products and services
- Greenyard at a glance, p.119
- Greenyard Financial Report 2022/2023, p.244 102-3 Location of headquarters Greenyard at a glance, p.119
102-4 Location of operations
at a glance, p.119 102-5 Ownership and legal form Greenyard Financial Report 2022/2023, p.218
102-6 Markets served Greenyard at a glance, p.119 102-7 Scale of the organization
- Greenyard at a glance, p.119
- Greenyard Financial Report 2022/2023, p.244
- Data tables, p.147 102-8
Information on employees and other workers Data tables, p.147 102-9 Supply chain Greenyard at a glance, p.119
Significant changes to the organization and its supply chain. Greenyard Financial Report 2022/2023, p.170 102-11 Precautionary Principle or approach
- Message from our co-CEOs, p.5
- Materiality assessment p.62 102-12 External initiatives
- CDP
- EU Code of conduct on Responsible Food Business and Marketing Practices
- Moody’s ESG
- MSCI
- Science Based Targets initiative
- SEDEX
- Sustainalytics
- Sustainability Initiative Fruit and Vegetables (SIFAV 2025)
- TCFD
- World Benchmarking Alliance
Membership of associations Stakeholder engagement p.64
2. Strategy
102-14 Statement from senior decision-maker Message from our co-CEOs, p.5
3. Ethics and Integrity
102-16
Values, principles, standards, and norms of behavior
- Greenyard's sustainability model, p.60
- Governance, p.109
- Greenyard Code of Conduct
- Greenyard Supplier Code of Conduct
154 / MESSAGE FROM OUR CO - CEO s | HIGHLIGHTS | GREENYARD’S RELEVANCE | FOOD OF THE FUTURE | PURE POWER OF PLANTS | DRIVEN BY PASSION & PEOPLE
Greenyard
102-10
102-13
4.
102-18 Governance structure Governance, p.109
5. Stakeholder engagement
102-40
List of stakeholder groups Stakeholder engagement, p.64
102-41 Collective bargaining agreements Data tables, p.147
102-42
102-43
Identifying and selecting stakeholders Stakeholder engagement, p.64
Approach to stakeholder engagement Stakeholder engagement, p.64
102-44 Key topics and concerns raised
6. Reporting practice
engagement, p.64
102-45 Entities included in the consolidated financial statements Greenyard Financial Report 2022/2023, p.280
102-46 Defining report content and topic boundaries
102-47
- Materiality assessment p.62 - Governance p.109
of material topics Materiality assessment, p.62
of information
tables, p.147
in reporting There are no significant changes compared to the previous reporting period.
The report has been prepared in accordance with the core option of the Global Reporting Initiative Standard and meets the requirements of the EU non-financial reporting Directive. 102-55
Content Index GRI Content Index, p.154
assurance
A limited assurance engagement has been executed in accordance with the International Standard for Assurance Engagement ISAE 3000, the concluding limited assurance letter is included in the report.
/ 155 GREENYARD APPROACH | ENVIRONMENTAL IMPACT | SOCIAL IMPACT | ECONOMIC IMPACT & GOVERNANCE | GREENYARD AT A GLANCE | FINANCIAL REPORT
Governance
Stakeholder
Restatements
102-49 Changes
102-50 Reporting period 1 April 2022-31 March 2023 102-51 Date of most recent report 15 September
102-52 Reporting cycle Annual 102-53 Contact
sustainability@greenyard.group 102-54 Claims
List
102-48
Data
2022
point for questions regarding the report
of reporting in accordance with the GRI standards
External
GRI
102-56
Specific Disclosures
Material topic: Food waste & circular economy
103-1
103-2
103-3
Management approach disclosures
GRI 301 Materials 2016
301-1
Materials used by weight or volume
- Sustainability model, p.60
- Sustainability Roadmap & Ambitions, p.66
- Materiality assessment, p.62
- Food waste & circular economy, p.86
- Data tables, p.147
- Food waste & circular economy , p.86
- Data tables, p.147
Own indicator Primary packaging material that is recyclable1 Data tables, p.147
GRI 306 Waste 2020
306-3
306-4
306-5
Hazardous waste Data tables, p.147
Waste diverted from disposal
Waste directed to disposal
Material topic: Climate change & footprint reduction
103-1 103-2 103-3
GRI 302 Energy 2016
302-1
302-3
Management approach disclosures
- Food waste & circular economy , p.86
- Data tables, p.147
- Food waste & circular economy , p.86
- Data tables, p.147
- Sustainability model, p.60
- Sustainability Roadmap & Ambitions, p.66
- Materiality assessment, p.62
- Climate change & footprint reduction, p.79
- Data tables, p.147
Energy consumption within the organization
Energy intensity
GRI 305 Emissions 2016
305-1
305-2
305-3
Own indicator
Direct greenhouse gas (GHG) emissions (Scope 1)
Energy indirect greenhouse gas (GHG) emissions (Scope 2)
Other indirect greenhouse gas (GHG) emissions (Scope 3)
Share of suppliers committed to setting sciencebased targets2
- Climate change & footprint reduction, p.79
- Data tables, p.147
- Climate change & footprint reduction, p.79
- Data tables, p.147
- Climate change & footprint reduction, p.79
- Data tables, p.147
- Climate change & footprint reduction, p.79
- Data tables, p.147
- Climate change & footprint reduction, p.79
- Data tables, p.147
- Data tables, p.147
1 The share of the total volume of packaging which is recyclable. We assume glass, metal, paper and cardboard are 100% recyclable. For plastics the share of non-recyclable plastics (mostly multimaterial laminates) is deducted. The assumptions to determine the recyclability of plastic packaging may vary per country based on the information available.
2 Share of suppliers (by procurement spend, scope purchased goods and services, upstream and downstream transport and logistics) committed to setting science-based targets
156 / MESSAGE FROM OUR CO - CEO s | HIGHLIGHTS | GREENYARD’S RELEVANCE | FOOD OF THE FUTURE | PURE POWER OF PLANTS | DRIVEN BY PASSION & PEOPLE
Material topic: Water stewardship
103-1
103-2
103-3
Management approach disclosures
GRI 303 Water and effluents 2018
303-1
303-2
303-3
303-4
Own indicator
Management approach disclosures: Interactions with water as a shared resource
Management approach disclosures: Management of water discharge-related impacts
Water withdrawal
Water discharge
Water intensity Long Fresh segment3
Own indicator Overall water risk Greenyard volumes4
Material topic: Responsible sourcing
103-1 103-2 103-3
Management approach disclosures
GRI 308 Supplier environmental assessment 2016
308-1
New suppliers that were screened using environmental criteria
GRI 414 Supplier social assessment for labor practices 2016
414-1 New suppliers that were screened using labor practices criteria
414-2 Significant actual and potential negative human rights impacts in the supply chain and actions taken
Own indicator Share of grower base certified for social compliance5
Own indicator Volume share of Fair Trade products Fresh segment6
3 The water use of the Frozen and Prepared divisions divided by their processed volumes.
- Sustainability model, p.60
- Sustainability Roadmap & Ambitions, p.66
- Materiality assessment, p.62
- Water stewardship, p.83
- Data tables, p.147
Water stewardship, p.83
Water stewardship, p.83
Data tables, p.147
Data tables, p.147
Data tables, p.147
Water stewardship, p.83
- Sustainability model, p.60
- Sustainability Roadmap & Ambitions, p.66
- Materiality assessment, p.62
- Sustainable agriculture & biodiversity, p.89
- Responsible sourcing, p.95
- Data tables, p.147
- Greenyard at a glance, p.119
Responsible sourcing, p.95
All our key suppliers of raw materials are assessed on environmental factors.
Responsible sourcing, p.95
All our key suppliers of raw materials are assessed on labor practices.
Responsible sourcing, p.95
- Responsible sourcing, p.95
- Data tables, p.147
- Responsible sourcing, p.95
- Data tables, p.147
4 The share of volumes originating from regions with high, medium and low overall water risk according to the WWF Water Risk Filter.
5 The share of volumes from high and medium risk origins supplied by suppliers who are certified for social compliance according to the SIFAV basket of social standards.
6 The volume share of Fair Trade certified products.
/ 157 GREENYARD APPROACH | ENVIRONMENTAL IMPACT | SOCIAL IMPACT | ECONOMIC IMPACT & GOVERNANCE | GREENYARD AT A GLANCE | FINANCIAL REPORT
Material topic: Sustainable agriculture & biodiversity
103-1
103-2
103-3
Management approach disclosures
GRI 304 Biodiversity 2016
304-1
Operational sites owned, leased, managed in (or adjacent to) protected areas and areas of high biodiversity value outside protected areas
- Sustainability model, p.60
- Sustainability Roadmap & Ambitions, p.66
- Materiality assessment, p.62
- Sustainable agriculture & biodiversity, p.89
- Data tables, p.147
- Greenyard at a glance, p.119
Greenyard operates 3 processing sites adjacent to biodiversity sensitive areas (Natura 2000). All facilities have current environmental permits which consider the potential impact from the operations on the areas in the overarching risk assessment. None of the operations is negatively impacting the biodiversity sensitive areas.
The relevant sites are:
- Greenyard Prepared Belgium, Bree site adjacent to the Natura 2000 area Noord-Oost Limburg
- Greenyard Prepared Belgium, Rijkevorsel site adjacent to the Natura 2000 area Heesbossen
- Greenyard Frozen UK, King’s Lynn site adjacent to The Wash and North Norfolk Coast SAC
Own indicator Volume share of organic products7
- Sustainable agriculture & biodiversity, p.89
- Data tables, p.147
158 / MESSAGE FROM OUR CO - CEO s | HIGHLIGHTS | GREENYARD’S RELEVANCE | FOOD OF THE FUTURE | PURE POWER OF PLANTS | DRIVEN BY PASSION & PEOPLE
7 The volume share of certified organic products.

/ 159 GREENYARD APPROACH | ENVIRONMENTAL IMPACT | SOCIAL IMPACT | ECONOMIC IMPACT & GOVERNANCE | GREENYARD AT A GLANCE | FINANCIAL REPORT

160 / UNLEASHING THE PURE POWER OF PLANTS
Financial Report

/ 161 GREENYARD ANNUAL REPORT 2022/2023
GEERT PEETERS

Message from the CFO
was not a straightforward year. For no-one. Already in late 2021, we noticed the first signs of (hyper) inflation, global businesses were confronted post-COVID with further disruptions in the chain and the labour market became more and more tight. The macro-economic context became even more complex in February 2022, with the armed Russian invasion in Ukraine. This led, among many other things, to an explosion of energy prices. Greenyard CFO Geert Peeters explains how Greenyard kept a steady course on these turbulent waters.
The impact of these combined events became increasingly visible in the months after March 2022, both within our sector and across the global economy. Re-reading our last annual report, the word ‘stagility’ – combining a stable long-term vision with the flexibility to adapt quickly to changing circumstances – proved almost to be prophetic. ‘Stagility’ was the guiding principle for how we successfully steered Greenyard through, yet another, globally challenging year.
Swiftly shifting gears, in close collaboration with growers and customers, proved to be vital. More specifically, constantly looking for efficient and effective solutions for our customers and for their consumers allowed us to guarantee stability and value creation, which is right at the heart of our customer promise. The trust that we have built over the past years, and the transparency we have displayed on a daily basis in our close relationships, now also allowed for open communication and a transparent dialogue about rising input prices and the value we create for our customers, and for partners throughout the entire food value chain.
Greenyard continuously monitored rising costs in various cost categories and limited them as much as possible. We acted fast and discussed prices with our suppliers and customers on various moments during the year. This was necessary to keep the chain viable at all times, and at the same time preserving the margins and fair value for Greenyard, our suppliers and our customers. As a result, at Group level, we were able to increase our prices by 8,5%, in line with (but still just below) inflation.
Despite volumes in the Fresh segment dropping after COVID, and pressure on purchasing power for end-consumers, Greenyard was able to strengthen its market position. Especially in those markets where we have integrated, and long-term, customer relationships. In Long Fresh, sales initially grew due to the revival of food service and industry customers, and following an increased hunger for convenience products. The underlying trend towards healthier and easy-to-prepare products remains strong. A transition to close-to-crop, pure-plant foods that is happening right now, and which is straight in line with Greenyard’s global offering. Additionally, the trend from branded products to private label also favours our performance.
To face new challenges vigorously, we also worked on upgrading our financing. In May 2022, € 90m of cash was raised via a real estate transaction of the Greenyard Prepared site in Bree. The proceeds were fully used to diversify our financing and to voluntarily reduce bank debt. A new five-year bank financing was then concluded in September, which would replace the existing financing. This laid a stable foundation for growth in the coming years.
Anticipating rising interest rates, a substantial part of the floating interest rate was already hedged before
162 / MESSAGE FROM OUR CO - CEO s | HIGHLIGHTS | GREENYARD’S RELEVANCE | FOOD OF THE FUTURE | PURE POWER OF PLANTS | DRIVEN BY PASSION & PEOPLE
2022
On a steady course towards a healthier future for all
summer. In a second step, the bank loans were converted to sustainability-linked loans in early 2023. At Greenyard, sustainability is fully integrated in all decisions and policies. After all, without sustainability and without nature, our products would not even exist. So, it was natural for us to also build sustainability objectives into our financing.
Already in the first half of the year, we saw that sales increased, and our Adjusted EBITDA was moving in the right direction to deliver on stable results. Still, like everyone experienced, the macroeconomic context and volatility was worrying. At the same time, we noticed that Greenyard was a stable factor in a very difficult market situation and that we were gaining market share. However, it was difficult to look far ahead and estimate how quickly the macroeconomic and political context would change.
Today, we see that estimates for the fresh fruit and vegetable European market indicate an approximate decline of 10% in fresh fruit and vegetable consumption for last year, 2022. It seems that consumers bought cheaper products within the Fresh segment and even temporarily switched to other, often less healthy, product categories. Contrary to these projections, Greenyard, sees only a very limited decline of - 1,9% in volume in its Fresh segment. And in its Long Fresh segment, there is even volume growth of 4,5%. As a result, volumes at Group level remained stable (- 0,8%).
For the full year 2022-2023 we announce an Adjusted EBITDA of € 167,3m. As a result, we realise a margin of 3,6% despite sharply increased input prices, yet on stable group volumes. This gives confidence for the future.
In parallel, Greenyard displayed its agility. We took the necessary measures in the past year to prepare ourselves and to quickly adapt to the changed market conditions,
improving our overall position. We did so by taking additional organisational measures that generated one-off expenses. The Fresh activity in the UK was phased out, and we are currently looking at integrating the Greenyard Fresh France organisation into neighbouring countries. Combined with increased financial costs due to rising interest rates, which were still limited thanks to our proactive hedging measures, the net result amounted to € 9,3m.
Greenyard's financial position further strengthened with net financial debt decreasing from € 303,6m to € 277,3m. This lowered the pre-IFRS 16 debt ratio from 2,4x to 2,2x.
On the back of these strong results, Greenyard has therefore decided to pay a dividend for the first time since October 2018, as part of a stable dividend policy. For the past financial year, a dividend of € 0,10 per share will be proposed to the general meeting of shareholders.
Looking forward, and following our performance last year, we trust that growth will continue. For the coming year, we see an increasing Adjusted EBITDA of € 175180m for a revenue of € 4,9bn. Looking to 25/26, we have the ambition to grow further to € 5,4bn revenue (5% CAGR) with an Adjusted EBITDA of € 200-210m.
Greenyard remains mindful to further growth opportunities through the expansion of its integrated customer relationships, an innovative product portfolio and through external growth. We fully embrace the role we have within the transition towards a healthy and sustainable future, and the impact we can have on a global scale within this journey. We look forward to further pursuing our mission and purpose and accelerating our ambition to improve life.
/ 163 GREENYARD APPROACH | ENVIRONMENTAL IMPACT | SOCIAL IMPACT | ECONOMIC IMPACT & GOVERNANCE | GREENYARD AT A GLANCE | FINANCIAL REPORT
Geert Peeters, CFO Greenyard
Swiftly shifting gears, in close collaboration with growers and customers, proved to be vital. Constantly looking for efficient and effective solutions for our customers and for their consumer created stability and value creation, which is right at the heart of our customer promise."
Geert Peeters, CFO Greenyard
CONTENTS | CONTENTS FINANCIAL REPORT 164 / Key financial information 169 Sales and Adjusted EBITDA per operating segment 173 Report of the board of directors 175 Comments on the consolidated financial statements 176 1. Consolidated income statement 176 2. Consolidated statement of financial position 177 3. Consolidated statement of cash flows 178 Dividends 178 Position of the company: risks and uncertainties 179 Important events after balance sheet date 183 Corporate governance statement 184 1. Board of Directors 185 1.1. Composition of the Board of Directors 185 1.2. Role and responsibilities of the Board of Directors 190 1.3. Evaluation of the Board of Directors –self-assessment 191 2. Advisory Committees to the Board of Directors 192 2.1. Audit Committee 192 2.2. Nomination and Remuneration Committee 194 3. Attendance at Board of Directors and Advisory Committees meetings 196 4. Executive Management 197 4.1. Composition of the Executive Management 197 4.2. Role and responsibilities of the Executive Management 198 4.3. The Leadership Team 199 5. Procedures for preventing conflicts of interest 201 5.1. Principles 201 5.2. Mandatory disclosures pursuant to article 7:96 BCAC: Conflicts of interest involving directors 201 5.3. Mandatory disclosures pursuant to article 7:97 BCAC: Conflicts of interest involving transactions with affiliates 202 5.4. Policy concerning transactions with directors or Leadership Team members not covered by article 7:96 BCAC 202 6. Compliance: Internal governance rules 203 6.1. Dealing Code: Rules to prevent market abuse 203 6.2. Code of Conduct & Whistleblowing policy: Ethics 203 7. Remuneration report 204 7.1. Statement on the remuneration policy for directors and members of the Leadership Team with respect to AY 22/23 204 7.2. Remuneration of the non-executive directors 205 7.2.1. Introduction 205 7.2.2. Remuneration in AY 22/23 205 7.3. Remuneration of the members of the Leadership Team 206 7.3.1. Introduction 206 7.3.2. Annual short-term incentive components and targets for AY 22/23 207 7.3.3. Remuneration of the co-CEOs in AY 22/23 208 7.3.4. Remuneration of the other members of the Leadership Team in AY 22/23 209
Contents Financial report
/ 165 7.4. Evolution of the remuneration and pay-gap information 210 7.5. Severance pay for members of the Leadership Team 212 7.6. Claw-back 212 7.7. Information on shareholder vote 212 7.8. Deviations from the Remuneration Policy 212 8. Additional information 213 9. Internal control and risk management 216 9.1. Risk management 216 9.1.1. Risk Identification 216 9.1.2. Risk appetite 216 9.1.3. Risk assurance 216 9.2. Control environment 216 9.2.1. General 216 9.2.2. Audit Committee 216 9.2.3. Internal audit 216 9.3. Risk management systems and internal control 217 9.4. Financial reporting and communication 217 9.5. Oversight and monitoring 217 10. Sustainability and Research & Development 217 Information for shareholders 218 1. Shares 218 2. Share trading evolution 218 3. Capital structure 219 4. Shareholder structure 220 5. Major changes in shareholder structure 220 6. Contacts 220 7. Financial calendar 221 Consolidated financial statements 223 Consolidated income statement 224 Consolidated statement of comprehensive income 225 Consolidated statement of financial position 226 Consolidated statement of changes in equity 227 Consolidated statement of cash flows 228 Notes to the consolidated financial statements 231 1. General information 232 2. Significant accounting policies 232 2.1. Basis of preparation 232 2.2. Changes in accounting policies and disclosures 232 2.3. Basis of consolidation 233 2.4. Summary of significant accounting policies 235 3. Critical accounting judgements and key sources of estimation uncertainty 243 3.1. Critical judgments in applying the entity’s accounting policies 243 3.2. Key sources of estimation uncertainty 243
CONTENTS | CONTENTS FINANCIAL REPORT 166 / 4. Segment information 244 4.1. Information about major customers 245 4.2. Geographical information 245 5. Notes to the consolidated income statement 246 5.1. Sales 246 5.2. Operating expenses 247 5.3. Personnel expenses 248 5.4. Other operating income/expense 248 5.5. Net finance income/cost 249 5.6. Income tax expense/income 250 5.7. Earnings per share 251 6. Notes to the consolidated statement of financial position 252 6.1. Property, plant & equipment 252 6.2. Goodwill 254 6.3. Other intangible assets 255 6.4. Leases 256 6.5. Investments accounted for using equity method 257 6.6. Other financial assets and liabilities 258 6.7. Deferred tax assets and liabilities 258 6.8. Inventories 260 6.9. Trade and other receivables 260 6.10. Cash & cash equivalents and bank overdrafts 262 6.11. Financial instruments by category 262 6.12. Issued capital, share premium and other capital instruments 263 6.13. Share based compensation 263 6.14. Pension and other employee benefit liabilities 265 6.15. Provisions 268 6.16. Interest-bearing loans 269 6.17. Trade and other payables 272 6.18. Risk management policy 272 6.18.1. Market risk 272 6.18.2. Credit risk 276 6.18.3. Liquidity risk 277 6.18.4. Transfers of financial assets 278 6.18.5. Financial assets and liabilities – fair value 278 6.18.6. Capital structure 279 6.18.7. Fair value hierarchy included in the statement of financial position 279 7. Other elements 280 7.1. Subsidiaries, associates, joint ventures and investments recorded at cost 280 7.2. Main disputes 282 7.3. Off-balance sheet commitments 283 7.3.1. Commitments concerning purchases of property, plant and equipment and fresh vegetables 283 7.3.2. Factoring 283 7.3.3. Bank and bond covenants and undertakings 283 7.3.4. Securities 284 7.3.5. Bank and corporate guarantees 284 7.3.6. Contingent liabilities 284 7.4. Related parties 284 7.5. Events after balance sheet date 285 7.6. Fees group auditor 285 Statement of responsible persons 287 Statutory auditor’s report on the consolidated financial statements 291 Condensed statutory accounts of the parent company greenyard nv, according to belgian accounting standards 299 Financial definitions 307
/ 167

168 / UNLEASHING THE PURE POWER OF PLANTS
Key financial information
/ 169 GREENYARD ANNUAL REPORT 2022/2023
Sales
Greenyard sales increased with 7,9% or € 340,5m on a like-for-like basis, from € 4 297,5m to € 4 638,0m. The growth is driven by price increases (+8,5%) to cover inflated input costs comprising FX tailwinds of 0,5%, partially offset by a limited volume decrease of (-0,8%) and ‘other’ impacts (+0,2%). Long Fresh benefited from volume growth thanks to food service picking up post-COVID and a trend of down trading from branded to private label and from Fresh to Long Fresh. Moreover, despite volume pressure in the fresh F&V retail, we managed to keep the decline of volumes very limited thanks to our integrated customers relations.
Adjusted EBITDA
The Adjusted EBITDA increased with € 0,8m from € 166,5m to € 167,3m which represents a growth of 0,5% in an inflationary economic context. The Adjusted EBITDA margin dropped slightly by 20 bps from 3,8% to the level of AY 20/21 being 3,6%. AY 22/23 was an extremely difficult year due to the unforeseen economic headwinds following the conflict in Ukraine, the impact of drought and scarce labor on production efficiencies and high inflation rates. The latter impacted consumer spending and put pressure on margins. Nevertheless, Greenyard was able to stabilize its operational profitability in absolute terms thanks to a frequent review of sales prices, tight cost control and a strong co-operation with the integrated customer relationships.
Net result
Greenyard reports a net result from continuing operations of € 9,3m compared to € 16,9m for the same period last year. Although the Adjusted EBITDA is slightly above last year, the net result ended just below € 10m due to higher reorganization costs and increased interest rates. The reorganization costs, which are non-recurring in nature, are linked to the fact that the group continued to take organisational measures to adjust to the new market situation, and at the same time strengthen the organisation to fully take advantage of its improved competitive position. Furthermore, the interest rates on the Group’s indebtedness which are EURIBOR-linked, have risen. The impact for Greenyard has however been mitigated by the interest hedging applied by the Group before summer 2022.
Leverage
Excluding lease accounting cfr. bank covenant definitions, net financial debt (NFD) was significantly reduced by € 26,3m compared to March 2022, to € 277,3m on 31 March 2023. This translates into a leverage of 2,2x, down from 2,4x in March 2022. This result was achieved thanks to the successful management of the cash conversion cycle with increased factoring efficiency and whereby inflation increased the accounts payable position despite price inflated values of stock.
CONTENTS | CONTENTS FINANCIAL REPORT 170 / Key financials (in €'000 000) AY 22/23 AY 21/22 Difference Sales (reported) 4 690,1 4 400,5 6,6% Sales (like-for-like) 4 638,0 4 297,5 7,9% Adjusted EBITDA 167,3 166,5 0,5% Adjusted EBITDA-margin % 3,6% 3,8% Net result continuing operations 9,3 16,9 EPS continuing operations (in €) 0,16 0,32 Net financial debt (excl. lease accounting) 277,3 303,6 -8,7% Leverage 2,2 2,4
EBIT from continuing operations amounted to € 48,7m compared to € 58,3m last year. In AY 22/23 adjustments were higher than last year, and depreciation and amortization costs increased slightly consequent to gradually stepping up the overall investment level, as foreseen in the company’s long-range plans.
As to adjustments, these increased from € -6,4m last year to € -7,7m this year, with main impacts this year being provisions related to finalizing an important claim and reorganization costs e.g. redundancy and contract termination expenses in Fresh UK (see below). The adjustments this year also benefited from a positive impact on the result on sale of unutilized land in Long Fresh.
The adjustment for current year’s EBITDA of divestitures includes Greenyard Fresh UK of which the operational wind down is nearly completed. Furthermore, in March 2023 the decision has been taken to strengthen the Fresh business model by winding down the local operations of Fresh France and include the current year’s results to the adjustments. Greenyard will continue serving the French market but based on an asset-light strategy in which the operations and supply will be taken care of by the Greenyard organizations of the neighboring countries.
Last year, divestitures still benefited from a positive impact on the result on sale of Bardsley Fruit Enterprises and Greenyard Prepared Netherlands.
/ 171 EBIT - Adjusted EBITDA AY 22/23 AY 21/22 Fresh Long Fresh Unallocated TOTAL Fresh Long Fresh Unallocated TOTAL €'000 €'000 €'000 €'000 €'000 €'000 €'000 €'000 EBIT 11 609 38 914 -1 815 48 709 28 560 32 425 -2 701 58 283 Depreciation and amortisation 67 077 33 239 1 041 101 358 64 883 33 818 1 128 99 828 Impairment other - - - - 430 - - 430 EBITDA 78 686 72 154 -773 150 067 93 872 66 243 -1 573 158 542 Reorganisation costs and reversal of provision for reorganisation costs (-) 4 693 44 319 5 056 2 171 368 324 2 862 Corporate finance related project costs 1 - 362 363 111 20 66 197 Costs related to legal claims 1 412 1 023 25 2 460 3 540 -769 36 2 807 Income related to legal claims -640 - - -640 - - -Result on sale of assets - -977 - -977 - - -Other 1 424 13 28 1 465 491 37 32 559 Adjustments 6 890 102 735 7 727 6 312 -344 458 6 426 Result on sale of divestitures - - - - -2 961 307 - -2 653 Current year EBITDA of divestitures 9 505 - - 9 505 4 670 -447 - 4 223 Divestitures (not in IFRS 5 scope) 9 505 - - 9 505 1 709 -140 - 1 570 Adjusted EBITDA 95 081 72 256 -39 167 298 101 894 65 759 -1 116 166 537
CONTENTS | CONTENTS FINANCIAL REPORT 172 / Leverage reconciliation 31 March 2023 31 March 2022 €'000 €'000 Adjusted EBITDA 167 298 166 537 Lease accounting (IFRS 16) -40 654 -40 729 Adjusted EBITDA (for leverage) 126 644 125 809 NFD 499 910 531 389 Lease accounting (IFRS 16) -222 626 -227 769 NFD (for leverage) 277 285 303 620 Leverage 2,2 2,4 Reconciliation net financial debt 31 March 2023 31 March 2022 €'000 €'000 Cash and cash equivalents -119 357 -98 504 Interest-bearing bank debt (non-current/current) 292 409 395 238 Interest-bearing lease & lease back debt (non-current/current) 89 047Lease liabilities (non-current/current) 231 254 231 998 As reported 493 353 528 732 Net capitalised transaction costs related to the refinancing 6 557 2 657 Net financial debt 499 910 531 389 Lease accounting (IFRS 16) -222 626 -227 769 Net financial debt (excl. lease accounting) 277 285 303 620
Sales and Adjusted EBITDA per operating segment
Like-for-like (LfL) Fresh sales increased by +6,2% YoY or € 220,4m, to € 3 762,4m. Sales within the integrated customer relationships thereby continues to represent three quarters of the Fresh segment sales which provides a stable financial basis in these volatile economic times. The sales growth is explained by price increases amounting to 7,8% including +0,8% FX tailwinds, partially offset by a limited negative volume effect of -1,9% related to the re-balancing of out-of-home consumption post-COVID, and consumers hesitating to consume fresh fruit and vegetables due to loss of purchase power. Please note that price dynamics in Fresh are not only driven by input cost inflation but also by supply-demand volatility in the different F&V categories caused by elements like weather, geopolitical changes, etc.
The Adjusted EBITDA of the Fresh segment is -€ 6,8m lower than in AY 21/22 due to margin and volume pressure. Not all inflation could be passed on as not all retailers fully adapted their prices to protect their market share. In some countries Greenyard took additional reorganization measures to strengthen the organization and focus on key activities. Greenyard’s long-term oriented customer relationships were very resilient in the current volatile economic environment and generated volumes and margins that proved to be more robust than the overall market. These ICR relations are at the heart of Greenyard’s strategy, and Greenyard is fully committed to its long-term strategy to further expand this collaborative way of working, with existing and future customers.
Key segment figures - LONG FRESH
LfL Long Fresh sales increased by +15,9% YoY to € 875,6m, up € 120,0m from € 755,6m. This double-digit sales growth is driven by 4,5% volume growth in retail and food service both exceeding pre-COVID levels. Moreover, we noticed a positive shift from branded to private label products, benefiting Greenyard. Down trading also took place from Fresh to Long Fresh as latter products are relatively less expensive. This makes Greenyard more resilient in uncertain and/or inflationary times being present in both segments. 12,0% of the sales growth is explained by sales price increases to cover inflation and comprises -0,8% FX headwinds. Furthermore, sales related to transport activities decreased with -0,6%.
In absolute terms, the Adjusted EBITDA rises with € 6,5m thanks to the volume increases and a one-off recovery of previous years’ contributions related to water management. The margin remains stable at 8,3% as Greenyard was able to manage production inefficiencies caused by lower crop yields due to drought and scarcity in labour, and high-cost inflation by several waves of sales price increases (albeit slightly delayed).
/ 173
Key segment figures - FRESH in €'000 000 AY 22/23 AY 21/22 Difference Sales (reported) 3 814,5 3 607,4 5,7% Sales (like-for-like) 3 762,4 3 542,0 6,2% Adjusted EBITDA 95,1 101,9 -6,7% Adjusted EBITDA-margin % 2,5% 2,8%
in €'000 000 AY 22/23 AY 21/22 Difference Sales (reported) 875,6 793,1 10,4% Sales (like-for-like) 875,6 755,6 15,9% Adjusted EBITDA 72,3 65,8 9,9% Adjusted EBITDA-margin % 8,3% 8,3%

174 / UNLEASHING THE PURE POWER OF PLANTS
Report of the board of directors

/ 175 GREENYARD ANNUAL REPORT 2022/2023
Comments on the consolidated financial statements
These comments relate to the consolidated financial statements of Greenyard NV (‘the Company’) and its subsidiaries (together, ‘the Group’) for the year ended on 31 March 2023.
1. Consolidated income statement
Sales
Greenyard sales increased with 7,9% or € 340,5m on a like-for-like basis, from € 4 297,5m to € 4 638,0m. The growth is driven by price increases (+8,5%) to cover inflated input costs comprising FX tailwinds of 0,5%, partially offset by a limited volume decrease of (-0,8%) and ‘other’ impacts (+0,2%). Long Fresh benefited from volume growth thanks to food service picking up post COVID and a trend of down trading to private label. Moreover, despite volume pressure in the fresh F&V retail, we managed to keep volumes rather stable thanks to our integrated customers relations.
Gross profit
Greenyard’s gross profit remained stable in AY 22/23 ad € 294,7m (€ 294,8m in AY 21/22) while the gross margin dropped with 42bp from 6,7% to 6,3% in an unprecedented inflationary and difficult economic context. Nevertheless, Greenyard was able to stabilize its operational profitability in absolute terms thanks to a frequent review of sales prices, tight cost control and a strong co-operation with the integrated customer relationships.
Looking at gross profit by segment (on a like-for-like basis), in Fresh, gross profit and gross margin declined which is mainly a consequence of the extremely difficult year due to the exceptional economic headwinds following the conflict in Ukraine, high inflation rates and demand/supply imbalances. Consumers hesitated on spending and retailers were only slowly adapting prices, which put pressure on the gross margin. In Long Fresh, gross profit increased while the gross margin also decreased as prices were recharged in ‘absolute’ terms (and with a slight delay) to customers which led to margin erosion.
Earnings before interest and tax (EBIT)
The stable gross profit translated in a slight increase in Adj. EBITDA with € 0,8m from € 166,5m to € 167,3m. To compensate for inflation, we kept strict control on SG&A expenses, and benefited from additional other operational income. However, EBIT decreased by € -9,6m from € 58,3m to € 48,7m.
The EBIT decrease was caused on one hand by a slight increase in depreciation and higher reorganization costs in order to improve the competitive position of segment Fresh. On the other hand, the adjustment for divestitures increased and relates to Fresh France (winding down of local operations, French market supply foreseen by neighboring countries) and Fresh UK (operational wind down almost completed). Furthermore, last year benefited from a gain on the sale of Bardsley Fruit Enterprises and Greenyard Prepared Netherlands.
Net finance income / cost
Net finance cost remained stable YoY at € 34,4m but with an important shift between interest expense and other finance result. After repayment of the convertible bond loan at maturity in December 2021, the conclusion of the lease and lease back transaction in June 2022 and the signing of a new Facility Agreement in September 2022, there was a shift in interest expenses from interests on the convertible bond loan to interest expenses on bank borrowings, the lease and lease back and factoring in AY 22/23. Interest expenses were also impacted by the increased working capital needs in the current inflationary environment and rising interest rates and amount to € 43,2m in AY 22/23 (€ 30,7m in AY 21/22).
Foreign exchange losses in AY 22/23 were fairly limited. Furthermore, a fair value gain has been incurred in AY 22/23 originating from the change in fair market value of an interest rate swap contract to fix the interest on a large part of the factoring. This IRS is not designated as a hedging instrument.
CONTENTS | CONTENTS FINANCIAL REPORT 176 /
Income tax expense / income
Income tax for AY 22/23 amounts to € 5,0m (AY 21/22 €7,0m). This implies a consolidated effective tax rate of 34,99% (AY 21/22 29,27%). The tax accruals for the current year result from the improved/increased profit before tax positions of several tax-paying entities within the Group. On the other hand, tax loss consolidation has been utilized in some jurisdictions and deferred tax assets have been created on losses in other jurisdictions based on the ability to offset them against taxable profits in the foreseeable future.
2. Consolidated statement of financial position
Non-current assets
Non-current assets increased by € 21,2m to € 1 239,0m, which is the combination of (i) increase in other financial assets for € 16,9m as a result of the interest rate swaps hedging the primary indebtedness and factoring exposure, (ii) an increase in deferred tax assets by € 10,4m and (iii) a decrease of € -7,0m and € -7,2m respectively in other intangible assets and right-of-use assets together with an increase of € 7,6m in Property, Plant & Equipment.
The decrease in other intangible assets is mainly driven by further amortization of the customer relationships for € 13,3m partially offset with additions related to the roll-out of the new ERP system in the Fresh segment. The right-of-use assets declined by € -7,2m as we did not expand the Fresh distribution footprint in AY 22/23. However, we continued investing in the production and logistic equipment and Long Fresh factories in AY 22/23 which led to the increase of € 7,6m in Property, Plant & Equipment. Main additions relate to the citrus packaging line in the Fresh segment, and a new sauce unit as well as replacement/improvement capital expenditures in the production facilities of the Long Fresh segment.
Current assets
Current assets increased by € 54,5m to € 734,2m. The increase mainly consists of the increase in inventory for € 34,2m, almost fully in Long Fresh mainly due to inflation of input costs. Trade and other receivables remained stable at around € 239m. Lastly, cash and cash equivalents rose by € 20,9m.
Equity
Total equity amounts to € 486,0m and represents 24,6% of total equity and liabilities at 31 March 2023 versus 24,7% last year. The increase by € 16,7m compared with 31 March 2022 mainly results from the net result of the year attributable to the shareholders of the group for € 7,8m, the equity impact of the fair value of the interest rate swap hedging on the primary indebtedness for € 6,0m and the remeasurement on post employee benefit obligations ad € 1,8m.
Non-current liabilities
Non-current liabilities increased slightly by € 0,9m to € 615,8m, which is mainly due to a decrease in employee benefit liabilities and lower lease liabilities, which is partially offset by increased deferred tax liabilities mainly related to the lease and lease back accounting treatment.
Current liabilities
Current liabilities amount to € 871,3m, representing a € 58,0m increase compared 31 March 2022. This increase is driven by increased trade and other payables (€ 72,1m) as a result of price inflation on purchases and high business activity in the last weeks of the year which is offset by a decrease in short term loans for € 14,7m.
There are no changes in valuation rules with a significant impact on the Group’s reported results or financial position, apart from those included in note 2.3. Basis of consolidation.
/ 177
3. Consolidated statement of cash flows
The net increase in cash and cash equivalents for AY 22/23 amounted to € 21,7m. Operating and investing activities contributed € 109,7m as compared to € 104,3m last year.
Cash flow from operating activities
The cash inflow from operating activities amounted to € 163,9m in AY 22/23, compared to a cash inflow from operating activities of € 132,2m in AY 21/22, or an increase of € 31,7m.
This increase is mainly the result of a decrease in working capital which improved by € 33,8m in AY 22/23 as compared to a deterioration of € -12,4m the year before, or a net impact of € 46,2m. This is partially offset by a lower EBIT corrected for mainly non-cash EBIT adjustments i.e. € 143,7m in AY 22/23 from € 161,0m in AY 21/22 or a net impact of € -17,3m.
Although the inventories increased significantly in AY 22/23 due to inflation of input costs, or € -37,3m, the Group managed to further improve its working capital thanks to the successful management of the cash conversion cycle. As a result, the receivable and payable improvement amounted to € 71,1m.
Cash flow from investing activities
The cash outflow from investing activities amounted to € -54,2m, which is € -26,3m higher compared to AY 21/22.
The main explanation is the difference in disposal proceeds being € 2,5m in AY 22/23 as compared to € 20,5m in AY 21/22. Last year’s proceeds were higher due to the sale of Bardsley Fruit Enterprises Ltd and Greenyard Prepared Netherlands.
Acquisitions of intangible assets and property, plant and equipment increased with € -8,2m to € -56,7m in AY 22/23 compared to the previous year, consequent to gradually stepping up to a higher overall investment level, as foreseen in the company’s long-range plans. The additions in AY 22/23 in Fresh mainly relate to the further roll-out of the new ERP, new trailers/trucks as well as new banana ripening cells and further investments in the citrus packaging line. In Long Fresh, the investments mainly concern a new sauce unit as well as replacement/improvement capex in the production facilities.
Cash flow from financing activities
The cash outflow from financing activities has slightly increased by € -1,3m to € -88,1m in AY 22/23 as compared to the previous year and consists out of several larger transactions.
During AY 22/23, Greenyard completed a lease and lease back transaction regarding a long lease right on the food processing and warehouse facility of its Prepared division in Bree which generated € 89,9m proceeds. Moreover, a new Facility Agreement was signed with a pool of banks of which € 389,2m was drawn in AY 22/23. On the other hand, € 485,8m was repaid in relation to the amended and restated Facilities Agreement signed on 29 March 2021 including the first instalment of € 12,5m on the new Facility Agreement. On top, transaction costs on the new Facility Agreement and the lease and lease back amounted to € 6,8m and repayments on the lease and lease back to € 3,0m.
In AY 22/23, net interests have increased by € -8,9m from € -29,5m in AY 21/22 to € -38,4m in AY 22/23 mainly due to increasing interest rates for the non-hedged portion of the financial indebtedness. Lastly, in AY 21/22, Greenyard purchased 600 000 treasury shares for an amount of € 5,5m for its management option incentive scheme.
Dividends
The Board of Directors is proposing to the general meeting of shareholders on 15 September 2023 to approve a dividend payment of € 0,10 per share for the current closed accounting year AY 22/23.
CONTENTS | CONTENTS FINANCIAL REPORT 178 /
Position of the company: risks and uncertainties
The Group is required to disclose the key risks and uncertainties which have affected or may impact its financial position and results. Together with their associated mitigating actions, these risks are described below. The list does not, however, rank the risks by priority; nor is it an exhaustive description of all risks currently faced.
Availability and prices produce and consumables
The results of the Group may be adversely affected by shortages in produce and consumables.
Fresh obtains most of its supply directly from a solid and extensive network of third-party growers. For all its business models, sourcing is done at market prices or price ranges negotiated in advance. In general, growers are compensated based on the prices obtained from the customers with a fixed % margin for Greenyard, occasionally with a minimum guaranteed price or based on a fixed price or agreed price ranges.
With regard to the production of frozen fruit and vegetables, Long Fresh obtains fresh supplies from 800 farmers in Belgium, France and Poland. The UK supplies are secured by agricultural cooperatives and various dealers. For canned fruit and vegetable production, on the other hand, the supply of fresh produce is sourced from approximately 4,500 ha of agricultural land within a radius of 100 km of the main processing sites in Belgium and the Netherlands. Long Fresh sources with pre-season fixed-price annual contracts. Possible shortfalls can be compensated for by purchasing raw materials on the spot market. Depending on the type of fresh produce, the number of hectares and the expected yield (tons per hectare) are set.
Despite the attention and efforts dedicated to these aspects and active supplier relationship management, the Group is however greatly exposed to temporary weather phenomena, while climate and soil conditions can also influence supplies and raw materials prices (see separate item).
Energy prices
Due to the high energy intensity of the production, cooling, ripening and storage processes, the Group is affected by trends in energy prices (mainly gas, electricity and oil prices). The Group is typically fixing the forward prices of gas and electricity to secure prices for the coming three years. Due to the steep increase of energy prices over the last year and low visibility on future evolutions, temporarily the hedging time horizon has been shortened, taking into consideration sales price dynamics. However, it is the intention to reconnect with the original hedging strategy once the energy prices stabilize.
Customer dependence
The Group faces some customer concentration, i.e. its top three customers, primarily retailers, represent approximately 60% of its total sales (top 10 represent 76%). The Group believes its customers make purchase decisions based on, among other things, price, product quality, consumer demand, added value services, supply certainty, innovation, sustainability of our operations and desired inventory levels.
Although the Group uses advanced planning with continuous revision loops, to match purchases with expected sales, sudden changes in customer strategies or purchasing patterns may adversely affect the operating profit by supply and demand mismatches resulting in waste or a lower valuation of surplus volumes.
Customers may also reduce their purchases, diversify their purchase strategy by involving other market players or purchase directly from growers or through own purchase organisations. However, we underline that Greenyard is already doing business with the top ten customers for many years and cooperation is renewed constantly with new programs.
The Group believes that its customer intimacy strategy, embedded in the Integrated Customer Relation model (ICR), is key to its pursuit of margin and volume stability. Based on multi-year ICR contracts, Greenyard and its partner retailer can fully streamline the value chain, and better align supply and demand. This leads to plenty of benefits like efficiencies, dedicated investments, better quality, fair pricing, less waste and more sustainability. As this is a tailored approach for each customer, and both parties commit to integration, these relations are typically for the long run.
/ 179
Integrated customer relationship model
The Group’s strategy of establishing integrated partnerships with major retailers and vertically integrating with them has been further developed successfully over the last years. Currently the Group has several multi-year contracts with retailers where it provides an assortment of products and customised services. By closely co-operating as partners and investing in a joint strategy to grow the fruit and vegetable category, a constructive interdependence exists between both parties. This makes it worthwhile to continually build on this instead of switching to alternatives.
However, pursuing a transition from a trading model to long-term, integrated customer relationships might not succeed with all customers. For instance, it implies Greenyard and the retailer to work together in a culture of trust and transparency. Moreover, the retailer has to be willing to change from transaction-based purchasing to category management. Transition to the new model is a complex process as it implies a far-reaching alignment between both partners which typically takes time and effort. The benefits of an integrated customer relationship model increase step-by-step over time (typically years) when both partners are more and more integrating activities and intensifying co-operation.
Climate conditions
From time to time, the growers supplying Greenyard experience crop disease, insect infestation, severe weather conditions (such as floods, droughts, windstorms, and hurricanes), natural disasters (such as earthquakes) and other adverse environmental conditions. Severe weather conditions can be further exacerbated due to the impacts of climate change. These adverse environmental conditions, and more specifically unpredictable weather patterns, can result in production and price volatility. As far as possible, the Group mitigates this risk by the geographical spread of its sourcing through an extensive and global network of growers.
Concerning produce from growers, the Fresh segment often works on a free consignment basis and shares the risk of adverse environmental conditions given its long-term relationship with growers. In addition, the Fresh segment may occasionally finance crop production of some growers and suppliers and can be adversely affected if it is not repaid or repayment is postponed due to detrimental environmental conditions affecting those growers and suppliers.
Where the Long Fresh segment is concerned, the Group actively works together with its growers to minimize the climate impact for instance by stimulating irrigation, adapting sowing plans, etc. In addition, a lot of flexibility has been secured against shortages by building sufficient inventories and managing a broad mix of products making alternatives available. Moreover, being present with factories in different countries, that closely co-operate, mitigates the climate risk. Worst case, the Group will have to buy additional volumes at higher prices on the spot market.
Along with other elements, such as soil fatigue in fields for specific crops, weather conditions can be a compelling reason for the Group to reduce its dependence on the harvest in a specific region as much as possible. This risk is mitigated by the geographical spread of the activities and by long-term relations with the growers.
Seasonality and working capital
Seasonality is a material risk element for the Group. Opposing underlying trends exist across the operating segments. Long Fresh has a production peak in the period from July to November with a corresponding inventory build-up, whereas demand is relatively stable throughout the year. This gives rise to large swings in working capital in the last two quarters of the calendar year. On the other hand, Fresh achieves a greater portion of its sales during the first two quarters of the calendar year, whereas the third and fourth calendar quarters typically have slightly lower sales and less homogenous sales patterns than the first half of the calendar year. As Fresh reports a negative working capital figure, the positive working capital of Long Fresh is partly offset at Group level.
Due to high seasonality, production volumes can greatly influence the Group’s results during high season and lead to large inventories that have to be held and financed. The Group actively manages and closely monitors working capital and liquidity to cope with large swings in working capital and continuously secures its funds and resources accordingly.
Geopolitical changes
We come out of a long period of quantitative easing and creating ‘cheap money’ to stimulate economic growth and finance crises like the Covid pandemic. Half a year ago, triggered by the Western world exiting a strategy of lock-downs post-Covid, high inflation popped up (see separate item). Currently the economic uncertainty is high, also due to the Ukraine-Russian war (see further), and there is no visibility on when the tide will turn. Important governmental measures are initiated and can be further expected like increasing interest rates to temper inflation. Some economists are also concerned on the economy slowing down, in combination with inflation, thus stagflation. Although we believe plant-based food will remain key in consumption, this might put pressure on volumes and margins.
CONTENTS | CONTENTS FINANCIAL REPORT 180 /
In the past few years, the US, the EU and the UN have increased their imposition of various sanctions and embargoes on trade with countries such as Iran, Syria, Sudan and others. Similar sanctions were taken by the US and EU against the Russian Federation and subsequently by the Russian Federation against the US and the EU. As the activities and operations of the Group are worldwide, the Group and its competitors, distributors, suppliers and customers may have difficulties complying with or may suffer from such trade sanctions and embargoes.
UK withdrew from the European Union on 31 January 2020. Despite temporary supply chain disruptions in 2021 caused by Brexit in the transition period, Greenyard has experienced limited impact. Reason is that most of its sales to the UK market are from its UK subsidiaries. Moreover, these subsidiaries have good relations with local UK growers.
In February 2022 unexpectedly the Ukraine-Russian war started. Historically far-reaching trade sanctions have been installed. Furthermore, high concern on EU dependency on Russian gas is raised. Greenyard does not suffer any direct impact not having operations in these countries, and hardly dealing with any customers or growers in these regions. However, there is of course an important indirect impact due to inflation and availability of input (see separate items).
The Group’s management monitors global geopolitical trends and promptly takes the appropriate measures, where required. The geographical spread of operations and sourcing channels also partly mitigates the geopolitical risks.
Product liability
In the execution of its activities, the Group may be subject to inadvertent events that may potentially or effectively affect the quality or food safety of its products and give rise to corrective actions that may impact the results of its operations.
The Group may be exposed to product recalls, including voluntary recalls or withdrawals, and adverse public relations if its products are alleged to cause injury or illness, or if the Group is alleged to have mislabelled or misbranded its products or otherwise violated regulations. The Group may also voluntarily recall or withdraw products that it considers below its quality standards in order to protect its (brand) reputation. Consumer or customer concerns (whether justified or not) regarding the safety of the Group’s products can adversely affect its business. A product recall or withdrawal can result in substantial and unexpected expenditure, the destruction of product inventory and lost sales due to the unavailability of the product for a period of time. As a consequence, the Group may also experience adverse public exposure and product liability claims.
The Group applies recognized food safety standards and its activities are GFSI certified (Global Food Safety Initiative). Group, division and local management actively monitor quality and compliance with these standards. Long-standing relationships have been developed with key growers and suppliers who offer the required commitment and compliance with the Group’s quality standards and requirements.
Changes in legislation and regulations
The Group’s activities are subject to extensive regulation in the countries in which it operates, including corporate governance, labour, tax, competition, environmental and health and safety legislation. Failure to comply with existing laws and regulations could result in damages, fines and criminal sanctions being levied on the Group or the loss of its operating licenses and could adversely affect its reputation. Compliance with future material changes in food safety or health- related regulations and increased governmental regulation of the food industry (such as proposed requirements designed to enhance food safety, impose health-protection requirements or to regulate imported ingredients) could result in material increases in operating costs and could require interruptions in the Group’s operations to implement such regulatory changes, thereby affecting its profitability.
There has been a broad range of regulations aimed at reducing the effects of climate change which have been proposed and adopted at national and international level. Such regulations apply or could apply in countries where the Group has or could have interests in the future. The Group reviews the impact of any changes on a regular basis, and seeks to ensure it budgets appropriately for future capital and operating expenditures to maintain compliance with environmental and health and safety regulations.
Talent attraction and retention
The Group’s future success depends on its ability to attract, retain and motivate qualified and talented employees. Being unable to do so would compromise its ability to fulfil its strategic ambitions. To enhance its recruitment pool, it has initiated a global employer brand, supporting its recruitment activities and communication with potential candidates. Furthermore, a people-focussed culture, attractive development and training programmes, adequate remuneration and incentive schemes and a safe and healthy work environment, also mitigate this risk.
/ 181
Human rights and anti-corruption
Risks from the improper behaviour of employees and business partners, breaching fundamental human rights, could adversely affect the Group’s reputation and its business prospects, operating results and financial situation. It could thus be liable under human rights, corruption, environmental, health and safety laws or regulations, or fines, penalties or other sanctions. Therefore, high ethical standards are maintained throughout the entire Group at all levels with zero tolerance for corruption or bribery and any conduct which inappropriately or unreasonably interferes with work performance, diminishes the dignity of any person or creates an intimidating, hostile, exclusionary or otherwise offensive working environment. This includes discrimination, harassment, bullying or exclusion based on race, colour, religion, gender, age, national origin, sexual orientation, marital status or disability.
Exchange rate risk
The Group operates internationally and is exposed to foreign exchange risk in relation to various currencies. The US dollar and the British pound are the most important non-euro currencies. Of lesser importance are the Polish zloty and the Czech koruna. The Group’s management has strict guidelines requiring subsidiaries to manage their foreign exchange risk against their functional currency. These guidelines require subsidiaries to hedge their entire foreign exchange risk exposure with Corporate Treasury. To manage its foreign exchange risk arising from future commercial transactions, the Group uses foreign exchange forward contracts. Although the Group engages in natural and transactional hedging, there can be no assurance that the Group will be able to successfully mitigate foreign exchange exposure, particularly over the long term. Further reference is made in note 6.18. Risk management policy
Interest rate risk
The Group’s financing positions are almost fully exposed to floating interest rates after repayment of the convertible bond in December 2021, which was at fixed rate. The Group is exposed to floating interest rates through a revolving credit facility, factoring programs and term loans. Due to the long period of ‘below zero’ Euribor interest rates, the Group did not engage over the last years in hedges fixing its interest rate exposure through interest rate swaps.
However, due to the changed economic environment with rising interest rates, the Group concluded in the beginning of last accounting year interest-rate swaps for an important share of its floating rate commitments. Moreover, it repaid part of its syndicated loan commitments by lease and leaseback financing at a fixed rate. Reference is made to this in note 6.16 Interest-bearing loans and 6.18. Risk management policy
Credit risk
The Group is exposed to the risks associated with their counterparties being unable to perform their contractual obligations. The credit risk comes from its operating activities (primarily trade receivables) and from its financing activities, including deposits with banks and financial institutions, foreign exchange transactions and other financial instruments.
The Group’s customers have varying degrees of creditworthiness, exposing it to the risk of non-payment or other forms of default of its contracts and other arrangements with them. To protect itself against customer defaults and bankruptcies, the Group uses the services of international credit insurers and also applies internal customer credit limits. Credit insurance is mandatory for all trade receivables sold to the factor company. For entities excluded from the factoring program, the receivables are included in the credit insurance. If credit limits are not sufficient, internal limits could be allocated.
The Group also makes advances to key suppliers, generally to secure overseas produce in key categories, based on a diligent analysis. Advances made are generally interest-bearing and recovered by deductions from the payments made in respect of the produce delivered by the counterparty. Further reference is made to this in note 6.18. Risk management policy
Financing, liquidity risk and covenant compliance
The Group is financed by syndicated term and revolving credit facilities which are in place until September 2027. Moreover, a lease and leaseback loan is in place with a lease term of 20 years. Consequently, Greenyard secured sufficient financial means to a) finance the working capital and investment needs of the business, and b) settle annual term loan repayments in March of each year. The size of the credit facilities has been aligned based on the Group’s business plan and liquidity forecasts taking into account sufficient headroom. Moreover, financial covenants i.e. leverage ratio and interest cover, have been aligned to this.
A continuous increase in cash generation and liquidity has been foreseen based on further sales growth and improvement of profitability margins, which has been underpinned by a 3-year business plan up to AY 25/26. Significant investments have been included in the plan to support this growth and further strengthen the position of the Group. Furthermore, liquidity is also dependent on the working capital conditions with suppliers and customers. At customer side the Group relies on factoring of outgoing invoices and partially on reversed factoring. At supplier side credit limits granted by credit insurers are important. Management expects working capital, factoring and credit limits to grow normally in line with the business.
CONTENTS | CONTENTS FINANCIAL REPORT 182 /
ICT systems and cyber security
In our business it is of utmost importance to meet very high service levels in order to secure a constant high quality and availability of our products to our customers. To execute and follow up seamlessly large numbers of different transactions, we rely on information systems and technology both on premise and in the cloud. Availability of these systems is key to run the day-to-day operations. Greenyard therefore constantly strives to comply with high standards and adapt to new evolutions in relation to applications, hardware platforms and cyber security. As the applications, we are currently upgrading our ERP systems in different entities in order to improve efficiency, simplify and harmonise. Typically, the go-live of a new application might lead in a transition phase to operational inefficiencies and risk of internal control deficiencies. As to cyber security, this is a major attention area which has been embedded in our management processes and is reviewed, monitored and improved on a permanent basis. As to hardware, we a.o. take care of regular upgrades, replacements, redundancy and back-ups and actively screen our suppliers and systems.
Input cost and sales price inflation
In 2022 the whole economy suffered from significant and accelerating increases in input prices. Fortunately, this trend slowed down in 2023 but has not yet stabilised.
Greenyard is mainly impacted by increases in prices of energy, labour, packaging and transport. Also, though later, prices of produce and food additives have been rising. The Group continues to look for efficiency improvements, but it had no choice than to align the sale prices at the same time to keep the business and the whole food value chain healthy. Moreover, no more fixed sales prices for a full year and/or season are agreed, instead sales prices are continually adapted in line with rising input costs until the cost price evolution fully stabilizes.
As Greenyard mainly works with long-term integrated customer and grower relations, the Group is fortunately more resilient to inflation than other market players that would be more operating based on spot contracts. At the sale side, we benefit for instance from cost-plus or target margin models, at the purchasing side, inflation resilience comes from agreements with fixed margins contrary to fixed prices.
Over AY 22/23 Greenyard could recharge all input cost increases to its customers, however, with a slight delay. It will continue doing so transparently in AY 23/24 with as an extra complexity that also some input price components started to decline. However, the full input price impact is still upward. Moreover, pressure on volumes at the consumer side, and competition among retailers, are slowing down the acceptance on prices increases.
Greenyard expects that customer and consumer prices will further adapt to the input cost prices, and that latter will gradually stabilize. Furthermore, thanks to the integrated customer relations it is well positioned to better anticipate and align on price evolutions and create extra added value together with the retailers to mitigate margin pressure.
Input availability and supply chain disruption
Apart from high inflation, we also noticed in 2021 and 2022 that availability of transport, packaging and labour became more challenging due to worldwide supply and demand imbalances. Fortunately, it looks like gradually a new equilibrium is settling in 2023.
To mitigate this risk, the Group is constantly optimizing its processes and ways of working to become more agile and less vulnerable to this supply disruption. It has also attained that for all resource categories there is access to several alternatives. Over the last years this risk was managed out successfully so that availability of product and services at our customers was secured and Greenyard continues to be acknowledged as a reliable, stable partner.
Please note that the lower availability and higher prices of transport, energy and packaging, also stimulates the Group and its customers to become more efficient and consume less resources. For instance, by better loading trucks, by more energy efficient installations, by less use of packaging. This supports our ambitious sustainability goals.
Important events after balance sheet date
Greenyard has secured an incremental € 45m revolving credit line in order to support its further growth. The syndicated banks have signed a consent letter thereto on 1 June 2023.
There are no other major events subsequent to the balance sheet date which have a major impact on the further evolution of the Group.
/ 183
Corporate governance statement
Governance principles
Greenyard applies the Belgian Code on Corporate Governance which came into force on 1 January 2020 (2020 Code) and uses it as a reference code in accordance with article 3:6 (§2) of the Belgian Companies and Associations Code (BCAC) and the Royal Decree of 12 May 2019 laying down the corporate governance code to be complied with by listed entities. The BCAC fully applies to Greenyard since 17 October 2019, the date on which Greenyard’s articles of association, amended in accordance with the BCAC, were published in the annexes to the Belgian Official State Gazette.
The main aspects relating to Greenyard’s governance policy, including its governance structure and the terms of reference of the Board of Directors, its advisory Committees, the Executive Management, and the Leadership Team are outlined in Greenyard’s Corporate Governance Charter (CG Charter). The CG Charter provides comprehensive information on the governance rules that apply within the Company, encompassing the remuneration policy and the applicable rules relating to the prevention of conflicts of interest, as well as internal policies such as the Dealing Code and the Code of Conduct (see 6., below).
The Board of Directors revises the CG Charter regularly and, where needed, makes modifications. If changes to or reforms in the applicable legislation, the 2020 Code, or Greenyard’s governance structure require an amendment to the CG Charter, the Company Secretary will propose such amendments to the Board of Directors. The Board of Directors will decide on the matter, where appropriate after seeking advice from the relevant advisory Committee of the Board of Directors. The CG Charter, initially adopted on 2 July 2015 and subsequently amended on 26 March 2020 to comply with the 2020 Code, was last updated and modified by the Board of Directors on 16 February 2023. The key changes to the updated and revised CG Charter are explained in the relevant sections of this Corporate Governance Statement.
The most recent version of the CG Charter is available on the Company’s website (www.greenyard.group) as are the internal policies and the remuneration policy referred to above.
Code on Corporate Governance of 2020 (2020 Code)
The Company meets the provisions provided for by the 2020 Code, except as explicitly otherwise stated and justified in this Corporate Governance Statement. The 2020 Code applies the ‘comply or explain’ principle, meaning that any deviations from the recommendations must be justified.
As at the date of this Financial Report, Greenyard fully complies with the provisions of the 2020 Code, except for a limited number of deviations in relation to non-executive and executive remuneration as set out in respectively, provisions 7.6 and 7.9 of the 2020 Code. During AY 22/23 the Company also temporarily deviated from provision 3.11 regarding non-executive directors meeting at least once a year in the absence of executives. The deviations are indicated and explained in the relevant sections of this Statement.
The 2020 Code is available online at www.corporategovernancecommittee.be.
One-tier governance structure
Greenyard has opted for a one-tier governance structure, as referred to in articles 7:85 et seq. BCAC. At least once every five years, the Board of Directors will evaluate whether the chosen governance structure is still appropriate. The option for the current governance structure has recently been reaffirmed by the Board of Directors in the framework of the self-assessment conducted in AY 22/23.
The Board of Directors has as a collegial management body full power to perform all acts that are necessary or useful to accomplish Greenyard’s corporate object, save for those acts reserved, by law or the Company’s articles of association to the Shareholders’ Meeting. The Board of Directors has delegated specific management powers to Greenyard’s co-Chief Executive Officers (co-CEOs). Together with the Chief Financial Officer of the Company (CFO), the co-CEOs constitute the Executive Management.
The Board of Directors has also established two permanent advisory Committees, namely the Audit Committee and the Nomination and Remuneration Committee. Their role is to advise the Board of Directors on decisions to be taken, to ensure that certain matters have been adequately dealt with, and, if necessary, to bring specific matters to the attention of the Board of Directors.
CONTENTS | CONTENTS FINANCIAL REPORT 184 /
1. Board of Directors
1.1. Composition of the Board of Directors Principles
In accordance with the Company’s articles of association, the Board of Directors consists of at least three directors. The CG Charter stipulates that at least half of the directors are non-executive and at least three are independent within the meaning of article 7:87 (§1) BCAC, taking into account the criteria set out in provision 3.5 of the 2020 Code. The Board of Directors ascertains that at least one-third of the directors are of a different gender than the other directors in accordance with article 7:86 BCAC.
The composition of the Board of Directors aims to achieve a proper balance of experience, backgrounds, knowledge, and competencies, along with sufficient expertise in Greenyard’s operations and activities, enabling the Board of Directors to effectively fulfill its role.
Moreover, the following principles must also be applied:
• Conformity with diversity requirements and sufficient expertise in Greenyard’s areas of activity;
• Conformity with specific gender diversity requirements;
• Conformity with specific qualitative requirements for individual members set forth in the CG Charter, including having independent and constructive judgment and adequate academic and/or practical skills in order to take high-standard decisions, being committed to Greenyard’s strategic objectives (including its environmental, social human rights and governance (ESG) objectives), having sufficient strategic insights in financial, social, ecological and economic trends, maintaining high ethics, treating confidential information with discretion and confidentiality, and having an impeccable reputation;
• No more than five board memberships in listed companies.
Procedure for (Re)Appointment of Directors
As part of the revision of the CG Charter, the Board of Directors decided to remove the age limit of seventy years for directors that was included in the initial text. Such an age limit was considered no longer adapted to the current ethical standards Greenyard seeks to apply.
In order to appropriately limit the duration of the directors’ terms of office, an alternative assessment process based on qualitative criteria has been introduced in the CG Charter. Indeed, non-independent directors are not subject to a specific maximum term of office, whereas independent directors are. The independence criteria in provision 3.5 of the 2020 Code stipulate that the term of independent directors should not exceed twelve years. In the revised CG Charter, which took effect as of 16 February 2023, the (re) appointment procedure for (non-independent and independent) directors provides for a separate assessment of directors who are candidates for reappointment. This assessment is carried out by the Nomination and Remuneration Committee based on (at least) a number of qualitative criteria specified in the updated CG Charter. The results of this assessment will have to be taken into account when providing recommendations to the Board of Directors regarding the reappointment of directors.
The Nomination and Remuneration Committee will carry out this assessment based on the following qualitative criteria, amongst others, as listed (in a non-exhaustive manner) in the CG Charter:
• The director’s commitment, dedication and constructive involvement in discussions and decision-making in the Board of Directors;
• The attendance rate of the director concerned at meetings of the Board of Directors and its advisory Committees, as applicable;
• The director’s strategic insight and added value in the achievement of the Company’s strategic policy aimed at long-term sustainable value creation;
• The director’s individual contribution in the skills, knowledge and experience needed on the Board of Directors, taking into account, on the one hand, the areas of activity in which Greenyard operates and its strategic policy and, on the other hand, the current needs of the Company in a broad macro-economic context;
• For mandates as director representing a shareholder of the Company, the relevance of the representation in the Board of Directors of the shareholder(s) concerned taking into account the current shareholder structure;
• In the case of an independent director, whether the director concerned meets or continues to meet the independence requirements set out in provision 3.5 of the 2020 Code for the duration of the new mandate.
/ 185
Membership of the Board of Directors as at 31 March 2023
As at 31 March 2023, the Board of Directors consisted of nine members:
• With the exception of co-CEO Mr. Hein Deprez (permanent representative of Deprez Invest NV), all directors are non-executive directors;
• Four independent directors meeting the independence criteria set out in article 7:87 (§1) BCAC and provision 3.5 of the 2020 Code, which criteria are also fulfilled by their permanent representatives;
• One-third of the directors are of a different gender than the other directors in accordance with article 7:86 BCAC.
Moreover, the Board of Directors meets the diversity requirements in respect of educational background, professional experience, knowledge, and expertise (see below).
Changes in the composition of the Board of Directors with respect to AY 22/23
The mandates of all directors expire at the end of the upcoming Annual Shareholders’ Meeting with respect to AY 22/23, except for the mandates of the following three independent directors:
• Aalt Dijkhuizen B.V. (permanently represented by Mr. Aalt Dijkhuizen) has been reappointed on 18 September 2020 until the end of the Annual Shareholders’ Meeting with respect to AY 23/24;
• Ahok BV (permanently represented by Mr. Koen Hoffman) has been reappointed on 16 September 2022 until the end of the Annual Shareholders’ Meeting with respect to AY 25/26;
• Alro BV (permanently represented by Mr. Gert Bervoets) has been appointed as new independent director on 16 September 2022 until the end of the Annual Shareholders’ Meeting with respect to AY 25/26. He was appointed in succession to Ms. Hilde Laga, who resigned from the Board of Directors with effect as of the same date.
More particularly, the following directors’ mandates expire at the end of the Annual Shareholders’ Meeting scheduled for 15 September 2023:
• Deprez Invest NV (permanently represented by Mr. Hein Deprez), Managing Executive director;
• Alychlo NV (permanently represented by Ms. Els Degroote), non-executive director;
• Bonem Beheer BV (permanently represented by Mr. Marc Ooms), non-executive director;
• Galuciel BV (permanently represented by Ms. Valentine Deprez), non-executive director;
• Gescon BV (permanently represented by Mr. Dirk Van Vlaenderen), independent director;
• Management Deprez BV (permanently represented by Ms. Veerle Deprez), non-executive director.
In view of the expiration of these directors’ mandates, the procedure for the (re)appointment of directors has been initiated. Within this framework, in accordance with the updated CG Charter, an in-depth assessment is carried out by the Nomination and Remuneration Committee. This assessment involves a comprehensive (self-)evaluation of the competencies, skills, and knowledge already present and required in the current Board of Directors. As part of this process, each director has been requested to assess their own proficiency in specific areas of knowledge, expertise, or experience relevant to Greenyard’s operations and areas of activity. This assessment has provided valuable insights into the individual strengths of the directors and areas for development where additional expertise may be needed to further strengthen the Board of Directors. It has resulted in a comprehensive overview of the collective competencies of the Board of Directors, demonstrating a diverse range of expertise and knowledge in various fields, thus enabling a well-balanced decision-making process. The outcome of the ongoing (re)appointment procedure will be disclosed in the (re)appointment proposals put forth by the Board of Directors, based on the recommendations of the Nomination and Remuneration Committee, and to be submitted to the shareholders for approval at the Annual Shareholders’ Meeting scheduled for 15 September 2023.
Furthermore, as of 16 September 2022, director Alychlo NV is represented on the Board of Directors by Ms. Els Degroote as its permanent representative, as defined in article 2:55 BCAC. Ms. Els Degroote (permanent representative of Alychlo NV) succeeded Ms. Hilde Laga as a member of the Audit Committee with effect as of the same date.
CONTENTS | CONTENTS FINANCIAL REPORT 186 /
Composition of the Board of Directors as at 31 March 2023
(1) The reference to AGM is the abbreviation for Annual Shareholders’ Meeting, with a reference to the year in which the Annual Shareholders’ Meeting is held.
(2) The Board of Directors delegated the daily management of Greenyard to Mr. Hein Deprez (permanent representative of Deprez Invest NV) for an indefinite period, effective from 1 February 2018. He bears the title of co-Chief Executive Officer and Managing Executive director.
(3) Chairman of the Board of Directors.

(4) Independent director within the meaning of article 7:87 (§1) BCAC and provision 3.5 of the 2020 Code.
(5) Mr. Aalt Dijkhuizen (permanent representative of Aalt Dijkhuizen B.V.) will not be subjected to a decision by the Board of Directors regarding the continuation in office upon reaching the age of 70 years during the calendar year 2023. This is due to the removal of the age limit for directors and its replacement with a specific assessment process as part of the (re)appointment procedure. Similarly, the same applies to Mr. Marc Ooms (permanent representative of Bonem Beheer BV), who has already passed the age of 70 if he applies for reappointment at the Annual Shareholders’ Meeting of 15 September 2023.
(6) Number of years until 31 March 2023, rounded up to the nearest full figure.
Biographies
The following paragraphs set out the biographical information of the members of the Board of Directors as at 31 March 2023, including information on board memberships held in other (listed) companies:
Hein Deprez I Co-Chief Executive Officer and Managing Executive director (°1961)
Permanent representative of Deprez Invest NV

Please refer to the Composition of the Executive Management for Mr. Hein Deprez’s biography.
Koen Hoffman I independent director and Chairman of the Board of Directors (°1968)
Permanent representative of Ahok BV
Mr. Koen Hoffman obtained a master’s in Applied Economics and an MBA at Vlerick Business School. Between 1992 and July 2016, he was active at KBC Group where he began his career in the corporate finance department becoming CEO of KBC Securities in October 2012. Since August 2016, he has been the CEO of the asset management company Value Square. Mr. Koen Hoffman serves also as an independent board member at three listed companies Fagron (Chairman), MDxHealth (Chairman) and SnowWorld (Chairman).

Aalt Dijkhuizen I independent director (°1953)
Permanent representative of Aalt Dijkhuizen B.V.
Mr. Aalt Dijkhuizen has a Ph.D. in Animal Health Economics and a master’s degree in Agricultural Economics. He is a former Managing Director of the Agri Northern-Europe Business Group of Nutreco and, from 2002 to 2014, served as President and CEO of Wageningen University & Research. From 2014 to 2020, he was President of Topsector Agri & Food in the Netherlands. He is currently a supervisory board member at Royal De Heus, Hendrix Genetics and Ploeger Oxbo Group (Chairman) and co-director of the Holland Center in China. Formerly, he served as Chairman of the Food & Beverage Innovation Forum in Shanghai and acted as high-level expert to the European Commission in Brussels. Mr. Dijkhuizen was awarded Honorary Citizen of Fujian Province in 2008, and Commander of the Order of Orange-Nassau in the Netherlands in 2014. Mr. Dijkhuizen does not hold any board memberships in other listed companies on 31 March 2023.
/ 187
Director's name First Appointment End of term(1) Number of years(6) Aalt Dijkhuizen B.V., rep. by Aalt Dijkhuizen(4)(5) 21/02/2017 AGM 2024 6 Ahok BV, rep. by Koen Hoffman(3)(4) 04/10/2017 AGM 2026 6 Alro BV, rep. by Gert Bervoets(4) 16/09/2022 AGM 2026 1 Alychlo NV, rep. by Els Degroote 01/04/2021 AGM 2023 2 Bonem Beheer BV, rep. by Marc Ooms(5) 19/06/2015 AGM 2023 8 Deprez Invest NV, rep. by Hein Deprez(2) 19/06/2015 AGM 2023 8 Galuciel BV, rep. by Valentine Deprez 18/02/2021 AGM 2023 2 Gescon BV, rep. by Dirk Van Vlaenderen(4) 05/07/2016 AGM 2023 7 Management Deprez BV, rep. by Veerle Deprez 19/06/2015 AGM 2023 8
Dirk Van Vlaenderen I independent director (°1959)
Permanent representative of Gescon BV
Mr. Dirk Van Vlaenderen has a master’s degree in Applied Economics. He was an Arthur Andersen LLP partner from 1993 and a member of the audit management committee and Managing Partner at Deloitte from 2002 until 2016. He has served a wide range of national and international companies as statutory auditor. He was also a lecturer at the Universities of Brussels and Leuven in IFRS Basics and Reporting in an International Context. He serves as a board member in other companies including at two listed companies Accentis SA and IEP Invest NV.
Els Degroote I non-executive director (°1976)
Permanent representative of Alychlo NV
Ms. Els Degroote holds a master of Commercial Engineer, and an MBA Financial Management and an MBA High Potential Banking & Insurance from the Vlerick Business School. Between 2000 and 2016, she worked at KBC Securities, where she was Executive Director Corporate Finance until 2012, in which position she led a deal team on several and large transactions. In 2012 she became Head of Corporate Finance of KBC Securities. In the period 2016 until March 2022, she was M&A Partner in Strategy & Transactions, and Brussels Regional Managing Partner at EY. She was responsible for M&A in the Belgian market with focus on (international) private equity firms and larger corporates. In this function, she also advised Greenyard on several projects. As from April 2022 Ms. Degroote is appointed Investment Principal at Alychlo NV, an investment company founded and owned by Mr. Marc Coucke, with investments in multiple listed and non-listed companies. Both Alychlo NV and its permanent representative Ms. Els Degroote serve as a board member of several private companies.
Gert Bervoets I independent director (°1970)
Permanent representative of Alro BV
Mr. Gert Bervoets holds a master of Commercial Engineer. Between 1994 and 2002, he worked at Nestlé as Group Product Manager. In 2002 he started at H. Essers as General Manager Warehousing. H. Essers is a Belgian logistics organisation, providing integrated solutions for sustainable transport and logistics across Europe, and acting as a long-term supply chain partner for clients in various industries. He is CEO of H. Essers since March 2013. Mr. Bervoets does not hold any board memberships in other listed companies on 31 March 2023.
Marc Ooms I non-executive director (°1951)
Permanent representative of Bonem Beheer BV


Mr. Marc Ooms was General Partner of the Petercam group, a Benelux Investment Bank, and Chairman of Petercam Bank Nederland until 2011. He is currently a private equity investor and on the board of several companies including SEA-invest Corporation, Baltisse, BMT, and listed company Universal Partners.
Valentine Deprez I non-executive director (°1989)
Permanent representative of Galuciel BV
Ms. Valentine Deprez holds a master of Arts in Art History from the Catholic University of Leuven, went to Vlerick Business School and holds a Postgraduate Diploma in Hospitality from the Glion Institute of Higher Education in Switzerland. Being born into the Company’s founding family, Ms. Deprez has been involved with the business from a very early stage. Besides her mandate as director, she is active as an executive coach. Ms. Deprez does not hold any board memberships in other listed companies on 31 March 2023.
Veerle Deprez I non-executive director (°1960)
Permanent representative of Management Deprez BV
Ms. Veerle Deprez started her career with Alcatel Bell in 1980. In 1987, with her brother, Mr. Hein Deprez, she laid the foundations of Univeg, which would later become the Greenyard Fresh segment. Ms. Deprez also serves as a board member at listed company Tessenderlo Group, as well as at various companies belonging to the Group and De Weide Blik group.


CONTENTS | CONTENTS FINANCIAL REPORT 188 /
Diversity in the Board of Directors
The diagrams presented below provide a comprehensive visual representation of the Board of Directors’ composition, illustrating the diversity in terms of age, gender, nationality, and relevant competencies and expertise. Each diagram shows the number of directors within their respective category out of the total of nine directors on the Board of Directors.
Greenyard is committed to promoting diversity in the Board of Directors and its advisory Committees by striving to achieve a balanced mix of executive, non-executive and independent directors. Therefore, a comprehensive procedure for the (re)appointment of directors has been established to ensure that the Board of Directors and its advisory Committees are composed of individuals with a diverse set of skills, knowledge, experience, and educational and professional backgrounds, while also complying with the legal requirements on gender diversity as stipulated in article 7:86 BCAC. All this in addition to the professional integrity required for the performance of their role and responsibilities as a director and Committee member, as applicable.
The CG Charter describes the specific steps of the (re)appointment procedure. An essential part of this procedure is the assessment by the Nomination and Remuneration Committee of the existing skills, knowledge, and experience deemed relevant or required within the Board of Directors, taking into account Greenyard’s operations and areas of activity. This assessment is carried out, among other things, on the basis of a competence matrix proposed by the Nomination and Remuneration Committee, where appropriate in consultation with the Chairman of the Board of Directors, showing the competencies, areas of knowledge, and types of expertise sufficiently present in the Board of Directors. The Committee is responsible for determining, on this basis, the required profile for a vacant position of director.
Moreover, in the case of directors applying for reappointment, the Nomination and Remuneration Committee will take into account the directors’ individual contribution to the skills, knowledge, and experience needed on the Board of Directors, when making recommendations to the Board of Directors on their reappointment.
In the context of the self-assessment conducted by the directors in AY 22/23 for the purpose of evaluating the performance of the Board of Directors and its advisory Committees, particular attention was given to further enhancing diversity and complementarity of skills within their composition. The positive outcomes of these efforts are reflected and realized in the composition of the Board of Directors, which on 31 March 2023, comprises nine members, three of whom are female, thereby ensuring compliance with the gender diversity requirements of article 7:86 BCAC. The Board also includes representatives of two nationalities and different age categories. The directors have complementary experience and knowledge and come from diverse educational and professional backgrounds, as evidenced in their professional biographies and visually illustrated in the diagrams above.
/ 189
Environmental, social & governance (ESG) 8 Corporate Finance 8 Human Resources & Compensation 8 Corporate Governance & Ethics 8 M&A 8 Risk management 8 Strategy & Strategic Planning 9 Expertise 30-40 1 40-50 1 50-60 2 60+ 5 Age NL B 1 8 Nationality 3 6 Gender Diversity in the Board of Director Agronomic & Sourcing 4 Industry & Operations 6 Accounting & Audit 7 Food Retail & Food Service 4 Investors experience 6 Information technologies & Trends 4 Logistics & Supply Chain 4
1.2. Role and responsibilities of the Board of Directors
Role of the Board of Directors
The role of the Board of Directors is to define a value-based strategy to achieve long-term sustainable success for Greenyard. As a collegial body, the Board of Directors supervises the performance of the Company and strives to achieve sustainable value creation by establishing and assuring effective, responsible, and ethical leadership as well as efficient risk management and control.
Based on proposals made by the Executive Management, the Board of Directors determines the Company’s medium- and long-term strategic direction and regularly reviews the implementation of this strategy.
The Board evaluates the risk levels that Greenyard is willing to take to achieve its strategic objectives and assures the necessary financial and human resources for Greenyard to achieve its goals.
In fulfilling its role, the Board of Directors is simultaneously mindful of sustainability issues and the interests of various stakeholders, including Greenyard’s shareholders, employees, customers, suppliers, and growers, as well as the community and environment in which Greenyard operates.
Furthermore, the Board of Directors supports and supervises the Executive Management in the performance of its duties and challenges its members constructively whenever appropriate.
Role of the Chairman of the Board of Directors
Independent director Mr. Koen Hoffman (permanent representative of Ahok BV) has been Chairman of the Board of Directors since 1 February 2018. He was appointed Chairman for the duration of his term of office as a director. Following his reappointment as an independent director at the Annual Shareholders’ Meeting of 16 September 2022, he continues to chair the Board of Directors as its Chairman.
As Chairman, Mr. Hoffman plays a crucial role in ensuring that the Board of Directors operates in an effective and efficient manner. He presides over the Board meetings to facilitate constructive discussions and decision-making while maintaining an open and respectful atmosphere. He further oversees the proper introduction and onboarding of new directors to ensure that they are adequately acquainted with their duties and responsibilities.
Mr. Hoffman also chairs the Company’s Shareholders’ Meetings and maintains effective communication with shareholders. He serves as the primary liaison for all matters falling within the Board of Directors’ purview and strives to maintain a professional and constructive interaction between the Board of Directors and the Executive Management.
Activities of the Board of Directors in AY 22/23
The Board of Directors convenes as often as the interest of the Company requires, sufficiently regularly to effectively fulfill its duties and responsibilities, and at a minimum, meets five times a year on predetermined dates. Decisions of the Board of Directors are made by majority vote, though the Board of Directors endeavors to reach a consensus. The Board operates according to the Company’s articles of association and to its terms of reference as contained in the CG Charter.
In AY 22/23, the Board of Directors met nine times. Of these meetings, four were held via videoconference. In addition, the possibility of passing resolutions by unanimous written consent of the directors, as permitted by article 7:95 BCAC and article 19 of the Company’s articles of association, was used on four occasions.
All meetings were attended by the Company Secretary, Ms. Fran Ooms. Additionally, the members of the Executive Management, who have a standing invitation to attend Board meetings, and the Group Legal & HR Director were invited to attend each meeting. Other members of the Leadership Team and senior managers responsible for corporate teams were selectively invited to brief or advise the Board of Directors on a particular topic or agenda item.
The main responsibilities of the Board of Directors are listed (non-exhaustively) in the CG Charter. Specifically for AY 22/23, the Board of Directors dealt with the following matters:
• Receiving business and financial updates by the Executive Management reporting on the operational and financial performance at Group and divisional level, and on strategic developments under their leadership as set forth in the 2030 Strategy;
CONTENTS | CONTENTS FINANCIAL REPORT 190 /
• Analysing and approving the Budget for AY 23/24 and the new Long-Range Plan (LRP) until AY 25/26, elaborated under the leadership of and proposed by the Executive Management;
• Following up on the implementation of the Sustainability Roadmap for 2025 and monitoring Greenyard’s performance relating to its sustainability & ESG commitments and KPIs, as captured therein and laid down in its sustainability report AY 21/22;
• Following up on forecasts review by the Executive Management, including an assessment of the impact of the macro-economic and geopolitical circumstances, such as inflation increase, supply chain interruptions, energy crisis, and the Russia-Ukraine conflict, on the business and/or forecasts, and the mitigating measures taken by the Executive Management;
• Receiving updates on specific topics, such as cybersecurity, and quality, health and safety, in the context of implementing a risk management framework, as part of the Audit Committee’s reporting;
• Monitoring compliance with the Code of Conduct, and in this context the implementation of the updated Whistleblowing Policy, including notifications through the online whistleblowing tool, as part of the Audit Committee’s reporting;
• Monitoring the status and approving (potential) divestments, business developments, and possible investments and M&A opportunities. This includes initiating and following up on the divestiture processes for Greenyard Fresh UK Ltd. and Greenyard Fresh France SAS, and approving the entering into a long lease and lease back transaction covering the Greenyard Prepared division’s site in Bree, Belgium;
• Following up on and approving refinancing arrangements discussed and formalized in a new financing agreement of € 420m concluded on 22 September 2022 with a syndicate of (existing and new lending) banks for a five-year period, including the subsequent conversion into a sustainability-linked loan, which is directly linked to Greenyard’s sustainability performance and achievement of ESG KPIs;
• Convening the 2022 Annual Shareholders’ Meeting, preparing the relevant resolutions for approval, and reviewing and approving Greenyard’s financial reporting;
• Selecting KPMG Bedrijfsrevisoren BV as new statutory auditor, subject to approval by the Annual Shareholders’ Meeting scheduled for 15 September 2023, following a formal tender process for audit firms conducted under the supervision of and in consultation with the Audit Committee, given the applicable external audit rotation rules for audit firms;
• Monitoring the progress of the steps taken and envisaged in the succession process of Executive Management members, led by the Nomination and Remuneration Committee, including approving, upon the proposal of the Committee, contractual arrangement for termination and/or further cooperation;
• Following up on the (re)appointment procedure for directors, coordinated by the Nomination and Remuneration Committee;
• Conducting a formal self-assessment of the performance of the Board of Directors and its advisory Committees and identifying areas for improvement, monitored by and upon the advice of the Nomination and Remuneration Committee;
• Evaluating and analysing the performance of the Executive Management members in respect of AY 21/22 and setting short-term incentive objectives for AY 22/23 in line with the applicable remuneration policy, based on recommendations from the Nomination and Remuneration Committee;
• Approving a revised and updated Corporate Governance Charter, upon the advice of the Nomination and Remuneration Committee;
• Following up on the Market Abuse Regulation requirements, particularly on the disclosure of inside information;
• Approving press releases related to the announcement of (semi-)annual financial results, and other press releases labelled as regulated information during AY 22/23.
1.3. Evaluation of the Board of Directors – self-assessment
At least once every three years, the Board of Directors evaluates its own performance in terms of its size, composition, functioning and performance as well as that of its advisory Committees and the interaction with the Executive Management.
The aim is to encourage continuous improvement in the corporate governance of Greenyard by recognizing the Board of Directors’ strengths while identifying areas for improvement. The Board of Directors’ self-assessment exercise is coordinated by the Company Secretary, under the leadership of its Chairman, and is monitored by the Nomination and Remuneration Committee.
The self-assessment exercise has the following main objectives:
• Verifying whether the actual composition of the Board of Directors and its advisory Committees is appropriate and represents sufficient expertise in Greenyard’s areas of activity;
• Assessing the effective contribution of each director in terms of presence and constructive involvement in the discussions and decision-making;
• Verifying whether the chosen one-tier governance structure is still appropriate;
• Reviewing the functioning of the Board of Directors and its advisory Committees, and the execution of their responsibilities;
• Verifying whether the interaction with the Executive Management takes place transparently;
• Verifying whether relevant or important topics can be discussed in an informed manner and whether there is sufficient time to discuss them properly.
/ 191
The most recent evaluation of the Board of Directors through a self-assessment exercise has been carried out in AY 22/23. The Nomination and Remuneration Committee jointly concluded that the outcome of the evaluation was satisfactory and positive in respect of the current governance structure, the cooperation and dynamics within the Board of Directors, the interaction with its advisory Committees and the Executive Management, and the contribution of each director and their level of commitment. Based on the directors’ input, the Nomination and Remuneration Committee proposed concrete suggestions to improve the efficient functioning and performance of the Board of Directors and its Committees. These proposals were approved by the Board of Directors of 16 February 2023 and implemented accordingly.
When considering the reappointment of a director, as part of the (re)appointment procedure for directors, the Nomination and Remuneration Committee will assess, among other things, the commitment and constructive involvement of the director concerned in Board discussions and decision-making, as well as the director’s skills and relevance in the light of its recommendation to the Board of Directors. The Board of Directors ensures that any appointment or re-election allows an appropriate balance of skills, knowledge and experience to be maintained.
The non-executive directors regularly evaluate their interaction with the Executive Management. In this respect, the nonexecutive directors meet at least once a year in the absence of the Managing Executive director, who is the sole executive director on the Board of Directors. In the context of the Board of Directors’ meeting of 16 February 2023 proposals regarding the Executive Management members’ variable and fixed remuneration(components) were discussed and decided upon. The Executive Management members attended this meeting in an advisory role, given their standing invitation to Board meetings. Those members with potentially conflicting interests left the meeting at the beginning of the discussions and deliberations on the proposals relating to their remuneration. Given that Mr. Hein Deprez (permanent representative of Deprez Invest NV) indicated to waive the bonus that would be paid to him in his capacity as co-CEO for AY 22/23 as well as any proposed indexation adjustment of his management fee as of 1 April 2023, his presence as Managing Executive director at the meeting of the Board of Directors of 16 February 2023 was deemed not to conflict with the proposed decisions to be taken. Moreover, the Board of Directors did not consider that an annual formal meeting of the non-executive directors, without the presence of the Managing Executive director, as stipulated in provision 3.11 of the 2020 Code would be necessary in AY 22/23.
Indeed, the non-executive directors maintain regular contact with each other and with the Chairman of the Board of Directors, whether or not in the context of advisory Committee meetings, the minutes of which are made available to all directors, upon request. Additionally, prior to Board of Directors’ meetings, Committee minutes or written summaries thereof are shared to enable the Board of Directors to make well-informed decisions.
2. Advisory Committees to the Board of Directors
The Board of Directors is assisted by two permanent advisory Committees:
• the Audit Committee (see 2.1, below), and
• the Nomination and Remuneration Committee (see 2.2, below).
These Committees advise the Board of Directors on decisions to be taken, ensure that certain matters are dealt with appropriately, and, if necessary, bring specific matters to the attention of the Board of Directors. The existence of the Committees does not affect the responsibility of the Board of Directors as a whole. The Committees do not have the power to make binding decisions, as decisionmaking remains the collegial responsibility of the Board of Directors, nor will the Committees formulate Greenyard’s strategy.
The roles, tasks, functioning, and composition of the Committees are determined in accordance with the BCAC and the recommendations of the 2020 Code. These details are set out in each Committee’s respective terms of reference, which are part of the CG Charter.
2.1. Audit Committee Composition
The Audit Committee is composed of at least three directors, all of whom are non-executive directors. At least one member of the Committee is an independent director within the meaning of article 7:87 (§1) BCAC, who satisfies the criteria set out in provision 3.5 of the 2020 Code.
CONTENTS | CONTENTS FINANCIAL REPORT 192 /
The members of the Audit Committee are appointed by the Board of Directors. The term of office of members of the Audit Committee may be renewed at the same time as their term of office as directors. The end of the mandate as director of a member of the Audit Committee also results in the termination of the director’s mandate on the Audit Committee.
As at 31 March 2023, the Audit Committee comprises the following members:
Dirk Van Vlaenderen independent director and Chairman of the Audit Committee (permanent representative of Gescon BV)
Els Degroote non-executive director (permanent representative of Alychlo NV)
Veerle Deprez non-executive director (permanent representative of Management Deprez BV)
Following the resignation of Ms. Hilde Laga as an independent director, Ms. Els Degroote (permanent representative of Alychlo NV) was appointed as a new member of the Audit Committee, with effect as of 16 September 2022. This change in membership has been accomplished and concluded in compliance with the applicable corporate governance rules. The new composition of the Audit Committee corresponds to the relevant legal requirements and corporate governance recommendations in this regard.
All members of the Audit Committee have expertise related to the Company’s activities and relevant experience in accounting, auditing and finance, which enables them to effectively fulfill the responsibilities of the Audit Committee, as evidenced by their professional biographies (see above). The biography of Mr. Dirk Van Vlaenderen, Chairman of the Audit Committee, deserves special mention for his extensive knowledge and expertise in accounting and auditing. As a former statutory auditor and Managing Partner at Deloitte, Mr. Van Vlaenderen brings valuable insights and experience to the Committee. Moreover, as an independent director, he fully complies with article 7:87 (§1) BCAC.
The CFO has a standing invitation to attend Audit Committee meetings in an advisory role unless the Audit Committee decides otherwise. The Audit Committee decides whether and when the co-CEOs, the statutory auditor or other persons may attend its meetings. In addition, the Audit Committee meets with the statutory auditor at least once a year to exchange views resulting from the audit process, including any (potential) areas of concern that may have arisen from the audit. These matters are discussed at least once a year in the Audit Committee in the presence of the person(s) responsible for the internal audit of Greenyard.
Role and Responsibilities
The Audit Committee assists the Board of Directors in fulfilling its supervisory and control responsibilities, with a view to monitoring to the fullest extent possible, including risk control. In this respect, the Audit Committee is at least responsible for notifying the Board of Directors of the outcome of the statutory audit of the annual accounts and consolidated financial statements, and for explaining to the Board of Directors how the statutory audit contributed to the integrity of financial reporting and the Audit Committee’s role in that process.
Moreover, the Audit Committee oversees the financial reporting process, the efficiency of the internal control and risk managementsystems, and the internal audit and its performance (for more information in this respect, see 9., below). It also assesses the independence of the statutory auditor and reviews the appropriateness of additional services provided to Greenyard. The Audit Committee regularly reports on its activities to the Board of Directors, particularly when the Board of Directors draws up the (semi-)annual and consolidated accounts.
Further information regarding the Audit Committee’s duties and responsibilities can be found in the CG Charter, which is available on Greenyard’s website (www.greenyard.group).
In accordance with its terms of reference, the Audit Committee is required to conduct a self-assessment at least every three years to evaluate its functioning, efficiency, and mission. The most recent self-assessment was conducted in AY 22/23 as part of a broader evaluation conducted within the Board of Directors, which also included specific questions on the composition, functioning, responsibilities and performance of the Committee and its interactions. The outcome thereof was subsequently discussed in the Audit Committee and recommendations made in this regard were considered and, to the extent supported by the entire Committee, implemented accordingly.
/ 193
After an Audit Committee meeting, the Chairman of the Committee (or, in case of absence, a member of the Committee designated for that purpose) reports on the Audit Committee’s activities and findings to the Board of Directors. When reporting to the Board of Directors, the Audit Committee identifies issues for which it considers action or improvement necessary or desirable and makes recommendations on the decisions or steps to be taken. Approved minutes of the Committee meetings are made available to the directors at the Company Secretary’s office or through the Board’s online portal accessible to all directors.
Activities of the Audit Committee in AY 22/23
During AY 22/23, the Audit Committee held five meetings, including two via videoconference. The attendance rate of the Chairman of the Audit Committee and its members Ms. Veerle Deprez (permanent representative of Management Deprez BV) and, as of 16 September 2022, Ms. Els Degroote (permanent representative of Alychlo NV) for the meetings of the Audit Committee in AY 22/23 was 100%.
The statutory auditor Deloitte Bedrijfsrevisoren BV (represented by Mr. Kurt Dehoorne) participated (partially) in three meetings, while the internal auditor attended (partially) one meeting. All Audit Committee meetings in AY 22/23 were attended by the CFO, the Group Legal & HR Director, and the Company Secretary.
The Audit Committee dealt with the following main matters in AY 22/23:
• Overseeing the financial reporting process, with a focus on the Group’s consolidated quarterly and (semi-)annual results and the Company’s (semi-)annual accounts and consolidated financial statements;
• Monitoring specific consolidation-related matters and the accounting treatment for specific IFRS operations and applications;
• Evaluating and monitoring the statutory auditor’s performance, including controlling one-to-one rules;
• Evaluating and monitoring the internal audit function, including the internal audit plan for AY 23/24, and the findings of internal audit activities and controls conducted in AY 22/23, in the presence of the internal auditor;
• Reviewing and discussing the Group’s internal control improvements and risk management systems and their efficiency, with particular focus on cybersecurity, and receiving updates on business and finance risks with a view to implementing a risk management framework, as well as on Group initiatives in this respect;
• Reviewing and discussing the Group’s tax strategy and tax-related projects;
• Following up on pending litigations and material claims reported by Group entities;
• Conducting and following up on the formal tender process for audit firms initiated under the applicable external audit rotation rules for audit firms as laid down in the applicable audit legislation1 and, based on the conclusions from a comparative analysis using predetermined objective criteria, making a recommendation to the Board of Directors to select and propose KPMG Bedrijfsrevisoren BV as new statutory auditor for appointment at the Annual Shareholders’ Meeting scheduled for 15 September 2023;
• Monitoring relevant regulatory developments, including the EU Corporate Sustainability Reporting Directive and EU Taxonomy, and assessing the impact on, amongst others, the sustainability reporting process, including for the purpose of obtaining external assurance;
• Monitoring compliance with the Code of Conduct, and in this context the implementation of the updated Whistleblowing Policy, including notifications through the online whistleblowing tool, taking into account applicable confidentiality and anonymity requirements.
2.2. Nomination and Remuneration Committee Composition
The Nomination and Remuneration Committee is composed of at least three directors, all of whom are non-executive directors. At least the majority of its members are independent directors within the meaning of article 7:87 (§1) BCAC, who satisfy the criteria of provision 3.5 of the 2020 Code.
The members of the Nomination and Remuneration Committee are appointed by the Board of Directors. The term of office of members of the Nomination and Remuneration Committee may be renewed at the same time as their term of office as directors. The end of the mandate as director of a member of the Nomination and Remuneration Committee also results in the termination of the director’s mandate on the Nomination and Remuneration Committee.
CONTENTS | CONTENTS FINANCIAL REPORT 194 /
1 Regulation (EU) No. 537/2014 of the European Parliament and the Council of 16 April 2014 on specific requirements regarding statutory audit of public-interest entities and repealing Commission decision 2005/909/EC and the Act of 7 December 2016 regarding the organization of the profession of and the public supervision on auditors.
As at 31 March 2023, the Nomination and Remuneration Committee comprises the following members:
Aalt Dijkhuizen independent director and Chairman of the Nomination and Remuneration Committee
(permanent representative of Aalt Dijkhuizen B.V.)
Koen Hoffman independent director
(permanent representative of Ahok BV)
Veerle Deprez non-executive director
(permanent representative of Management Deprez BV)
The members of the Nomination and Remuneration Committee have extensive experience and expertise in the area of remuneration, through the experience they have gained, inter alia, during their professional careers in senior executive positions and board memberships in other companies, as evidenced by their professional biographies (see above).
The co-CEOs are invited to attend meetings of the Nomination and Remuneration Committee in an advisory role when the Committee deals with matters on which they should be consulted or their reasoned proposals should be requested, in accordance with the updated CG Charter. The Group Legal & HR Director has a standing invitation to attend meetings of the Nomination and Remuneration Committee in an advisory capacity. They will not participate in meetings regarding their own remuneration, the appointment of their successor(s), or any other matters determined by the Committee. The Committee may, at its discretion, invite other persons to such meetings as it deems necessary.
Role and Responsibilities
The Nomination and Remuneration Committee is responsible for making proposals and assisting the Board of Directors in connection with, on the one hand, the remuneration(components) of the directors and members of the Executive Management, and the remuneration policy and any deviations therefrom and, on the other hand, the (re)appointment of directors and members of the Executive Management and the Leadership Team. The Committee also prepares the remuneration report that the Board of Directors adds to the Corporate Governance Statement (as part of the Financial Report), and the remuneration policy, which are both subject to approval by the Annual Shareholders’ Meeting. In addition, the Committee assists the Chairman of the Board of Directors in evaluating the performance and functioning of the Board of Directors and its advisory Committees.
Subject to the approval of the amended remuneration policy (see 7., below) at the Annual Shareholders’ Meeting scheduled for 15 September 2023, the decision-making authority on the variable and fixed remuneration(components) of the other members of the Leadership Team (who are not part of the Executive Management) will be reallocated to the Board of Directors, which will decide on the advice of the Nomination and Remuneration Committee. Currently, pursuant to the applicable remuneration policy, these decisions are made by the Executive Management.
The Committee reports on its activities, findings, and recommendations to the Board of Directors by means of a concise written report made available to the directors prior to the Board meeting and orally explained at the meeting by the Chairman of the Committee (or, in case of absence, a member of the Committee designated for that purpose). In its reporting to the Board, the Nomination and Remuneration Committee identifies issues for which it considers action or improvement necessary or desirable and makes recommendations as to the decision or steps to be taken. Approved minutes of the Committee meetings are made available to the directors at the Company Secretary’s office or through the Board’s online portal accessible to all directors.
Activities of the Nomination and Remuneration Committee in AY 22/23
In AY 22/23, the Nomination and Remuneration Committee held a total of eight meetings, six of which were held via video-conference. The attendance rate of the Committee members was 96%, as one member was absent from a meeting due to unforeseen circumstances and was therefore represented at the meeting by another member, by proxy. All meetings were attended by the Group Legal & HR Director and the Company Secretary, and when necessary or deemed appropriate, by (one of) the co-CEOs.
The Nomination and Remuneration Committee discussed the following main topics in AY 22/23:
• Continuously monitoring changes to the regulatory framework and recommendations on governance and remuneration, including those related to the BCAC and the 2020 Code, and taking into account stakeholders’ expectations;
/ 195
• Reviewing the remuneration policy approved by the 2021 Annual Shareholders’ Meeting, taking into account the aforementioned regulatory framework and best governance practices, and making recommendations to the Board of Directors on proposed adjustments for further alignment and compliance, subject to approval by the Annual Shareholders’ Meeting scheduled for 15 September 2023;
• Initiating and leading the process for assessing and selecting (new) candidate directors for (re)appointment as stipulated in the CG Charter, in view of directors’ mandates that expired or will expire;
• Initiating, coordinating and following up on the succession process for Executive Management members, and making recommendations to the Board of Directors on contractual arrangements for termination and/or further cooperation;
• Reviewing the proposed financial objectives for the bonus for AY 22/23 and advising on the Executive Management members’ personal short-term incentivetargets for AY 22/23, while considering the alignment with the Company’s 2030 Strategy and the achievement of ESG KPIs, as outlined in Greenyard’s Sustainability Roadmap;
• Evaluating the Executive Management members’ overall individual performance in AY 21/22 and submitting a proposal to the Board of Directors;
• Making recommendations on the individual remuneration package for the Executive Management members and following up on salary adjustments for other Leadership Team members, taking into account the exceptional macro-economic circumstances;
• Following up on management changes at country and divisional level and on recruitments for vacant positions;
• Monitoring the establishment of a succession plan for senior management positions, and appropriate leadership and talent development programs, as well as initiatives aimed at fostering a positive work environment;
• Preparing and reviewing the remuneration report, to be included in the Corporate Governance Statement;
• Coordinating the formal self-assessment of the performance of the Board of Directors and its advisory Committees conducted in AY 22/23 and identifying areas for improvement, including assessing the directors’ competencies and expertise in Greenyard’s areas of activity, and making recommendations to the Board of Directors;
• Reviewing and discussing updates and proposed changes to the CG Charter and making recommendations to the Board of Directors for approval of a revised version.
3. Attendance at Board of Directors and
Advisory Committees meetings
The following overview displays the attendance rate of directors at all Board and Committee meetings that took place in AY 22/23, including any additional meetings that were not scheduled in the corporate calendar. Decisions made through the written decision-making procedure are not reflected in this overview.
To express the attendance rate, the denominator of the fraction represents the total number of meetings of the Board of Directors or a Committee, taking into account the respective director’s term of office.
(1) Alychlo NV is represented on the Board of Directors by Ms. Els Degroote, with effect as of 16 September 2022. Until that date, Mr. Marc Coucke was Alychlo NV’s permanent representative on the Board of Directors. The attendance rate of Alychlo NV as director is shown in the overview, without distinction in terms of permanent representation.
CONTENTS | CONTENTS FINANCIAL REPORT 196 /
AY 22/23 Board of Directors Audit Committee Nomination & Remuneration Committee Number of meetings 9 5 8 Deprez Invest NV, rep. by Hein Deprez 9/9 Ahok BV, rep. by Koen Hoffman 8/9 7/8 Aalt Dijkhuizen B.V., rep. by Aalt Dijkhuizen 8/9 8/8 Alro BV, rep. by Gert Bervoets 3/4 Alychlo NV, rep. by Els Degroote(1) 9/9 4/4 Bonem Beheer BV, rep. by Marc Ooms 7/9 Galuciel BV, rep. by Valentine Deprez 9/9 Gescon BV, rep. by Dirk Van Vlaenderen 8/9 5/5 Hilde Laga 2/5 0/1 Management Deprez BV, rep. by Veerle Deprez 9/9 5/5 8/8
4. Executive Management
Since 9 February 2019, the responsibility for day-to-day management has been exercised by two Chief Executive Officers (co-CEOs). Together with the Chief Financial Officer (CFO), the co-CEOs constitute the Executive Management. The Executive Management does not qualify as a management board within the meaning of the BCAC. The Executive Management is assisted by the Leadership Team (see 4.3, below) in the exercise of the Company’s day-to-day and operational management.
4.1. Composition of the Executive Management Principles
The Executive Management consists of the two co-CEOs and the CFO, appointed by the Board of Directors based on the advice of the Nomination and Remuneration Committee. The co-CEOs may only be appointed or dismissed by a two-thirds majority in the Board of Directors, while the CFO is appointed after consultation with and a reasoned proposal from the co-CEOs.
Executive directors are de jure members of the Executive Management. The sole executive director on the Board of Directors, Mr. Hein Deprez (permanent representative of Deprez Invest NV), one of the co-CEOs, is part of the Executive Management.

Membership of the Executive Management as at 31 March 2023
Hein Deprez I Co-Chief Executive Officer and Managing Executive director (°1961)
Permanent representative of Deprez Invest NV
Mr. Hein Deprez is an entrepreneur and the founder of Greenyard, which today has grown into a leading global fruit and vegetable company. His journey in the industry began in 1983 with the establishment of a small mushroom farm. In 1987, he founded Univeg, which eventually became today’s Greenyard Fresh segment. Recognizing new opportunities, he ventured into what is now known as the Long Fresh segment, through his participation in the publicly listed company Pinguin in 2007, specializing in frozen fruit and vegetables. Pinguin acquired ScanaNoliko in 2011, active in canned fruit and vegetables, which later became the former Greenyard Foods group. In 2015, Univeg’s activities and operations were bundled into the publicly listed Greenyard Foods group, which name was afterward changed to Greenyard. As its founder, and in his role as Managing Executive director and co-Chief Executive Officer since mid-February
/ 197
From left to right: Mr. Marc Zwaaneveld, co-CEO, Mr. Geert Peeters, CFO, and Mr. Hein Deprez, co-CEO.
2019, Mr. Hein Deprez plays a pivotal role in defining Greenyard’s long-term vision, strategy, and strategic direction. He also focuses on establishing and managing strategic partnerships and integrated relationships with customers and growers. In addition, he served as a board member at various companies in Belgium and abroad. Currently, he serves as a board member in companies belonging to the Group and De Weide Blik group.
Marc Zwaaneveld I Co-Chief Executive Officer (°1961)
Permanent representative of MZ-B BV
Mr. Marc Zwaaneveld advised various international companies and consulted on investments, restructuring and interim management during the periods 2002-2005 and 2011-2014. From 2005 until 2011, he was CFO and Vice Chairman of the Management Board at SUEZ Benelux - Germany. In 2014, he became COO at Van Gansewinkel Group. After six months, he was appointed CEO (until 2017) and led the company’s turnaround. In early 2019, he took up the newly created position of Chief Transformation Officer at Greenyard to lead the Transformation Office created to steer the value recovery. To ensure an embedded implementation of the Transformation Plan throughout the entire organization, Mr. Zwaaneveld was appointed co-CEO in mid-February 2019. He has no other mandates outside Greenyard.
Geert Peeters I Chief Financial Officer (°1973)
Permanent representative of Chilibri BV
Mr. Geert Peeters started his career as a Management Consultant at PwC advising international companies on business processes, reporting and systems. He became a Senior Manager at PwC and later at Deloitte, working in corporate finance and recovery, where he supervised various acquisitions and reorganisations. In 2005, he moved to SUEZ, where he was promoted to Controlling Manager and later became Finance Director Belux. In 2012, Mr. Peeters became Metallo Group CFO where he also served as a director before joining Greenyard as CFO in September 2018. He has no other mandates outside Greenyard.
4.2. Role and responsibilities of the Executive Management
Role and Responsibilities
The Board of Directors has delegated day-to-day management to both co-Chief Executive Officers (co-CEOs), each of whom may act separately, within the meaning of article 7:121 BCAC. Day-to-day management includes all actions and decisions that do not exceed the needs of the daily life of the Company, as well as those actions and decisions that do not justify the intervention of the Board of Directors for reasons of minor importance or urgency.
Furthermore, the co-CEOs are authorized to represent the Company in matters of daily management, as well as in specific situations where they are empowered to act on behalf of the Company based on specific mandates granted by the Board of Directors.
The co-CEOs report directly to the Board of Directors and are accountable to the Board of Directors for the exercise of the responsibilities delegated to them regarding day-to-day management and operational leadership of the Group.
The co-CEOs present Executive Management proposals to the Board of Directors (or to the advisory Committees) and report regularly to the Board of Directors on the activities of the Executive Management. The co-CEOs are the main spokespersons for Greenyard, both within the Group and to the outside world and stakeholders.
The Executive Management’s main responsibilities are:
• Developing and implementing the vision, mission, strategic objectives and direction of the Group, including the strategy towards (risks in relation to) sustainability issues, and advising the Board of Directors on these matters, with a focus on long-term value creation by Greenyard;
• Overseeing the day-to-day and operational management of Greenyard;
• Identifying, investigating, and proposing investment, divestment, and financing opportunities and needs to the Board of Directors;
• Establishing strategic partnerships with key customers and managing integrated customer relationships and grower relationships;
• Providing advice to the Board of Directors and/or Committees, in particular when requested;
• Implementing decisions made by the Board of Directors;
• Exercising powers delegated by the Board of Directors;
• Establishing and monitoring internal controls (to identify, assess, manage, and control financial, sustainability, and other risks), while respecting the supervisory role of the Board of Directors;
• Overseeing the complete, timely, reliable and accurate preparation of (semi-)annual accounts in line with Greenyard’s accounting principles and policies;
• Ensuring compliance with Greenyard’s mandatory reporting requirements for (semi-)annual accounts, annual reports, and other material financial and non-financial information;
CONTENTS | CONTENTS FINANCIAL REPORT 198 /
• Presenting a balanced and understandable assessment of the Group’s financial situation to the Board of Directors;
• Handling correspondence with the Financial Services and Markets Authority (FSMA) and providing recommendations to the Board of Directors;
• Leading the Leadership Team;
• Providing the Board of Directors in a timely manner with all information necessary for the performance of its duties.
Reporting to the Board of Directors
In terms of reporting to the Board of Directors, the Executive Management provides relevant information at each Board meeting regarding matters within the competence of the Board of Directors. The co-CEOs also report on key aspects of the Group’s day-to-day and operational management.
The Executive Management reports on various topics, including:
• Performance of the Group’s business and the responsibilities of the Executive Management;
• Relevant developments within the Group since the last Board meeting;
• Operational results at Group level and within the Fresh and Long Fresh segments;
• Budget and business plan status;
• Proposed direction of the Executive Management for the upcoming quarter;
• Proposals for decisions requiring Board approval.
Furthermore, the Executive Management ensures that the Board of Directors is informed of relevant information regarding material pending legal proceedings, planned reorganizations, and any matters that could significantly impact Greenyard’s financial situation. This information is essential for the implementation of an effective risk management policy by the Board of Directors.
Functioning of the Executive Management
The Executive Management operates as a collegial body and convenes scheduled weekly meetings, with the flexibility to hold additional meetings as needed to ensure the efficient operation of Greenyard. Concise reports are drawn up after each meeting, recording key discussions and decisions, and outlining further actions, follow-up tasks, and status. The Group Legal & HR Director is designated by the Executive Management to act as secretary at these meetings. In AY 22/23, the Executive Management met on average once a week, and summary minutes of each meeting were prepared.
4.3. The Leadership Team
The Leadership Team, operating under the direction of the Executive Management, provides advice and support in the execution of Greenyard’s day-to-day management and operational direction.
Composition
Members of the Leadership Team are appointed by the Board of Directors on the recommendation of the Nomination and Remuneration Committee. The co-CEOs are involved in the appointment process for other Leadership Team members and make reasoned proposals regarding appointments. The remuneration and termination terms of Leadership Team members are governed by contractual arrangements and the applicable remuneration policy.
The Leadership Team comprises the members of the Executive Management.
In AY 22/23 there
were no changes in respect of the composition of the Leadership
Team.
As announced on 1 September 2022, the co-CEOs have committed to stay at Greenyard until 30 April 2026, and in their current roles as co-CEOs until 30 April 2024. After the aforementioned date, co-CEO Mr. Hein Deprez (permanent representative of Deprez Invest NV) has indicated his willingness to continue to focus on the Group’s strategy as an executive director. Co-CEO Mr. Marc Zwaaneveld (permanent representative of MZ-B BV) will no longer be part of the Executive Management after this date but will continue to provide his expertise to the Group as a non-executive advisor. In light of this announcement, a succession process led by the Nomination and Remuneration Committee has been initiated to enable the Board of Directors to provide for appropriate succession, which will be announced at that time.
/ 199
As at 31 March 2023 the Leadership Team consists of:
Hein Deprez
(permanent representative of Deprez Invest NV)
Marc Zwaaneveld
(permanent representative of MZ-B BV)
co-Chief Executive Officer
co-Chief Executive Officer
Geert Peeters Chief Financial Officer
(permanent representative of Chilibri BV)
Alexander Verbist
(permanent representative of Qualexco BV)
Charles-Henri Deprez
(permanent representative of Alvear International BV)
Dominiek Stinckens
Francis Kint
(permanent representative of Argalix BV)
Maarten Van Hamburg
Yannick Peeters
(permanent representative of Gemini Consulting BV)
Role and Responsibilities
Group Legal & HR Director
Managing Director of Fresh division
Managing Director of Prepared division
Managing Director of Frozen division
Managing Director of Bakker division
Managing Director of Fresh Belgium
The Leadership Team is responsible for overseeing and managing the Group’s global operations. Under the direction of the Executiv Management and in alignment with Greenyard’s overall strategy as defined by the Board of Directors, the Leadership Team carries out a range of responsibilities. These include providing support to the Executive Management in the day-to-day management of the Group, leading and supervising the Group’s operations, developing strategic guidelines, analyzing budgets and operational objectives, and overseeing local management teams.
Each member of the Leadership Team is assigned specific powers and responsibilities by the Board of Directors on the recommendation of the Nomination and Remuneration Committee, and in consultation with the co-CEOs, who make reasoned proposals. Members of the Leadership Team report on their work and responsibilities to the co-CEOs (or, where appropriate based on internal arrangements, to either CEO).
Upon request from the co-CEOs and with the consent of the Chairman of the Board of Directors, a member of the Leadership Team may be invited to a meeting of the Board of Directors to provide necessary explanations or brief on relevant topics.
In carrying out their responsibilities, the Leadership Team is supported by country-level management teams from the various divisions of the Group and by specialized corporate teams.
Functioning of the Leadership Team
The Leadership Team holds weekly meetings to regularly update and discuss ongoing matters. Additionally, an in-depth and comprehensive meeting is scheduled once a month to analyze and discuss specific topics. Each member may request to convene additional meetings as needed.
Diversity in the Executive Management and Leadership Team
As at 31 March 2023, the Leadership Team comprises nine members, representing two different nationalities and diverse age categories. As their function within Greenyard indicates, there are differences in educational background, professional experience, and career paths between members, ensuring a complementary set of knowledge and skills within the Leadership Team. The members of the Executive Management also represent a balanced team in terms of expertise and experience, as reflected in their biographies (see above). The Leadership Team is supported by management teams on country level and dedicated corporate teams, in which diversity in terms of gender, nationality, and age is well reflected.
CONTENTS | CONTENTS FINANCIAL REPORT 200 /
5. Procedures for preventing conflicts of interest
5.1. Principles
To prevent conflicts of interest, Greenyard is governed by:
• The applicable legal provisions for listed companies in case of:
- conflicts of interest involving a director as stipulated in article 7:96 BCAC (see 5.2, below), and
- conflicts of interest involving transactions as stipulated in article 7:97 BCAC (see 5.3, below).
• The additional rules as set out in the CG Charter concerning transactions with directors or Leadership Team members (including Executive Management members) that are not covered by article 7:96 BCAC (see 5.4, below).
5.2. Mandatory disclosures pursuant to article 7:96 BCAC: Conflicts of interest involving directors
Pursuant to article 7:96 BCAC, if a director has a direct or indirect financial interest that conflicts with a decision or transaction that falls under the competence of the Board of Directors, the director must notify the other members of the Board of Directors of such an interest at the start of the meeting and will act in accordance with article 7:96 BCAC. The director may not take part in the discussions of the Board of Directors relating to the transaction or decision, nor take part in the vote.
During AY 22/23, a potential conflict of interest was reported at three Board of Directors’ meetings on 25 August 2022, 11 November 2022, and 16 February 2023, before the start of deliberations on the agenda. In each case, it was concluded that the conflict of interest procedure laid down in article 7:96 BCAC did not need to be applied for the following reasons:
• At the start of the Board of Directors’ meeting of 25 August 2022, a potential conflict of interest within the meaning of article 7:96 BCAC was raised in connection with the decision to be taken by the Board of Directors regarding the appointment of director Alychlo NV as a new member of the Audit Committee, effective from 16 September 2022. Since Alychlo NV was not present at this meeting of the Board of Directors, the conflict of interest procedure did not have to be applied.
• At the start of the Board of Directors’ meeting of 11 November 2022, a potential conflict of interest within the meaning of article 7:96 BCAC was raised by Managing Executive director Mr. Hein Deprez (permanent representative of Deprez Invest NV) with respect to the decisions to be taken by the Board of Directors regarding his variable and fixed remuneration(components) as co-CEO. These agenda items were not discussed at the Board of Directors’ meeting of 11 November 2022 and were subsequently dealt with at the meeting of 16 February 2023.
As part of the Board of Directors’ meeting of 16 February 2023 proposals regarding the Executive Management members’ variable and fixed remuneration(components) were submitted to the Board of Directors for discussion and approval. Given that Mr. Hein Deprez (permanent representative of Deprez Invest NV) indicated to waive the bonus that would be paid to him in his capacity as co-CEO for AY 22/23 as well as any proposed indexation adjustment of his management fee as of 1 April 2023, his presence as Managing Executive director was deemed not to conflict with the proposed decisions to be discussed and taken. Therefore, the conflict of interest procedure did not have to be applied, as recorded as follows in the minutes (freely translated):
“Given that Mr. Hein Deprez, permanent representative of Deprez Invest NV, in his capacity as managing executive director and co-CEO, has already announced to waive the bonus that would be paid to him for current AY 22/23, the conflict of interest procedure pursuant to article 7:96 BCAC does not need to be applied to Mr. Deprez. […].
The Committee will also advise on the inflation adjustment of the fixed management fee of the Executive Management members, to be approved by the Board of Directors according to the applicable remuneration policy. The Executive Management members present at the meeting, with the exception of Mr. Hein Deprez who has indicated to waive the indexation correction to his management fee, will leave the meeting during the deliberation on this agenda item.”
Although the procedure of article 7:96 BCAC did not have to be applied in AY 22/23, the minutes of these Board of Directors’ meetings were made available for consultation by the statutory auditor.
/ 201
5.3. Mandatory disclosures pursuant to article 7:97 BCAC: Conflicts of interest involving transactions with affiliates
The Company must also comply with the procedure set out in article 7:97 BCAC where the Company, or a subsidiary, is contemplating a transaction with an affiliated company within the meaning of the international accounting standards adopted pursuant to Regulation (EC) 1606/2002 (subject to certain exceptions).
Such a decision or transaction must be reviewed and assessed in advance by a committee of three independent directors, assisted by one or more independent experts of their choice. Pursuant to article 7:97 BCAC, after having taken note of the advice of the committee, the Board of Directors will deliberate on the proposed decision or transaction. The statutory auditor must deliver an opinion as to the consistency of the financial and accounting information contained in the committee’s advice and the minutes of the Board of Directors with the information available to him within the framework of his assignment.
This procedure was not applied in AY 22/23.
5.4. Policy concerning transactions with directors or Leadership Team members not covered by article 7:96 BCAC
More in general, to any transaction contemplated between the following parties the following procedure must be applied, as outlined in the CG Charter:
• Greenyard or one of its subsidiaries, and
• Directors, members of the Leadership Team (including Executive Management members), their respective permanent representatives, or companies that do not belong to the Group, and where the director or the Leadership Team member concerned holds a board or management position.
All such transactions must be notified to the Board of Directors which has the sole authority to decide whether Greenyard or the subsidiary concerned may enter into such a transaction. The Board of Directors must justify its decision in its meeting minutes and ensure that any such transaction is at arm’s length. The Company Secretary will notify the statutory auditor by making the minutes available for consultation by the statutory auditor. This prior approval by the Board of Directors is not required if the contemplated transaction concerns a customary transaction for the Company or its subsidiary and is carried out under conditions in accordance with general market practice for comparable transactions.
In AY 22/23, the procedure for preventing conflicts of interest not covered by article 7:96 BCAC as set forth in the CG Charter, has been applied during two Board of Directors’ meetings held on 25 August 2022 and 16 February 2023, in respect of two Executive Management members, who attended these meetings as permanent invitees with an advisory role, for the following reasons:
• Mr. Marc Zwaaneveld (permanent representative of MZ-B BV), co-CEO, left the Board of Directors’ meeting of 25 August 2022, when the Nomination and Remuneration Committee in the framework of the reporting on its activities, advised on proposals regarding his contractual arrangements with Greenyard, which were subsequently finally agreed upon by the Board of Directors and Mr. Zwaaneveld (and resulted in an announcement by press release on 1 September 2022). Given the confidential nature of these discussions, Mr. Geert Peeters (permanent representative of Chilibri BV) also left the Board meeting prior to the start of deliberations on this agenda item.
• Mr. Marc Zwaaneveld (permanent representative of MZ-B BV) and Mr. Geert Peeters (permanent representative of Chilibri BV), both members of the Executive Management in their capacity as respectively, co-CEO and CFO, left the Board of Directors’ meeting of 16 February 2023, when the Nomination and Remuneration Committee in the framework of the reporting on its activities, advised on proposals in respect of the Executive Management members’ variable and fixed remuneration(components) submitted to the Board of Directors for discussion and approval.
The minutes of these Board of Directors’ meetings were made available for consultation by the statutory auditor, in accordance with the procedure set forth in the CG Charter.
CONTENTS | CONTENTS FINANCIAL REPORT 202 /
6. Compliance: Internal governance rules
6.1. Dealing Code: Rules to prevent market abuse
The legal framework of the market abuse rules applicable to Greenyard consists of Regulation (EU) No. 596/2014 of 16 April 2014 on market abuse, together with its implementing European and Belgian regulations and ESMA and FSMA guidelines (together referred to as the Market Abuse Framework). The Dealing Code was most recently modified on 23 August 2018.
Greenyard has implemented the Market Abuse Framework by adopting a Dealing Code which is made available to all employees, members of the Board of Directors, members of the Executive Management and Leadership Team, managers, consultants, temporary staff, and advisors of the Group via Greenyard’s intranet and its publicly accessible website (see below).
The Dealing Code is intended to ensure that any persons in possession of inside information do not misuse it, do not place themselves under suspicion of misuse, and that such persons maintain the confidentiality of such information, and refrain from market manipulation. This specifically relates to precise information about the Group or Greenyard shares that is not public and which, if made public, would likely have a significant effect on the share price. The Dealing Code also further contains specific rules applicable to members of the Board of Directors and the Leadership Team (including the Executive Management) and their closely associated persons and legal entities.
The Dealing Code can be consulted on the Company’s website (www.greenyard.group).
Any dealings or transactions in Greenyard shares by persons discharging managerial responsibilities and persons closely associated to them as defined in the Market Abuse Framework should be reported to the Financial Services and Markets Authority (FSMA), as well as to the Company Secretary who holds the position of Compliance Officer and is responsible for monitoring compliance with the market abuse rules and the Dealing Code.
In AY 22/23, the abovementioned rules were applied without giving rise to any major difficulties or issues.
6.2. Code of Conduct & Whistleblowing policy: Ethics
In addition, each individual working within the Group is subject to the Code of Conduct and is expected to adhere to it and comply with all applicable legal requirements in their daily work. The Code of Conduct aims to build a strong and sustainable business by upholding Greenyard’s ethical values and providing all Greenyard employees, directors, and managers with guidance to make ethical and legal conduct an integral part of their daily work. To ensure the effective implementation of Greenyard’s Code of Conduct, all individuals within the organization are required to take an online training course designed specifically for Greenyard in this regard. The Code of Conduct was last modified on 10 February 2022.
To maintain the highest standards of business ethics and legal compliance, Greenyard has established robust procedures as outlined in the Whistleblowing Policy. These procedures enable concerns about actual or suspected misconduct within Greenyard to be reported through internal whistleblowing channels, including a secure software tool. These channels provide a responsible, effective, and confidential method of reporting, where protection from retaliation is assured and individuals can remain anonymous, if they wish. Greenyard has implemented an internal process, including guidelines, training, and procedures, to support designated individuals at country and corporate level in their role as confidants. The Audit Committee is regularly informed of reported cases and the status thereof, in a manner that ensures confidentiality and anonymity. When the severity or relevance of the complaint or action taken requires it, the Board of Directors is informed, as part of the Audit Committee’s reporting on its activities.
Throughout AY 22/23, all reported allegations were treated confidentially and securely and were thoroughly investigated by a dedicated investigation team in accordance with the Whistleblowing Policy. In cases where misconduct was demonstrated or areas for improvement were identified, appropriate corrective action and/or remedial measures were taken.
/ 203
In addition, the Company established a Supplier Code of Conduct, including a separate whistleblowing channel for external parties, such as suppliers and other business partners, to report any concerns about possible wrongful conduct in their business relationships with Greenyard.
The Code of Conduct, Whistleblowing Policy, and Supplier Code of Conduct, as well as access to the respective online whistleblowing tool, can be found on the Company’s website (www.greenyard.group).
7. Remuneration report
This remuneration report provides in accordance with the provisions of 3:6 (§3) BCAC an overview of the remuneration of and the application of the remuneration policy to the directors, the co-Chief Executive Officers (co-CEOs) and the other Leadership Team members (including the Chief Financial Officer (CFO)).
7.1. Statement on the remuneration policy for directors and members of the Leadership Team with respect to AY 22/23
Following the approval by the Annual Shareholders’ Meeting of 17 September 2021, the current remuneration policy came into effect on 1 April 2021.
Greenyard’s current remuneration policy can be found on the Company’s website (www.greenyard.group).
Any material changes to the remuneration policy and in any case, at least every four years, the remuneration policy must be submitted to the Annual Shareholders’ Meeting for approval. Within the framework of the revision of the CG Charter, the Board of Directors decided on the advice of the Nomination and Remuneration Committee, to reallocate the decision-making authority on the variable and fixed remuneration(components) of the other Leadership Team members (who are not part of the Executive Management) to the Board of Directors, which already has decision-making authority regarding the remuneration of the Executive Management members. Currently, decisions on the remuneration of the other members of the Leadership Team are made by the Executive Management. As the proposed amendment can be considered a material change to the remuneration policy, it will be submitted for approval to the Annual Shareholders’ Meeting scheduled for 15 September 2023. The amended remuneration policy, including the proposed change, will come into effect as of 15 September 2023 upon approval by the Annual Shareholders’ Meeting.
Apart from the aforementioned reallocation of decision-making authority, no other significant changes are expected in the adjusted remuneration policy. This also takes into account that the current remuneration policy has been approved by a significant majority of 98,67% of shareholders’ votes.
Furthermore, the remuneration report for AY 21/22, which sets forth the remuneration granted to the directors and members of the Leadership Team (including Executive Management members) for AY 21/22 in accordance with the current remuneration policy, has been approved at the Annual Shareholders’ Meeting of 16 September 2022 by a large majority of 97,30%, and no specific comments relating to AY 21/22 were made.
The remuneration policy and the remuneration granted accordingly, are intended to support the Company’s long-term performance, as they are focused on and oriented towards achieving Greenyard’s long-term ambitions and strategic objectives, as set out in Greenyard’s 2030 Strategy and its Long-Range Plan, as updated from time to time (LRP).
In this regard, both qualitative and quantitative performance criteria for Executive Management and Leadership Team members are aligned with the strategic targets of the Company. Moreover, the current long-term incentive stock option plan for Leadership Team members, which was launched in 2021, is spread over a vesting and exercise period that parallels the duration of the LRP.
CONTENTS | CONTENTS FINANCIAL REPORT 204 /
7.2. Remuneration of the non-executive directors
7.2.1. Introduction
In accordance with Greenyard’s remuneration policy, the remuneration of non-executive directors consists of a fixed fee of € 30 000 per annum, along with an attendance fee of € 2 500 per meeting of the Board of Directors or an advisory Committee (including attendance by video or telephone conference), payable semi-annually. The directors are not entitled to an attendance fee for meetings held by video or telephone conference if the meeting is convened solely for the purpose of a status update or exclusively to make an urgent decision requiring immediate action. This remuneration covers all expenses related to the exercise of their mandate, except for international travel expenses incurred by directors domiciled outside Belgium. All remuneration is paid on a pro-rata basis according to the duration of the director’s term of office.
These amounts, applicable since AY 17/18, and reconfirmed each time thereafter, are based on a benchmark analysis of directors’ remuneration conducted against comparable and relevant peer companies of a similar size or listed on the same stock index as Greenyard (i.e. Euronext Brussels).
The remuneration of the non-executive directors complies with Greenyard’s vision, takes into account the non-executive directors’ responsibilities and the time allocated to their board membership, and is deemed sufficient for attracting the right profiles to contribute to Greenyard’s 2030 Strategy and its LRP.
By derogation to the foregoing and in accordance with the remuneration policy, the fixed annual remuneration of the Chairman of the Board of Directors amounts to € 142 500. This fixed amount includes attendance fees for participation in meetings of the Board of Directors and advisory Committees. This amount is justified in view of the additional time expenditure and specific responsibilities associated with his role as Chairman of the Board of Directors.
Non-executive directors are not entitled to performance-related variable remuneration. They do not receive any benefits in kind or benefits related to pension plans. For AY 22/23, no proposal has been formulated, subject to approval by the Annual Shareholders’ Meeting, to grant one-time additional compensation to non-executive directors for supplemental work performed by these directors.
Provision 7.6 of the 2020 Code specifies that the non-executive directors must receive part of their remuneration in Company shares. These shares must be held until at least one year after the end of their mandate as director and at least three years after their allocation. Currently, the non-executive members of the Board of Directors do not receive compensation in the form of Greenyard shares, based on the consideration that these directors are already acting and taking decisions with respect to the Company based on a longterm vision. Ownership of Greenyard shares by all the non-executive directors may make alignment and consensus in the Board of Directors more difficult since more conflicts of interest may be involved. Moreover, it cannot be excluded that the independence of the independent directors will be compromised as a result. This independence is considered to contribute to balanced decision-making in the Company’s interest. However, the Nomination and Remuneration Committee continues to monitor the reasons set forth above based on which Greenyard’s deviation from provision 7.6 of the 2020 Code is considered justified, and to assess whether and to what extent the grant of Greenyard shares to non-executive directors as part of their remuneration would be in the Company’s interest.
7.2.2. Remuneration in AY 22/23
The table below lists the individual remunerations paid to each non-executive director with respect to AY 22/23. These amounts were calculated based on six out of a total of nine meetings of the Board of Directors in AY 22/23. The other three meetings were held by videoconference and convened solely for the purpose of a status update or exclusively to make an urgent decision requiring immediate action, for which no attendance fee was granted in accordance with the remuneration policy.
With respect to AY 22/23, attendance fees were granted for five meetings of the Nomination and Remuneration Committee and four meetings of the Audit Committee, out of a total of eight and five meetings, respectively. For the other Committee meetings, which were status updates by videoconference, no attendance fee was granted in accordance with the remuneration policy.
The total annual remuneration paid to the non-executive directors for performing their mandate during AY 22/23 amounts to € 495 617 (excluding VAT). This is in line with the previous AY 21/22 (€ 490 381,82).
/ 205
Individual directors’ remuneration in AY 22/23
(1) Mr. Hein Deprez (permanent representative of Deprez Invest NV) receives a management fee and no additional compensation for exercising his mandate as Managing Executive director on the Board of Directors.
(2) In his capacity as Chairman of the Board of Directors, Mr. Koen Hoffman (permanent representative of Ahok BV) receives a fixed annual remuneration of € 142 500, which includes his attendance fees as director and member of the Nomination and Remuneration Committee as well as any additional fee to be paid to any non-executive and/or independent director(s) for additional work carried out.
(3) The total director’s remuneration of Aalt Dijkhuizen B.V., a company incorporated and having its registered office in the Netherlands, and its permanent representative Mr. Aalt Dijkhuizen, residing in the Netherlands, includes travel expenses of € 617,47 that are made to physically attend Board of Directors’ and Nomination and Remuneration Committee’s meetings organized (at the Company’s registered office) in Belgium.
7.3. Remuneration of the members of the Leadership Team
7.3.1. Introduction
The remuneration of members of the Leadership Team (including Executive Management members) consists of a fixed remuneration and a variable remuneration in the form of a short-term incentive (annual cash bonus) and, in some cases, long-term incentives (stock options).
Short-term incentive
The short-term incentive takes the form of an annual cash bonus which is performance-related and is based on individual performance combined with performance at Group and/or divisional level (depending on the function of the respective Leadership Team member), including financial and corporate objectives which are determined annually.
The variable remuneration in the form of a cash bonus always relates to performance over the previous financial year and is based on both quantitative and qualitative parameters. When meeting the objectives set forward (i.e. performance on target), the variable remuneration of the members of the Leadership Team (excluding the Executive Management members) varies between 25% and 35% of the fixed annual remuneration, depending on the function of the respective Leadership Team member. During AY 22/23, the variable remuneration of the members of the Leadership Team (excluding the Executive Management members) could amount to up to maximum 50% of the fixed annual remuneration in case of outperformance of both financial and personal targets. For the members of the Executive Management, the variable remuneration is equal to 50% of their fixed annual remuneration when the objectives set for the annual bonus are achieved. During AY 22/23, the variable remuneration of the members of the Executive Management could amount to up to maximum 65% of the fixed annual remuneration in case of outperformance of both financial and personal targets. The Annual Shareholders’ Meeting of 16 September 2022 approved a dispensation with the application of article 7:91 BCAC for AY 22/23 (which dispensation also applies to the LTIs insofar applicable).
The Nomination and Remuneration Committee annually evaluates the performance of the Executive Management members against the objectives set. The performance of other members of the Leadership Team is assessed based on the recommendations of the co-CEOs. Upon approval of the amended remuneration policy by the Annual General Meeting on 15 September 2023, the performance of the members of the Executive Management, as well as the other members of the Leadership Team will be evaluated, as of AY 23/24, by the Nomination and Remuneration Committee and will be decided upon by the Board of Directors, on the advice of the Committee. The Committee’s recommendations in this regard will be formulated in consultation with and on reasoned proposals from the co-CEOs.
CONTENTS | CONTENTS FINANCIAL REPORT 206 /
Directors' remuneration Fixed remuneration Board meeting attendance fee Committee meeting attendance fee Expenses Total Deprez Invest NV, rep. by Hein Deprez(1) - - - -Ahok BV, rep. by Koen Hoffman(2) € 142 500 - - - € 142 500 Aalt Dijkhuizen B.V., rep. by Aalt Dijkhuizen(3) € 30 000 € 15 000 € 12 500 € 617 € 58 117 Alro BV, rep. by Gert Bervoets € 16 250 € 5 000 - - € 21 250 Alychlo NV, rep. by Els Degroote € 30 000 € 15 000 € 7 500 - € 52 500 Bonem Beheer BV, rep. by Marc Ooms € 30 000 € 12 500 - - € 42 500 Galuciel BV, rep. by Valentine Deprez € 30 000 € 15 000 - - € 45 000 Gescon BV, rep. by Dirk Van Vlaenderen € 30 000 € 12 500 € 10 000 - € 52 500 Hilde Laga € 13 750 - - - € 13 750 Management Deprez BV, rep. by Veerle Deprez € 30 000 € 15 000 € 22 500 - € 67 500 TOTAL € 352 500 € 90 000 € 52 500 € 617 € 495 617
Long-term incentives
Long-term incentives are paid in the form of stock options granted under:
• the 2019 stock option plan (2019 SOP) which has been approved and ratified on 20 September 2019 by the Annual Shareholders’ Meeting, and
• the 2021 stock option plan (2021 SOP) which is part of the remuneration policy applicable since 1 April 2021.
Under these stock option plans, certain stock options are granted through block awards, free of charge, to selected staff members, including Leadership Team members. Each option grants its owner the right to acquire a Greenyard share under the exercise conditions and against payment of the exercise price.
These long-term incentives are based solely on quantitative parameters. Vesting is conditional on the continued employment with Greenyard at the time of vesting, upon realization of which, the options will be vested and definitively acquired.
With respect to the stock options granted under the 2019 SOP, a vesting period of three years applies. With respect to the stock options granted under the 2021 SOP, a vesting scheme over four years applies, with a predetermined percentage of stock options vesting progressively at the anniversary of the offer date. At the end of this scheme, 100% of the granted stock options are vested, conditional on continued employment. In the vesting scheme the most significant proportion will vest at the end of the four-year period, aligned with the timings set for the achievement of the strategic business objectives in the LRP in force at that time.
When the options are vested, they may be exercised against payment of the exercise price, which equals the average closing price of the Greenyard share for thirty days preceding the grant date, as a result of which an equal number of Greenyard shares will be transferred to the beneficiary (it being understood that one option gives the right to one Greenyard share). However, the stock options that are gradually vested under the 2021 SOP will not be exercisable, irrespective of any vesting, until the end of the four-year vesting scheme.
The options under the 2019 SOP expire after six years after the grant date. Under the 2021 SOP, the options expire after five years after the grant date. Any option which has not been exercised at its expiration date shall become null and void.
The dispensation with the application of article 7:91 BCAC as approved by the Annual Shareholders’ Meeting of 16 September 2022, for AY 22/23, also applies to the long-term incentives.
As a result of the applicable long-term incentive plans within Greenyard, Leadership Team members can build up their shareholdings in Greenyard over time through the opportunity given under these plans to acquire shares. Greenyard deviates from provision 7.9 of the 2020 Code, which recommends that the Board of Directors sets a minimum threshold for the holding of Greenyard shares by the Executive Management and Leadership Team members. Currently, the Board of Directors has not formally set any explicit minimum thresholds for Greenyard shareholdings for Executive Management and Leadership Team members, since it wants to allow a degree of flexibility to the persons concerned. The long-term incentive plans demonstrate that the Company wishes to stimulate the long-term vision of the Executive Management and Leadership Team members by allowing them to participate financially in Greenyard’s growth.
Executive directors
Executive directors, who hold executive positions in the Company or one of its subsidiaries, do not receive any additional compensation for their work on the Board of Directors or its advisory Committees, since this is part of the total remuneration package they receive in their executive function.
The Board of Directors has one executive director, Mr. Hein Deprez (permanent representative of Deprez Invest NV) who received a management fee for AY 22/23 in his capacity as co-CEO.
7.3.2. Annual short-term incentive components and targets for AY 22/23
For AY 22/23, the variable remuneration in the form of an annual cash bonus is based on personal objectives and individual contributions (up to a maximum of 50%) in combination with financial objectives (up to a maximum of 50%) at Group and/or divisional level, depending on the function of the Executive Management and Leadership Team member.
/ 207
The financial objectives for AY 22/23 consist of an adjusted EBITDA component, in combination with, depending on the Leadership Team member’s position, a Net Financial Debt component to be achieved at Group level or a Cash Conversion Cycle component on divisional level.
The personal objectives for AY 22/23 reflect the corporate goals and strategic objectives, including elements of business development and strategic partnerships roll out, as well as transformation and cost savings, but are also related to the efficiency of certain processes and the delivery of certain projects by the member concerned.
The personal objectives set for co-CEO Mr. Marc Zwaaneveld (permanent representative of MZ-B BV) by the Board of Directors for AY 22/23, relate, in general terms, to actions in mitigating the consequences of inflation and other macro-economic or geopolitical circumstances, the continued implementation of Greenyard’s Sustainability Roadmap, and driving innovation in the context of the Strategy 2030. As behavioural competencies particular focus is given to improvement areas and business focus for Greenyard, leadership and development, as well as inclusion and diversity.
The personal objectives set for co-CEO Mr. Hein Deprez (permanent representative of Deprez Invest NV) by the Board of Directors for AY 22/23, relate, in general terms, to the Strategy 2030 roll-out and the continued implementation of Greenyard’s Sustainability Roadmap. As behavioural competencies particular focus is given to building and maintaining long-term commercial relationships.
The evaluation period coincides with AY 22/23, starting on 1 April 2022 and ending on 31 March 2023. In accordance with the remuneration policy, the level of achievement of the objectives by the Executive Management members is reviewed and assessed in the first quarter of the following AY 23/24 by the Nomination and Remuneration Committee, before being discussed and finally determined by the Board of Directors. Decisions on the variable remuneration of the other Leadership Team members are taken by the Executive Management, in line with the currently applicable remuneration policy. The quantitative calculation is carried out based on audited figures.
7.3.3. Remuneration of the co-CEOs in AY 22/23
In their capacity as co-CEOs, (i) Mr. Hein Deprez (permanent representative of Deprez Invest NV) was paid a fixed management fee of € 615 000 and (ii) Mr. Marc Zwaaneveld (permanent representative of MZ-B BV) was paid a fixed management fee of € 768 750, for AY 22/23. This increase compared to AY 21/22 represents an indexation adjustment of their fixed management fee with +2,5% as of 1 April 2022 following a decision of the Board of Directors in AY 21/22, due to exceptional macro-economic circumstances. The difference in the amount of fixed management fee between the co-CEOs can be explained by the fact that Mr. Hein Deprez (permanent representative of Deprez Invest NV) decided to waive an increase of his management fee, which was granted two financial years ago, in AY 20/21, following a decision of the Board of Directors.
Mr. Marc Zwaaneveld (permanent representative of MZ-B BV) received a cash bonus payment of € 377 633 for AY 22/23, based upon the level of achievement of the objectives set for AY 22/23, ranging on or about “on target”. The proportion between the fixed and short-term variable remuneration of Mr. Marc Zwaaneveld is therefore respectively, 67% and 33%. The decision-making process and the relative weight of the key performance as set out in section 7.3.2. were applied in this respect.
Mr. Hein Deprez (permanent representative of Deprez Invest NV) decided to waive the bonus that would have been paid to him in his capacity as co-CEO for AY 22/23. Since he agreed not to be granted stock options under the SOP 2019 and SOP 2021, 100% of his remuneration is fixed remuneration.
CONTENTS | CONTENTS FINANCIAL REPORT 208 / Key Performance Metrics for AY 22/23 Relative Weight Financial objectives 50% Adjusted EBITDA 30% Net Financial Debt 20% Cash Conversion Cycle Personal objectives & Individual contributions 50% Personal objectives 25% Individual performance & behavioural competences 25%
The co-CEOs are entitled to customary fringe benefits. Mr. Hein Deprez (permanent representative of Deprez Invest NV) has a company car, the costs of which amounted in AY 22/23 to € 7 663,98. Mr. Zwaaneveld (permanent representative of MZ-B BV) waived as of AY 21/22 the previously agreed reimbursement for his housing expenses. No pension contributions were made.
In AY 22/23, it was agreed between Mr. Marc Zwaaneveld (permanent representative of MZ-B BV) and the Company that the stock options, granted to Mr. Marc Zwaaneveld under the 2021 SOP, which vested on 31 March 2022, in deviation from its terms and conditions and section 4.3 of the remuneration policy2, will be exercisable as of 30 April 2024, in order to align the exercise date with the date until he will continue as co-CEO of Greenyard, as announced on 1 September 2022.
For purposes of valuing these vested stock options, the difference between the value of the underlying shares at the market price, being the closing price of the Greenyard share on the relevant vesting date, and the value of the underlying shares at the exercise price as indicated in the table on the stock option plans (see below), is to be considered. The theoretical value with respect to 2019 SOP and 2021 SOP equals respectively, € 2 071 800 and € 335 400. However, this concerns a theoretical valuation given the exercise period which applies and given that on the date of publication of this Financial Report, no stock options were exercised by Mr. Marc Zwaaneveld. Taking into account such theoretical valuation, the proportion between the fixed and short- and long-term variable remuneration is respectively, 22% and 78%.
7.3.4. Remuneration of the other members of the Leadership Team in AY 22/23
For AY 22/23, the total annual remuneration paid to the other members of the Leadership Team (excluding the co-CEOs) was € 3 220 796. All remuneration is paid on a pro-rata basis according to the length of the term of office of the members of the Leadership Team. For the members who are employees, defined contributions were made within the framework of pension schemes and gross amounts have been taken into account.
For AY 22/23, the short-term variable remuneration granted to the members of the Leadership Team other than the co-CEOs amounted to € 852 243. This amount results from the level of achievement of the financial objectives on Group level (adjusted EBITDA and Net Financial Debt) or divisional level (adjusted EBITDA and Cash Conversion Cycle), depending on the position of the Leadership Team member, as well as personal objectives and individual contributions, ranging on or about “on target” by the other Leadership Team members. The decision-making process and the relative weight of the key performance metrics as set out in section 7.3.2. (see above) were applied in this respect.
(1) The one-year variable remuneration consists of the short-term bonus awarded in respect of AY 22/23 and paid at the beginning of AY 23/24.
For purposes of valuing the vested stock options which were granted to the other Leadership Team members under the 2019 and 2021 SOP, as indicated in the table on the stock option plans (see below), the difference between the value of the underlying shares at the market price, being the closing price of the Greenyard share on the relevant vesting date, and the value of the underlying shares at the exercise price under the applicable SOP, is to be considered. The theoretical value with respect to 2019 SOP and 2021 SOP equals respectively, € 1 841 600 and € 96 320. However, this concerns a theoretical valuation given the exercise period which applies under the 2021 SOP and given that on the date of publication of this Financial Report, only a limited number of stock options that vested under the 2019 SOP have been exercised by the other Leadership Team members (see below). In this respect, reference is made to the managers’ transactions notified to the FSMA. Taking into account such theoretical valuation, the proportion between the fixed and short- and long-term variable remuneration is respectively, 46% and 54%. Excluding such vested stock options, the proportion between the fixed and short-term variable remuneration is respectively, 74% and 26%.
/ 209
AY 22/23 AY 21/22 Fixed remuneration € 2 368 553 € 2 412 491 Base Salary € 2 307 609 € 2 361 689 Benefits in kind & Pensions € 60 944 € 50 802 One-year variable remuneration € 852 243(1) € 847 782 TOTAL € 3 220 796 € 3 260 273
2 Section 4.3 of the remuneration policy relating to the long-term incentive remuneration of the Leadership Team members (including the Executive Management members).
Stock Option Plans (applicable as from AY 19/20)
Stock options granted to, held by, and exercised by the members of the Leadership Team in AY 22/23(1) Main conditions of the share option plan
(1) The applicable 2019 SOP and 2021 SOP do not contain any additional retention provision following exercise.
(2) Not yet working for Greenyard on the grant date.
(3) The stock options granted to Mr. Francis Kint under the 2021 SOP have been granted on 27 May 2021, when he joined Greenyard.
(4) No member of the Leadership Team on the grant date.
(5) In AY 22/23, no stock options were granted to Leadership Team members, and no stock options granted to Leadership Team members were annulled.
7.4. Evolution of the remuneration and pay-gap information
The below table contains information on the annual evolution of (i) the remuneration of the non-executive directors, the co-CEOs, and the members of the Leadership Team (including the CFO), (ii) the performance of the Company and (iii) the average remuneration on a full-time equivalent basis of employees of the Company (other than the persons under item (i)), over the five most recent financial years, including AY 22/23.
CONTENTS | CONTENTS FINANCIAL REPORT 210 /
Information regarding
Beneficiary Plan Grant date Vesting Date Exercise period Exercise Price Share options vested Share options exercised Total outstanding unvested share options Total outstanding vested share options Marc Zwaaneveld 2019 SOP 15/03/2019 31/03/2022 01/04/2022 - 31/03/2025 € 3,436 - - - 450 000 2021 SOP 19/02/2021 19/02/2022 (10%) 31/03/2022 (90%) 30/04/2024 - 18/02/2026 € 6,450 - - - 200 000 Geert Peeters 2019 SOP 15/03/2019 31/03/2022 01/04/2022 - 31/03/2025 € 3,436 - 9 014 - 240 986 2021 SOP 19/02/2021 19/02/2022 (15%) 19/02/2023 (50%) 19/02/2024 (35%) 20/02/2024 - 18/02/2025 € 6,450 50 000 - 35 000 65 000 Alexander Verbist 2019 SOP 15/03/2019 31/03/2022 01/04/2022 - 31/03/2025 € 3,436 - 50 000 -2021 SOP 19/02/2021 19/02/2022 (10%) 19/02/2023 (15%) 19/02/2024 (25%) 19/02/2025 (50%) 20/02/2025 - 18/02/2026 € 6,450 9 000 - 45 000 15 000 Charles-Henri Deprez 2019 SOP 15/03/2019 31/03/2022 01/04/2022 - 31/03/2025 € 3,436 - - - 50 000 2021 SOP 19/02/2021 19/02/2022 (10%) 19/02/2023 (15%) 19/02/2024 (25%) 19/02/2025 (50%) 20/02/2025 - 18/02/2026 € 6,450 9 000 - 45 000 15 000 Francis Kint 2019 SOP(2) - - - - - - -2021 SOP(3) 27/05/2021 27/05/2022 (10%) 27/05/2023 (15%) 27/05/2024 (25%) 27/05/2025 (50%) 28/05/2025 - 26/05/2026 € 8,540 6 000 - 54 000 6 000 Maarten van Hamburg 2019 SOP(4) - - - - - - -2021 SOP 19/02/2021 19/02/2022 (10%) 19/02/2023 (15%) 19/02/2024 (25%) 19/02/2025 (50%) 20/02/2025 - 18/02/2026 € 6,450 9 000 - 45 000 15 000 Yannick Peeters 2019 SOP 15/03/2019 31/03/2022 01/04/2022 - 31/03/2025 € 3,436 - 40 000 - 10 000 2021 SOP 19/02/2021 19/02/2022 (10%) 19/02/2023 (15%) 19/02/2024 (25%) 19/02/2025 (50%) 20/02/2025 - 18/02/2026 € 6,450 9 000 - 45 000 15 000
AY 22/23(5)
(1) Average remuneration of Board members for a given financial year based on the total remuneration paid to non-executive directors on Greenyard’s Board of Directors in the relevant year.
(2) Mr. Marc Zwaaneveld (permanent representative of MZ-B BV) has been co-CEO, alongside Mr. Hein Deprez (permanent representative of Deprez Invest NV), since 9 February 2019.
(3) No bonus was paid out for AY 18/19.
(4) Mr. Marc Zwaaneveld (permanent representative of MZ-B BV) received an exceptional bonus of € 600 000, paid in two installments, for the achievement of specific personal objectives for AY 19/20 linked to certain milestones under the Transformation Plan implemented in view of Greenyard’s further deleveraging. Mr. Hein Deprez (permanent representative of Deprez Invest NV) decided to waive the bonus that would have been paid to him in his capacity as co-CEO for AY 19/20 to contribute to the accelerated recovery of Greenyard.
(5) and (6) The total remuneration of Mr. Marc Zwaaneveld (permanent representative of MZ-B BV) for respectively, AY 21/22 and AY 22/23 does not take into account his stock options under the applicable 2019 SOP and 2021 SOP that have already vested, in order to allow for a comparison on a likefor-like basis with previous financial years. If these stock options are included, it is based on their theoretical valuation (see above), since none of his stock options under the 2019 SOP and the 2021 SOP have been exercised at the date of publication of the Financial Report (including the fact that the stock options under the SOP 2021 are not yet exercisable):
- the amount for AY 21/22 would be € 3 589 234, representing an annual change vs. AY 20/21 of +190%.
- the amount for AY 22/23 would be € 3 553 583, representing an annual change vs. AY 21/22 of -0,1%.
(7) and (8) The total remuneration of the other members of the Leadership Team for respectively, AY 21/22 and AY 22/23 does not take into account their stock options under the applicable 2019 SOP and 2021 SOP that have already vested, in order to allow for a comparison on a like-for-like basis with previous financial years. If these stock options are included, it is based on their theoretical valuation (see above), since, at the date of publication of the Financial Report, only a limited number of the stock options under the SOP 2019 have been exercised and the stock options under the SOP 2021 that have already vested are not yet exercisable:
- the amount for AY 21/22 would be € 5 197 813, representing an annual change vs. AY 20/21 of +45,5%.
- the amount for AY 22/23 would be € 5 158 716, representing an annual change vs. AY 21/22 of -0,8%.
(9) CDP scores for climate change and water security, A-F (A = topmark), last updated on 13 December 2022.
(10) The average remuneration (on a FTE basis) of the employees of Greenyard NV is calculated on a Belgian GAAP basis (the sum of line items 620 and 622 of the statutory annual accounts divided by the number of FTE of Greenyard NV set forth in line item 1003 in the social balance annex).
(11) New personnel members were hired, however, given that in AY 21/22 senior personnel left Greenyard the average remuneration did not increase exponentially vs. AY 20/21.
(12) As a result of the automatic indexation applied in Belgium in AY 22/23 for certain sectors, the average remuneration of Greenyard NV personnel members increased in that financial year.
(13) As of AY 20/21 these figures are reported post-IFRS 16.
/ 211 Total remuneration of the members of the Board of Directors Annual change on average remuneration(1) AY 18/19 AY 19/20 vs. AY 18/19 AY 19/20 AY 20/21 vs. AY 19/20 AY 20/21 AY21/22 vs. AY 20/21 AY 21/22 AY 22/23 vs. AY 21/22 AY 22/23 Board of Directors (excl. executive director(s)) € 622 500 -4,0% € 538 032 -10,4% € 482 000 1,7% € 490 382 1,1% € 495 617 Total remuneration of the members of the Leadership Team Annual change AY 18/19(3) AY 19/20 vs. AY 18/19 AY 19/20(4) AY 20/21 vs. AY 19/20 AY 20/21 AY21/22 vs. AY 20/21 AY 21/22 AY 22/23 vs. AY 21/22 AY 22/23 CEO I Deprez Invest NV (represented by Hein Deprez) € 750 000 -20,0% € 600 000 0,0% € 600 000 0,0% € 600 000 2,5% € 615 000 CEO I MZ-B BV (represented by Marc Zwaaneveld) N/A(2) € 1 435 500 -13,8% € 1 237 500 -4,5% €1 182 034(5) -3,0% € 1 146 383(6) Other members € 2 512 000 32,7% € 3 333 000 7,2% € 3 572 758 -9,0% € 3 260 273(7) -1,2% € 3 220 796(8) Greenyard Group performance Annual change 2019 AY 19/20 vs. AY 18/19 2020 AY 20/21 vs. AY 19/20 2021 AY21/22 vs. AY 20/21 2022 AY 22/23 vs. AY 21/22 2023 Adjusted EBITDA(13) 48,4% 64,0% 6,1% 0,5% Sales (reported) 3,8% 8,7% -0,3% 6,6% ESG rating - CDP(9) Climate change F B- B- BWater security F B- B BAverage remuneration
Annual change AY 19/20 vs. AY 18/19 AY 20/21 vs. AY 19/20 AY21/22 vs. AY 20/21(11) AY 22/23 vs. AY 21/22(12) Employees of Greenyard NV(10) 8% -7% -10% 4%
on a FTE basis of employees
For AY 22/23, the pay gap between the remuneration of the highest paid member of the Leadership Team and the lowest paid employee of Greenyard corresponded to a ratio of 21,37:1 (excluding the vested stock options, which represents a decrease vs. AY 21/22 (21,81:1)) respectively 66,24:1 (including the vested stock options based on a theoretical valuation (see above)).
7.5. Severance pay for members of the Leadership Team
In accordance with article 7:92 BCAC, the agreements concluded with the members of the Leadership Team provide for severance pay not exceeding twelve months’ remuneration. More specifically, the agreements concluded with the members of the Executive Management provide for severance pay of twelve months’ remuneration. For the other members of the Leadership Team, the severance pay is in principle equal to six months’ remuneration or, if the member is an employee, this is calculated in accordance with the applicable legal provisions under the employment contract.
In the event of early termination, the Board of Directors justifies and decides, on the recommendation of the Nomination and Remuneration Committee, whether the Leadership Team member concerned qualifies for severance pay, and the basis on which it is calculated.
Since there were no changes in the composition of the Leadership Team (including the Executive Management) during AY 22/23, no severance pay has been paid to Leadership Team members (including Executive Management members) in AY 22/23.
7.6. Claw-back
Greenyard implemented during previous AY 21/22 a claw-back mechanism for the members of the Executive Management and Leadership Team, applicable as of 1 April 2022, which enables Greenyard in certain cases of criminal offence or breach of Greenyard’s Code of Conduct to require a member to repay to the Company variable remuneration that has already been paid out. Long-term incentive plans within Greenyard provide for a ‘bad leaver’ clause stipulating that, in certain cases (such as termination for cause), the holder or beneficiary concerned loses the stock options previously granted, which will be automatically annulled and will no longer vest, with no compensation of any kind being due from the Company.
Under the 2019 SOP and 2021 SOP, the stock options will in such cases be lost, regardless of whether they have already vested. The Company considers such a ‘bad leaver’ clause being equivalent to a claw-back clause.
During AY 22/23, no claw-back and no ‘bad leaver’ clause were exercised.
7.7. Information on shareholder vote
The Annual Shareholders’ Meeting of 16 September 2022 approved the remuneration report with respect to AY 21/22 with a majority of 97,30% shareholder votes in favor. Greenyard is committed to enduring engagement with all its stakeholders and will always actively consider their feedback to shape its remuneration practices.
7.8. Deviations from the Remuneration Policy
Greenyard’s Remuneration Policy sets out that in exceptional circumstances, to be assessed on a case-by-case basis, and only if this serves the long-term interests and sustainability of Greenyard or guarantees its viability, the Board of Directors may, subject to a reasoned recommendation by the Nomination and Remuneration Committee, allow certain deviations from the applicable Remuneration Policy.
During AY 22/23, the Board of Directors decided to deviate from the Remuneration Policy, upon substantiated advice of the Nomination and Remuneration Committee, on one occasion, which is described in more detail in the relevant section 7.3.3. (see above) of this Remuneration Report.
CONTENTS | CONTENTS FINANCIAL REPORT 212 /
8. Additional information
This section contains information not included in other parts of this Report and is required to be disclosed in accordance with article 3:6 (§1) and (§2), 4° and 7° BCAC3
Shareholders’ and capital structure
Reference is made to the section Information for Shareholders of the Financial Report.
Special rights of control
No special rights of control are granted to shareholders of Greenyard.
Restrictions on transfers of shares
The transfer of Greenyard shares is not subject to any legal or statutory restrictions.
System of control of any employee share scheme where the control rights are not exercised directly by the employees
No employee shareholding system has been put in place.
Limitations by law or the articles of association on the exercise of voting rights
Article 8 of the Company’s articles of association states that if a shareholder fails to pay a call on his shares within the time set by the Board of Directors, exercise of the voting rights attaching to the relevant shares is suspended ipso jure until such time as the call is satisfied. On 31 March 2023, the capital was fully paid up.
In accordance with article 10 of the Company’s articles of association, the Board of Directors may suspend exercise of the rights attaching to a share if the rights attaching thereto are divided among several persons until such time as a single person is designated as the shareholder vis-à-vis the Company.
Rules on amendments to the articles of association
Pursuant to article 7:153 BCAC, any amendment to the Company’s articles of association may only be authorised with the approval of at least 75% of the votes validly cast at an Extraordinary Shareholders’ Meeting where at least 50% of the Company’s share capital is present or represented. Abstentions shall not be included in the numerator or denominator for the purpose of calculating votes. If the attendance quorum of 50% is not met, a new Extraordinary Shareholders’ Meeting must be convened at which the shareholders may decide on the agenda items, irrespective of the percentage of share capital present or represented at such meeting.
Rules on appointment and replacement of directors
The directors are appointed by the Shareholders’ Meeting, without prejudice to the possibility for the Board of Directors to temporarily fill an early vacancy as provided for in article 16 of the Company’s articles of association. The Chairman of the Nomination and Remuneration Committee will coordinate the appointment procedure. The Nomination and Remuneration Committee will recommend suitable candidates to the Board of Directors. Consequently, the Board of Directors makes a proposal to the Shareholders’ Meeting for the appointment as director. The Nomination and Remuneration Committee determines the requirements regarding the independency, the competency, and the other qualifications of the members of the Board of Directors. After consultation with the Chairman of the Board of Directors, the Nomination and Remuneration Committee takes all initiatives necessary in view of the best composition of the Board of Directors.
Before each new appointment, an assessment of the skills, the know-how, and experience already available and required at the level of the Board of Directors will be executed. This assessment is carried out on the basis of, among other things, a competence matrix proposed by the Nomination and Remuneration Committee, where appropriate in consultation with the Chairman of the Board of Directors, showing the competences, areas of knowledge and types of expertise present on the Board of Directors. The Nomination and Remuneration Committee is tasked with determining, on this basis, the required profile for a vacant position of director with a
/ 213
3 Respectively referring to
34 of
Decree of 14
2 May 2007.
article
the Royal
November 2007 and article 14 of the Act of
particular focus on promoting diversity in and complementarity of skills, experience, knowledge, education, and professional background in the composition of the Board of Directors (and its advisory Committees), in compliance with, among other things, the legal requirements in terms of gender diversity (article 7:86 BCAC). All this on top of focusing on the expertise and professional integrity required for the performance of their duties.
When appointing a new director, the Chairman of the Nomination and Remuneration Committee ascertains that the Board of Directors, prior to taking into consideration the candidate, has sufficient information on the candidate, such as a curriculum vitae, the assessment based on a first interview, a list of mandates the candidates already holds and, if required, the information necessary to assess the independency of the director.
After consultation with and upon recommendation of the Nomination and Remuneration Committee, the Board of Directors will determine the profile of each new independent director, taking into account the applicable requirements of independence set out in provision 3.5 of the 2020 Code. The Nomination and Remuneration Committee will initiate the search for suitable candidates for each vacant position as independent director and can engage an external consultant to assist with the selection procedure.
The Nomination and Remuneration Committee will propose candidates to the Board of Directors for each vacant position as independent director. The proposal of the Nomination and Remuneration Committee to the Board of Directors will at least include the following information: (i) an overview of all persons contacted and all candidatures received, (ii) a detailed curriculum vitae of the candidate who the Nomination and Remuneration Committee proposes to appoint as independent director, (iii) a detailed written advice of the Nomination and Remuneration Committee in respect with the concerned candidate, including the proposed remuneration, and (iv) any relevant report on the matter submitted by an external consultant (if appointed) to the Nomination and Remuneration Committee.
The decision of the Board of Directors to propose a candidate independent director for nomination to the Shareholders’ Meeting requires a special two-third majority of the votes.
The proposal for appointment of an (independent) director submitted to the next Shareholders’ Meeting will be accompanied by a recommendation of the Board of Directors and by the professional biography of the candidate director, including a list of the mandates already held by the candidate director in listed and unlisted companies, as well as, where applicable, whether the candidate director meets the independence criteria set out in provision 3.5 of the 2020 Code.
The above procedure also applies in the case of reappointment of an (independent) director.
If an (independent) director applies for reappointment, the Nomination and Remuneration Committee will, within the framework of the aforementioned appointment procedure, advise the Board of Directors in particular on the appropriateness of the reappointment, taking into account (among other things) the qualitative criteria set out in section 1.1. of this Corporate Governance Statement (see above).
The members of the Nomination and Remuneration Committee who apply for reappointment may not participate in the discussion and deliberation in the Nomination and Remuneration Committee concerning the recommendation to the Board of Directors on the appropriateness of their reappointment.
The Company’s articles of association provide that the directors are appointed for a maximum term of six years. The Board of Directors will propose to the Shareholders’ Meeting to appoint directors only for a duration of four years. The mandate expires at the end of the Annual Shareholders’ Meeting which was determined as the end date of the appointment. However, as long as the Shareholders’ Meeting does not fill the vacancy for whatever reason, the directors whose mandate has expired will remain in office. Retiring directors are eligible for reappointment. If a retiring director applies for reappointment as an (independent) director, the Nomination and Remuneration Committee will, in its recommendation to the Board of Directors within the framework of the appointment procedure set out above, advise the Board of Directors in particular on the appropriateness of the reappointment, taking into consideration (among other things) certain qualitative criteria of the relevant candidate as a director of the Company as set out in section 1.1. of this Corporate Governance Statement (see above).
The mandate of the directors may be revoked at any time by simple majority in the Shareholders’ Meeting.
The Chairman of the Board of Directors ensures the orderly and timely succession of directors with a view to the continuity of the Board of Directors.
CONTENTS | CONTENTS FINANCIAL REPORT 214 /
Authority of the Board of Directors to issue or purchase own shares
In accordance with article 12 of the Company’s articles of association, the Board of Directors is authorized, during a five-year period counting from the date of the Extraordinary Shareholders’ Meeting of 17 September 2021, and within the limits determined by law, whether on or outside of the stock exchange, directly or indirectly, to acquire by way of purchase or exchange, contribution or any other way of acquisition, the maximum number of Company’s shares permitted by law, without requiring further Shareholders’ Meetings’ approval or resolution, at a price or a consideration per share not higher than 20% above the highest closing price of the share on Euronext Brussels during the last 20 trading days preceding the acquisition, with a minimum of € 1 per share. The Board of Directors is also authorized to dispose of the acquired shares on or outside of the stock exchange by way of sale, exchange, contribution, conversion of bonds or any other way of transfer, to offer these shares to the personnel, to otherwise dispose of or cancel these shares, without requiring further Shareholders’ Meetings’ approval or resolution and without limitation in time. These authorizations also apply for any acquisitions and disposals of Company’s shares, directly or indirectly, by direct subsidiaries of the Company in accordance with article 7:221 BCAC.
In addition, the Board of Directors is authorized during a three-year period counting from the publication of the authorization in the annexes of the Belgian Official Gazette (i.e. on 4 October 2021), whether on or outside of the stock exchange, directly or indirectly, to acquire (by way of purchase or exchange, contribution or any other way of acquisition) or to dispose of (by way of sale, exchange, contribution, conversion of bonds or any other way of transfer) Company’s shares, if such acquisition or disposal is necessary to prevent an imminent serious disadvantage to the Company. This authorization also applies for the acquisition or disposal of Company’s shares, directly or indirectly, by direct subsidiaries of the Company in accordance with article 7:221 BCAC.
Shareholders’ agreements that are known to the issuer and that could give rise to share transfer restrictions and/or limitations to the exercise of the voting rights
The Board of Directors has no knowledge of the existence during AY 22/23 of any shareholders’ agreements that could give rise to restrictions on the transfer of shares and/or the exercise of voting rights, with the exception of an arrangement concluded between Deprez Holding NV and Food Invest International NV (being holding companies controlled by the Deprez family), on the one hand, and, Agri Investment Fund BV, on the other hand, providing for a lock-up period of three months and a call option of one year, effective from 9 September 2022, on the Greenyard shares held by Agri Investment Fund BV, as notified to the Company in accordance with the Act of 2 May 2007.
Material agreements containing change of control clauses
The following financing agreements entered into by the Company and certain of its subsidiaries contain a change of control provision, that has been approved by or will be submitted for approval to the Annual Shareholders’ Meeting in accordance with article 7:151 BCAC:
• The Multi-Country Factoring Syndication Agreement originally dated 1 March 2016, as amended and/or restated from time to time and most recently on 31 January 2022, between the Company, Greenyard Fresh NV, Greenyard Prepared UK Ltd. and certain other subsidiaries of the Company jointly referred to as the Clients, of the one part, and ING Commercial Finance Belux NV as the Agent, BNP Paribas Fortis Factor NV, KBC Commercial Finance NV and Belfius Commercial Finance NV as the Factors, of the other part; and
• The Senior Facilities Agreement dated 22 September 2022 between, among others, Greenyard and certain of its subsidiaries named therein as original borrowers and/or original guarantors, KBC Bank NV, ABN AMRO Bank NV and Coöperatieve Rabobank U.A. as arrangers, the financial institutions named therein as original lenders and KBC Bank NV as agent and security agent;
• The Intercreditor Agreement dated 22 September 2022 between, among others, KBC Bank NV as senior agent and security agent, the financial institutions listed therein as senior lenders, KBC Bank NV, ABN AMRO Bank NV and Coöperatieve Rabobank U.A. as senior arrangers, Greenyard as company, the companies listed therein as intra-group lenders and certain of Greenyard’s subsidiaries as original debtors
Any agreements between the issuer and its directors or employees providing for compensation in the case of a takeover bid
The Company has not concluded an agreement with its directors or employees that would allow the disbursement of any special severance pay in the case of termination of employment as a result of a public takeover bid.
/ 215
9. Internal control and risk management
9.1. Risk management
The Board of Directors is responsible for monitoring the risks that are specific to the Group and for the evaluation of the effectiveness of the internal control system.
The Board of Directors has approved an internal control system based on the Committee of Sponsoring Organisations of the Treadway Commission (COSO) model. The following pillars are outlined below: control environment, risk management systems and internal control, financial reporting and communication, and, to conclude, oversight and monitoring.
The Executive Management has implemented a variety of controls to manage the risks that could undermine the achievement of the strategic objectives.
9.1.1. Risk Identification
Responsibility for identifying and evaluating financial, operational, and compliance risks is delegated to the Executive Management, who reports back to the Audit Committee. As required, the Audit Committee meets annually to review the relevant findings, identify strategic risks, and make recommendations to the Board of Directors.
9.1.2. Risk appetite
The Board of Directors believes that the risk management processes in place facilitate informed decision-making at both operational and Board levels. Reviews of the principal risks, including those threatening the business model, future performance, solvency, or liquidity, are evaluated.
9.1.3. Risk assurance
There are various complementary structures in place, supporting the Board of Directors, that provide assurance regarding the risk mitigations and controls in place. These include the Audit Committee, external and internal audit, and Executive Management.
9.2. Control environment
9.2.1. General
The Group performs a conscious risk management based on the implementation of an internal control system and achieved by encouraging a company culture in which all personnel are empowered to fulfil their roles and responsibilities in accordance with the highest standards of integrity and professionalism.
9.2.2. Audit Committee
Without prejudice to the responsibilities of the Board of Directors as a whole, the Audit Committee monitors the efficiency of the internal control and risk management systems set up by the Executive Management, with the aim of ensuring that the main risks (including the ones relating to the non-compliance with law and regulations), are adequately identified, managed and notified, in accordance with the framework approved by the Board of Directors.
At least once a year the Audit Committee meets the statutory auditor to consult with them about matters relating to the audit plan and all matters resulting from the audit process, including any (potential) areas of concern revealed by the audit. These matters are discussed at least once a year in the Audit Committee in the presence of the internal audit department.
In addition, the Executive Management gives relevant updates to the Audit Committee on pending disputes. In that respect, a quantified risk assessment and classification is carried out.
9.2.3. Internal audit
The Group has a professional internal audit department. The Audit Committee reviews the internal audit’s risk assessment, the internal audit charter, and the annual internal audit plan and regularly receives internal audit reports for review and discussion. The mission of
CONTENTS | CONTENTS FINANCIAL REPORT 216 /
the internal audit department is to provide independent, objective quality assurance and support, designed to add value and improve the Group's operations and systems of internal controls.
The internal audit department assists the Group with accomplishing its objectives by bringing a systematic, disciplined approach to evaluate and improve the effectiveness of risk management, control, and governance processes. Internal control deficiencies identified by internal audit are communicated in a timely manner to the Executive Management and periodic follow-up is performed to ensure corrective action has been taken.
9.3. Risk management systems and internal control
The most important aspects of the risk management and internal control process can be summarised as follows:
• The risk position of the Company, the possible financial impact and the required action points are evaluated regularly by the Executive Management and the Board of Directors, advised by the Audit Committee. Based on this assessment, risks are prioritized, and appropriate action plans are implemented;
• The Board of Directors discusses the strategy and investment projects. An evaluation is also made of the associated risks and where needed, appropriate measures to be taken;
• The findings of internal audit reports are extensively discussed with local management and a summary of these reports is regularly presented to the Audit Committee.
For an overview of the principal risks and the associated control activities, please see note 6.18. Risk management policy
9.4. Financial reporting and communication
The financial reporting and communication process of the Group can be summarised as follows:
A closing plan with a checklist is drawn up with the tasks that must be accomplished by the quarterly, semi-annually and year-end closing of the Company and its subsidiaries. The financial department provides the accounting figures under the supervision of the chief accountant or financial director of each subsidiary. The controllers verify the validity of those figures and issue a report. Both coherence testing by making comparisons with historical or budgetary figures and transaction controls using random samples are performed. As part of the closing process, an extensive reporting set with financial and operational data must also be provided in each case.
The Audit Committee assists the Board of Directors with the supervision of the integrity of the financial information delivered by Greenyard. More in particular, it supervises the relevancy and the consistency of the accounting standards applied within the Group, including the criteria for consolidation of the financial accounts of the companies of the Group. This supervision covers the periodic information prior to its publication and is based on the audit program used by the Audit Committee. The Executive Management informs the Audit Committee about the methods used for registering significant and unusual transactions of which the accounting treatment could be open to a variety of interpretations. The Audit Committee discusses the financial reporting methods with both the Executive Management or the Chief Financial Officer, and the external auditor.
9.5. Oversight and monitoring
Oversight of internal controls is exercised by the Board of Directors, which is supported by the Audit Committee and the internal audit department.
The external auditor carries out an annual evaluation of the internal controls related to the risk associated with the financial statements of the Group. In that regard, the external auditor makes recommendations concerning the internal control and risk management systems when appropriate, which are formalized in a management letter that is already issued. The Executive Management undertakes actions to handle the findings and thereby achieve an even better control environment. Those measures are followed up and the Audit Committee is monitoring if the recommendations presented by the external auditor are fulfilled and followed up.
10. Sustainability and Research & Development
Reference is made to the Sustainability Report: “The Greenyard approach: improving life with our sustainability strategy & reporting” (see above).
/ 217
Information for shareholders
1. Shares
The Company’s shares are listed on the continuous market of Euronext Brussels (ticker: GREEN), more specifically in the compartment B (mid-caps) of this market, since 1 March 2005. The Greenyard share was introduced to the Brussels Stock Exchange in June 1999. Greenyard NV has a liquidity contract with ABN AMRO Bank. As per 31 March 2023, the Company holds 1 843 840 treasury shares.
2. Share trading evolution
The average daily trading volume in AY 22/23 was 17 325 shares, compared with 36 032 shares the year before, or a -51,9% decrease. Due to a decreasing liquidity, related to a risk-averse investor sentiment in a volatile equity market (Ukranian conflict, inflationary macro-economic circumstances, … ), total turnover has decreased from
CONTENTS | CONTENTS FINANCIAL REPORT 218 /
AY 22/23 Date AY 21/22 Date Highest price € 9,20 04/08/2022 € 10,48 16/6/2021 Lowest Price € 5,94 14/12/2022 € 7,20 3/7/2022 Opening Price € 8,15 05/04/2022 € 8,44 8/4/2021 Closing Price € 6,38 31/03/2023 € 8,04 31/3/2022 Average daily trading volume 17 325 36 032 Turnover € 33 176 429 € 84 070 101 Total number of shares (incl. treasury shares) 51 515 443 51 515 443 Market capitalisation € 328 668 526 € 414 184 162
€ 84 070
€ 33 176 429. 0 20.000 40.000 60.000 80.000 100.000 120.000 140.000 160.000 180.000 200.000 € 5,00 € 5,50 € 6,00 € 6,50 € 7,00 € 7,50 € 8,00 € 8,50 € 9,00 € 9,50 1/04/2022 1/06/2022 1/08/2022 1/10/2022 1/12/2022 1/02/2023 Volume Share Price
101 to
3. Capital structure
Authorised capital
In accordance with article 7 of the Company’s articles of association, the Board of Directors is authorised to increase the capital of the Company in one or more instalments by an amount equal to the share capital amounting to € 293 851 765. This authorisation is valid for a period of five years as from 17 October 2019, the date the resolutions of the Extraordinary Shareholders’ Meeting of 20 September 2019 were published in the Belgian Official State Gazette. This authorisation to the Board of Directors is renewable. Pursuant to this authorisation, the Board of Directors is authorised to increase the share capital by means of a contribution in cash or in kind within the limits set forth by the BCAC, by conversion of reserves into share capital, whether or not available or unavailable for distribution, with or without the issuance of new shares. The Board of Directors may also use this authorisation for the issuance of convertible bonds, subscription rights, bonds which other securities are attached to, and other securities. In addition, the Board of Directors is authorised, when it increases the share capital or issues convertible bonds, subscription rights, bonds which other securities are attached to, or other securities, to limit or exclude the preferential subscription right, also for the benefit of one or more specific persons, other than members of the personnel. If an issue premium is paid as a result of a capital increase decided upon within the framework of the authorised capital, it will automatically be booked to the ‘issue premiums’ account, which will constitute a guarantee for third parties to the same extent as the share capital and which, subject to the possibility of converting this reserve into share capital, can only be reduced or written off by a new decision of an Extraordinary Shareholders’ Meeting taken in accordance with the conditions for amending articles of association.
In addition, the Board of Directors is expressly authorised to increase the share capital in one or more instalments after the Company has received a notification from the FSMA that it has been notified of a public takeover bid on the Company’s securities by means of a contribution in kind or in cash with the cancellation or exclusion of the preferential subscription right of the shareholders, and/or by the issue of voting securities, whether or not representing the share capital, or securities giving the right to subscribe to or acquire such securities, even if such securities or rights are not offered to the shareholders in preference to others in proportion to the share capital represented by their shares, under the conditions provided for in the BCAC. This authorisation is granted for a period of three years as from the date of the resolutions of the Extraordinary Shareholders’ Meeting of 20 September 2019.
On 26 March 2021, the Board of Directors increased the share capital by € 50,0m within the framework of the authorized capital, through the issuance of 7 142 858 shares, which were fully paid up. Transaction costs of € 0,7m were recorded as a reduction in share capital.
As a result of the Board of Directors’ decision of 26 March 2021, the amount remaining available for a capital increase within the framework of the authorized capital is equal to € 243 851 759.
Acquisition of own shares
In accordance with article 12 of the Company’s articles of association, the Board of Directors is authorized, during a five-year period counting from the date of the Extraordinary Shareholders’ Meeting of 17 September 2021, and within the limits determined by law, whether on or outside of the stock exchange, directly or indirectly, to acquire by way of purchase or exchange, contribution or any other way of acquisition, the maximum number of Company’s shares permitted by law, without requiring further Shareholders’ Meetings’ approval or resolution, at a price or a consideration per share not higher than 20% above the highest closing price of the share on Euronext Brussels during the last 20 trading days preceding the acquisition, with a minimum of € 1 per share.
Share buyback programme
On 14 March 2017, the Board of Directors approved, within the authority granted by the Shareholders’ Meeting, the launch of a share buyback programme of up to 1 750 000 shares. The programme is designed to mitigate the potential dilution from the convertible bond and to create a pool of own shares to finance potential future acquisitions and/or long- term incentive plans. By the end of August 2017, the Company had repurchased all 1 750 000 shares or almost 3,94% of the total number of Company’s shares. The total consideration amounted to € 30,0m or € 17,17 per share.
On 28 August 2021, the Board of Directors approved, within the authority granted by the Shareholders’ Meeting, the launch of a second share buyback programme of 600 000 shares. The programme was designed to create a pool of assets for long-term incentive plans only. By January 2022, the Company had repurchased all 600 000 shares or 1,16% of the total number of Company’s shares. The total consideration amounted to € 5,5m or €9,08 per share.
As of 31 March 2023, Greenyard holds 1 843 840 treasury shares, representing 3,6% of the total number of Company’s shares.
/ 219
4. Shareholder structure
Every shareholder exceeding or falling below the statutory notification threshold of 3,0%, 5,0%, 7,5% and 10% of the total voting rights or any multiple of 5% is required to comply with the Act of 2 May 2007 on the disclosure of major shareholdings in issuers whose shares are admitted to trading on a regulated market. The shareholders concerned are required to send a notification to the Financial Services and Market Authority (FSMA) and to the Company.
Pursuant to the capital increase of 26 March 2021 for a total amount of € 50 000 006, the new total number of shares is 51
An actual overview of the shareholder structure can be consulted on our website www.greenyard.group under the heading Investor relations > Share Information.
5. Major changes in shareholder structure
During AY 22/23, Greenyard received a transparency notification dated 8 September 2022 indicating that Agri Investment Fund BV, a 100% subsidiary of Maatschappij voor Roerend Bezit van de Boerenbond BV, as a result of the acquisition of shares of the Company, exceeded the statutory notification threshold of 3%. According to the transparency notification, Agri Investment Fund BV holds 2 419 579 Greenyard shares, representing 4,7% of the Company’s voting rights. In addition, Deprez Holding NV and Food Invest International NV notified Greenyard that, as a result of a share transfer, they hold together with Greenyard (in respect of its treasury shares) 41,3% of the Company’s voting rights, and therefore have downwards crossed the 45% threshold. After this transaction, the Deprez family remains the largest shareholder with a stake of 37,7% in Greenyard.
6. Contacts
The Investor Relations team is available to answer shareholder and investor questions about the Group’s activities, shares and other information requests:
For the attention of Mr Dennis Duinslaeger, Investor Relations Manager
Greenyard NV Strijbroek 10
BE – 2860 Sint-Katelijne-Waver
Or by e-mail: dennis.duinslaeger@greenyard.group
CONTENTS | CONTENTS FINANCIAL REPORT 220 /
515 443. Shareholder structure Number of shares % Deprez Holding NV 13 550 861 26,3% Food Invest International NV 5 890 987 11,4% Alychlo 6 928 572 13,4% Sujajo Inv. 3 657 145 7,1% Agri Investment Fund 2 419 579 4,7% Mr Joris Ide 1 547 286 3,0% Treasury shares 1 843 840 3,6% Public 15 677 173 30,4% TOTAL 51 515 443 100,0%
7. Financial calendar
/ 221
Q1 trading update AY 23/24: 29 August 2023 (before market) Annual Shareholders’ Meeting AY 22/23: 15 September 2023 Announcement of half-year results (01/04/2023 - 30/09/2023): 14 November 2023 (before market) Q3 trading update AY 23/24: 20 February 2024 (before market)

222 / UNLEASHING THE PURE POWER OF PLANTS
Consolidated financial statements

/ 223 GREENYARD ANNUAL REPORT 2022/2023
Consolidated income statement
The attached notes form an integral part of this income statement.
CONTENTS | CONTENTS FINANCIAL REPORT 224 /
Consolidated income statement Note AY 22/23 AY 21/22 €'000 €'000 CONTINUING OPERATIONS Sales 5.1. 4 690 110 4 400 537 Cost of sales 5.2. -4 395 409 -4 105 703 Gross profit/loss (-) 294 701 294 834 Selling, marketing and distribution expenses 5.2. -100 108 -98 797 General and administrative expenses 5.2. -162 290 -152 721 Other operating income/expense (-) 5.4. 15 963 14 475 Share of profit/loss (-) of equity accounted investments 6.6. 443 492 EBIT 48 709 58 283 Interest expense 5.5. -43 261 -30 696 Interest income 5.5. 900 221 Other finance result 5.5. 7 940 -3 947 Net finance income/cost (-) -34 422 -34 422 Profit/loss (-) before income tax 14 287 23 861 Income tax expense (-)/income 5.6. -4 999 -6 984 Profit/loss (-) for the period from continuing operations 9 289 16 877 DISCONTINUED OPERATIONS Profit/loss (-) for the period from discontinued operations -PROFIT/LOSS (-) FOR THE PERIOD 9 289 16 877 Attributable to: The shareholders of the Group 7 822 16 018 Non-controlling interests 1 467 859 Earnings per share from continuing and discontinuing operations (in € per share) Note AY 22/23 AY 21/22 Basic 5.7. 0,16 0,32 Diluted 5.7. 0,16 0,32 Earnings per share from continuing operations (in € per share) Note AY 22/23 AY 21/22 Basic 5.7. 0,16 0,32 Diluted 5.7. 0,16 0,32
Consolidated statement of comprehensive income
The attached notes form an integral part of this statement of comprehensive income.
/ 225
Consolidated statement of comprehensive income Note AY 22/23 AY 21/22 €'000 €'000 Profit/loss (-) for the period 9 289 16 877 Remeasurements on post employment benefit obligations, gross 6.14. 2 558 1 785 Deferred tax on remeasurements on post employment benefit obligations -719 -118 Items that will not be reclassified to profit or loss 1 839 1 667 Cash flow hedges, gross 6.18. 8 004 1 838 Deferred tax on cash flow hedges -2 001 -478 Currency translation differences on foreign operations -218 4 113 Reclassification adjustment currency translation differences to profit or loss 7.1. - 6 Items that may be reclassified to profit or loss 5 785 5 479 Other comprehensive income 7 624 7 146 TOTAL 16 913 24 023 Attributable to: The shareholders of the Group 15 552 22 891 Non-controlling interests 1 360 1 132
Consolidated statement of financial position
The attached notes form an integral part of this statement of financial position.
CONTENTS | CONTENTS FINANCIAL REPORT 226 /
Assets Note 31 March 2023 31 March 2022 €'000 €'000 NON-CURRENT ASSETS 1 239 001 1 217 842 Property, plant & equipment 6.1. 320 423 312 830 Goodwill 6.2. 477 504 477 504 Other intangible assets 6.3. 177 299 184 348 Right-of-use assets 6.4. 205 049 212 206 Investments accounted for using equity method 6.5. 8 650 8 206 Other financial assets 6.6. 16 852Deferred tax assets 6.7. 31 554 21 152 Trade and other receivables 6.9. 1 670 1 596 CURRENT ASSETS 734 205 679 697 Inventories 6.8. 375 382 341 197 Trade and other receivables 6.9. 239 012 239 674 Other financial assets 6.6. 455 322 Cash and cash equivalents 6.10. 119 357 98 504 TOTAL ASSETS 1 973 206 1 897 538 Equity and liabilities Note 31 March 2023 31 March 2022 €'000 €'000 EQUITY 486 037 469 324 Issued capital 6.12. 337 692 337 692 Share premium and other capital instruments 6.12. 317 882 317 882 Consolidated reserves -182 624 -198 227 Cumulative translation adjustments -2 764 -2 651 Non-controlling interests 15 850 14 629 NON-CURRENT LIABILITIES 615 839 614 905 Employee benefit liabilities 6.14. 13 735 16 676 Provisions 6.15. 9 117 10 428 Interest-bearing loans 6.16. 351 534 350 610 Lease liabilities 6.4. 200 810 202 612 Trade and other payables 6.17. 3 142 4 143 Deferred tax liabilities 6.7. 37 501 30 437 CURRENT LIABILITIES 871 330 813 309 Provisions 6.15. 3 796 5 106 Interest-bearing loans 6.16. 29 922 44 628 Lease liabilities 6.4. 30 445 29 386 Other financial liabilities 6.6. 1 278 370 Trade and other payables 6.17. 805 889 733 819 TOTAL EQUITY AND LIABILITIES 1 973 206 1 897 538
Consolidated statement of changes in equity
* In the course of the accounting year, a new lease accounting software was implemented. During this migration, non-material errors were identified with respect to prior periods. These errors were corrected in the opening retained earnings of 1 April 2022.
The attached notes form an integral part of this statement of changes in equity.
/ 227
AY 22/23 Note Attributable to shareholders of the Group Non-controlling interests Total equity Share capital Share premiums Treasury shares Retained earnings Cash flow hedge reserve Foreign currency translation reserve Fair value reserve Defined benefit liability Total €'000 €'000 €'000 €'000 €'000 €'000 €'000 €'000 €'000 €'000 €'000 Balance at 31 March 2022 337 692 317 882 -27 823 -167 481 -649 -2 651 51 -2 326 454 695 14 629 469 324 Balance at 1 April 2022* 337 692 317 882 -27 823 -168 501 -649 -2 651 51 -2 326 453 675 14 629 468 304 Profit/loss (-) for the period - - - 7 822 - - - - 7 822 1 467 9 289 Other comprehensive income - - - - 6 003 -112 - 1 839 7 730 -106 7 624 Total comprehensive income for the period - - - 7 822 6 003 -112 - 1 839 15 552 1 360 16 913 Dividend payment - - - - - - - - - -139 -139 Share based payments, gross 6.13. - - - 826 - - - - 826 - 826 Deferred tax on share based payments - - - -207 - - - - -207 - -207 Acquisition/sale treasury shares - - 865 - - - - - 865 - 865 Result on sale of treasury shares upon exercise of employee stock options - - - -525 - - - - -525 - -525 Other - - - - - - - - - -Balance at 31 March 2023 337 692 317 882 -26 957 -160 584 5 355 -2 763 51 -487 470 187 15 850 486 037
AY 21/22 Note Attributable to shareholders of the Group Non-controlling interests Total equity Share capital Share premiums Treasury shares Retained earnings Cash flow hedge reserve Foreign currency translation reserve Fair value reserve Defined benefit liability Total €'000 €'000 €'000 €'000 €'000 €'000 €'000 €'000 €'000 €'000 Balance at 31 March 2021 337 696 317 882 -22 439 -184 787 -2 009 -6 498 51 -3 993 435 903 15 214 451 118 Profit/loss (-) for the period - - - 16 018 - - - - 16 018 859 16 877 Other comprehensive income - - - - 1 360 3 846 - 1 667 6 873 273 7 146 Total comprehensive income for the period - - - 16 018 1 360 3 846 - 1 667 22 891 1 132 24 023 Transaction costs 6.12. -4 - - - - - - - -4 - -4 Dividend payment - - - - - - - - - -84 -84 Disposal Bardsley Farms - - - - - - - - - -1 633 -1 633 Share based payments, gross 6.13. - - - 1 330 - - - - 1 330 - 1 330 Deferred tax on share based payments - - - -423 - - - - -423 - -423 Acquisition/sale treasury shares - - -5 456 - - - - - -5 456 - -5 456 Sale of treasury shares upon exercise of employee stock options - - 72 - - - - - 72 - 72 Other - - - 380 - - - - 380 - 380 Balance at 31 March 2022 337 692 317 882 -27 823 -167 481 -649 -2 651 51 -2 326 454 695 14 629 469 324
Consolidated statement of cash flows
The attached note form an integral part of this statement of cash flows.
CONTENTS | CONTENTS FINANCIAL REPORT 228 /
Consolidated statement of cash flows Note AY 22/23 AY 21/22 €'000 €'000 CASH, CASH EQUIVALENTS AND BANK OVERDRAFTS, OPENING BALANCE 98 026 79 341 CASH FLOW FROM OPERATING ACTIVITIES (A) 163 934 132 201 EBIT from continuing operations 48 709 58 283 EBIT from discontinued operations -Income taxes paid -13 496 -16 384 Adjustments 94 948 102 712 Amortisation of intangible assets 6.3. 20 516 21 098 Depreciation of property, plant & equipment and right-of-use assets 6.1., 6.4. 80 841 79 160 Write-off on stock/trade receivables 381 3 377 Increase/decrease (-) in provisions and employee benefit liabilities 6.14., 6.15. -5 928 1 065 Gain (-)/loss on disposal of property, plant & equipment -1 245 -555 Result on change in control of subsidiaries and equity accounted investments - -2 653 Share based payments and other 6.13. 826 1 710 Share of profit/loss (-) of equity accounted investments 6.5. -443 -492 Increase (-) /decrease in working capital 33 773 -12 410 Increase (-)/decrease in inventories 6.8. -37 347 -55 685 Increase (-)/decrease in trade and other receivables 6.9. 2 274 60 362 Increase/decrease (-) in trade and other payables 6.17. 68 847 -17 087 CASH FLOW FROM INVESTING ACTIVITIES (B) -54 197 -27 938 Acquisitions (-) -56 719 -48 485 Acquisition of intangible assets and property, plant & equipment 6.1., 6.3. -56 719 -48 485 Disposals 2 521 20 547 Disposal of intangible assets and property, plant & equipment 6.1., 6.3. 2 521 1 200 Disposal of subsidiaries 7.1. - 19 347 CASH FLOW FROM FINANCING ACTIVITIES (C) -88 064 -86 722 Capital increase, net of transaction costs 6.12. - -4 Dividend payment -139Acquisition/sale treasury shares 340 -5 456 Proceeds from borrowings, net of transaction costs 6.16. 479 112 135 763 Repayment of borrowings 6.16. -495 570 -153 371 Payment of principal portion of lease liabilities 6.4. -32 804 -31 845 Net interests paid -38 353 -29 463 Other financial expenses -650 -2 346 NET INCREASE IN CASH AND CASH EQUIVALENTS (A+B+C) 21 673 17 542 Effect of exchange rate fluctuations -343 1 144 CASH, CASH EQUIVALENTS AND BANK OVERDRAFTS, CLOSING BALANCE 119 356 98 026 Of which: Cash and cash equivalents 6.10. 119 357 98 504 Bank overdrafts 6.10. 1 478
/ 229

230 / UNLEASHING THE PURE POWER OF PLANTS
Notes to the consolidated financial statements

/ 231 GREENYARD ANNUAL REPORT 2022/2023
1. General information
Greenyard (Euronext Brussels: GREEN), domiciled in Belgium in Sint-Katelijne-Waver, is one of the largest suppliers of fruit and vegetables in the world. We offer pure plant, healthy food products for any lifestyle, age group or consumption. Fresh, frozen or prepared. Traditional or new varieties. Exotic or local. Pre-packaged or in bulk. The Group had approximately 8 500 employees in 23 countries around the world.
The consolidated financial statements of Greenyard NV (‘the Company’) and its subsidiaries (together, ‘the Group’) for the year ending 31 March 2023 were authorized for issue by the Board of Directors on 8 June 2023.
2. Significant accounting policies
2.1. Basis of preparation
The consolidated financial statements of the Group have been prepared in accordance with the International Financial Reporting Standards (IFRS) as adopted by the EU and with the legal and regulatory requirements applicable in Belgium. The consolidated financial statements have been prepared on a historical cost basis, except for derivative financial instruments, quoted equity investments and pensions that have been valued at fair value.
2.2. Changes in accounting policies and disclosures
The accounting policies adopted in preparing the AY 22/23 consolidated financial statements as of 31 March 2023 are consistent with those applied when preparing the AY 21/22 consolidated financial statements ending on 31 March 2022, except for the items below.
Amendments to IFRS mandatory for the current year
In May 2020, the IASB made amendments to IFRS 3 Business Combinations; IAS 16 Property, Plant and Equipment; IAS 37 Provisions, Contingent Liabilities and Contingent Assets; and Annual Improvements 2018-2020. The amendments are effective as from 1 January 2022.
With regard to the standards and interpretations which became applicable during AY 22/23, the Group believes that these have little or no impact on its consolidated financial statements.
New and revised IFRS issued but not yet effective
In AY 22/23, the Group did not prospectively apply the following new or revised standards and interpretations, which have been issued but are not effective at the date of approval of the consolidated financial statements:
Texts endorsed by EFRAG:
• Amendments to IAS 1 Presentation of Financial Statements and IFRS Practice Statement 2: Disclosure of Accounting policies (applicable as from 1 January 2023);
• Amendments to IAS 8 Accounting policies, Changes in Accounting Estimates and Errors: Definition of Accounting Estimates (applicable as from 1 January 2023);
• Amendments to IFRS 17 Insurance contracts (applicable as from 1 January 2023);
• Amendments to IFRS 17 Insurance contracts: Initial Application of IFRS 17 and IFRS 9 – Comparative Information (applicable as from 1 January 2023);
• Amendments to IAS 12 Income Taxes: Deferred Tax related to Assets and Liabilities arising from a Single Transaction (applicable as from 1 January 2023).
CONTENTS | CONTENTS FINANCIAL REPORT 232 /
Texts not yet endorsed by EFRAG:
• Amendments to IAS 1 Presentation of Financial Statements: Classification of Liabilities as Current or Non-current Date; Classification of Liabilities as Current or Non-current - Deferral of Effective Date; and Non-current Liabilities with Covenants (applicable as from 1 January 2024);
• Amendments to IFRS 16 Leases: Lease Liability in a Sale and Leaseback (applicable as from 1 January 2024).
At the present time the Group does not expect that the amended standards will significantly affect the financial statements of the Group during their first-time application.
2.3. Basis of consolidation Subsidiaries
The consolidated financial statements comprise the financial statements of the Company and entities controlled by the Company and their subsidiaries. The Group controls an investee if the Group:
• has power over the investee;
• is exposed, or has rights, to variable returns from its involvement with the investee; and
• has the ability to use its power to affect its returns.
The Group considers all relevant facts and circumstances in assessing whether it has power over an investee.
Consolidation of a subsidiary begins when the Group obtains control over the subsidiary and ceases when the Group loses control of the subsidiary.
Profit and loss, and each component of other comprehensive income, are attributed to the shareholders of the Group and to the non-controlling interests, even if this results in the non-controlling interests having a deficit balance.
Where necessary, adjustments are made to the financial statements of subsidiaries to bring their accounting policies in line with Group accounting policies. All intra-group assets and liabilities, equity, income, expenses and cash flows relating to transactions between members of the Group are eliminated in full in the consolidation.
Changes in the ownership interest of a subsidiary, without a loss of control, is accounted for as an equity transaction. The carrying amounts of the Group’s net interests and the non-controlling interests are adjusted to reflect the changes in their relative interests in the subsidiaries. Any difference between the amount by which the non-controlling interests are adjusted and the fair value of the consideration paid or received is recognized directly in equity and attributed to the shareholders of the Group.
If the Group loses control over a subsidiary, it derecognizes the related assets (including goodwill), liabilities, non- controlling interests and other components of equity, while any resultant gain or loss is recognized in profit or loss. Any investment retained is initially recognized at fair value.
Business combinations are accounted for using the acquisition method. The cost of an acquisition is measured as the aggregate of the consideration transferred, which is measured at acquisition-date fair value, and the amount of any non- controlling interests in the acquiree.
Acquisition-related costs are expensed as incurred. When the Group acquires a business, it assesses the financial assets and liabilities assumed for appropriate classification and designation in accordance with the contractual terms, economic circumstances and pertinent conditions, as at the acquisition date.
Any contingent consideration to be transferred by the acquirer will be recognized at fair value at the acquisition date. Changes in the fair value of the contingent consideration, qualifying as measurement period adjustments, are adjusted retrospectively, with corresponding adjustments against goodwill. Measurement period adjustments are adjustments that arise from additional information obtained during the measurement period (which cannot exceed one year from the acquisition date) about facts and circumstances that existed at the acquisition date. Subsequent changes to the fair value of the contingent consideration that do not qualify as measurement period adjustments and are deemed to be an asset or liability are recognized either in profit and loss or as a change to other comprehensive income. A contingent consideration classified as equity is not remeasured at subsequent reporting dates and its subsequent settlement is accounted for within equity.
/ 233
Goodwill is initially measured as the excess of the aggregate of the consideration transferred and the amount recognized for non-controlling interests and any previous interest held over the net identifiable assets acquired and liabilities assumed. If the fair value of the net assets acquired is in excess of the aggregate consideration transferred, the Group re- assesses whether it has correctly identified all of the assets acquired and all of the liabilities assumed and reviews the procedures used to measure the amounts to be recognized at the acquisition date. If the reassessment still results in an excess of the fair value of net assets acquired over the aggregate consideration transferred, then the gain is recognized in profit or loss as a bargain purchase gain.
When a business combination is achieved in stages, the Group's previously held equity interest in the acquiree is remeasured to its acquisition date fair value and the resulting gain or loss is recognized in profit or loss. Amounts arising from interests in the acquiree prior to the acquisition date that have previously been recognized in other comprehensive income are reclassified to profit or loss, where such treatment would be appropriate if those interests were disposed of.
Investments in joint ventures and associated companies
An associate is an entity over which the Group has significant influence. Significant influence is the power to participate in the financial and operating policy decisions of the investee but is not control or joint control over those policies.
A joint venture is a type of joint arrangement whereby the parties that have joint control of the arrangement have rights to the net assets of the joint venture. Joint control is the contractually agreed sharing of control of an arrangement, which exists only when decisions about the relevant activities require the unanimous consent of the parties sharing control.
The Group’s investments in its associates and joint ventures are accounted for using the equity method. Under the equity method, the investment in an associate or a joint venture is initially recognized at cost. The carrying amount of the investment is adjusted to recognize changes in the Group’s share of net assets of the associate or joint venture since the acquisition date. Goodwill relating to the associate or joint venture is included in the carrying amount of the investment.
The income statement reflects the Group’s share of the results of operations of the associate or joint venture. Any change in other comprehensive income of those investees is presented as part of the Group’s other comprehensive income. In addition, when there has been a change recognized directly in the equity of the associate or joint venture, the Group recognizes its share of any changes, when applicable, in the statement of changes in equity. Unrealized gains and losses resulting from transactions between the Group and the associate or joint venture are eliminated to the extent of the interest in the associate or joint venture.
The aggregate of the Group’s share of profit or loss of equity accounted investments is shown on the face of the income statement within EBIT, which represents profit or loss after tax and non-controlling interests in the subsidiaries of the associate or joint venture.
The financial statements of the associate or joint venture are prepared for the same reporting period as the Group. Where necessary, adjustments are made to bring the accounting policies in line with those of the Group.
When the Group’s share of losses of an associate or a joint venture exceeds the Group’s interests in that associate or joint venture, the Group discontinues recognizing its share of losses. Additional losses are recognized only to the extent that the Group has incurred legal or constructive obligations or made payments on behalf of the associate or joint venture.
Upon loss of significant influence over the associate or joint control over the joint venture, the Group measures and recognizes any retained investment at its fair value. Any difference between the carrying amount of the associate or joint venture upon loss of significant influence, or joint control and the fair value of the retained investment and proceeds from disposal, is recognized in profit or loss.
CONTENTS | CONTENTS FINANCIAL REPORT 234 /
2.4. Summary of significant accounting policies
Foreign currencies
A. Foreign currency transactions
Foreign currency transactions are accounted for at exchange rates prevailing on the date of the transaction. Monetary assets and liabilities denominated in foreign currencies are translated at the reporting date rate. Gains and losses resulting from the settlement of foreign currency transactions and from the translation of monetary assets and liabilities denominated in foreign currencies are recognised in the income statement. Non-monetary assets and liabilities denominated in foreign currencies are translated at the foreign exchange rate prevailing at the date of the transaction.
Foreign exchange gains and losses that relate to borrowings, and cash and cash equivalents, are presented in the income statement within the finance result. All other foreign exchange gains and losses are presented in the income statement within EBIT.
B. Translation of the results and financial position of foreign operations
Assets and liabilities of foreign operations are translated to euro at foreign exchange rates prevailing at the reporting date. Income statements of foreign operations are translated to euro at exchange rates for the year approximating the foreign exchange rates prevailing at the dates of the transactions. The components of shareholders’ equity are translated at historical rates. In cases where the operation is not fully owned, the relevant proportionate share of the translation adjustment is allocated to the non-controlling interests. On the disposal of a foreign operation, all of the exchange differences accumulated in equity in respect of that operation attributable to the Group’s shareholders are reclassified to profit and loss.
C. Exchange rates
The main exchange rates used in preparing the financial statements are:
Goodwill
In conformity with IFRS 3 Business Combinations, goodwill is stated at cost and not amortised but tested for impairment on an annual basis and whenever there is an indication that the cash generating unit to which goodwill has been allocated may be impaired. The carrying amount of the goodwill is compared with the recoverable amount, which is the higher of the value-in-use and the fair value, less cost to sell.
Other intangible assets
A. Research and development
Expenditure on research activities, undertaken with the prospect of gaining new scientific or technical knowledge and understanding, is recognised in the income statement as an expense as incurred. Expenditure on development activities, whereby research findings are applied to a plan or design for the production of new or substantially improved products and processes, is capitalised if the product or process is technically and commercially feasible, future economic benefits are probable and the company has sufficient resources to complete development. The expenditure capitalised includes the cost of materials, direct labour and an appropriate proportion of overheads. Other development expenditure is recognised in the income statement as an expense as incurred. Capitalised development expenditure is stated at cost less accumulated amortisation and impairment losses.
/ 235
Closing rate Average rate 31 March 2023 31 March 2022 AY 22/23 AY 21/22 1 USD = € 0,9195 € 0,9008 € 0,9606 € 0,8604 1 GBP = € 1,1374 € 1,1821 € 1,1568 € 1,1759 1 PLN = € 0,2141 € 0,2149 € 0,2124 € 0,2181 1 BRL = € 0,1813 € 0,1886 € 0,1863 € 0,1613 1 CZK = € 0,0426 € 0,0410 € 0,0411 € 0,0395 1 CLP = € 0,0012 € 0,0011 € 0,0011 € 0,0011
B. Software and licences
Purchased software and licences are measured at cost less accumulated amortisation and impairments. Expenditure on internally developed software is capitalised when the expenditure qualifies as development activity; otherwise, it is recognised in the income statement when incurred. Software and licences are amortised using the straight-line method over their estimated useful life.
C. Customer relationships
The customer relationships acquired in a business combination are initially measured at fair value at the date of the acquisition. Fair value is determined based on an external valuation report. Following their initial recognition, customer relationships are carried at cost less any accumulated amortization and impairment losses.
D. Useful lives
The useful lives of the intangible assets can be summarized as follows:
The carrying amount of intangible assets is reviewed at each reporting date to determine whether there is any indication of impairment. If there is any such indication, the asset’s recoverable amount is estimated so that the amount of the impairment loss may be determined.
Property, plant & equipment
The Group has opted for the historical cost model rather than the revaluation model. Items falling within the property, plant and equipment category, separately acquired, are initially measured at cost. Property, plant and equipment acquired in a business combination is initially measured at fair value, which thus becomes its deemed cost. After initial recognition, property, plant and equipment is measured at cost less accumulated depreciation and impairment losses. The cost includes all direct costs and all expenditure incurred to bring the asset to its working condition and location for its intended use. Borrowing costs directly attributable to the acquisition, construction or production of a qualifying asset are capitalised as part of the cost of that asset. Depreciation is provided over the estimated useful lives of the various classes of property, plant and equipment on a straight-line basis.
The useful life, residual value and depreciation methods are reviewed at least at each financial year-end.
Government grants relating to the purchase of property, plant and equipment are deducted from the cost of those assets. They are recognised in the statement of financial position at their expected value at the time of initial government approval and corrected, if necessary, after final approval. The grant is amortised over the depreciation period of the underlying asset.
The carrying amount of property, plant and equipment is reviewed at each reporting date to determine whether there is any indication of impairment. If any such indication exists, the asset’s recoverable amount is estimated so that the amount of the impairment loss may be determined.
CONTENTS | CONTENTS FINANCIAL REPORT 236 /
Item Years Method Software and licences 3 - 7 Straight-line Customer relationships 15 - 20 Straight-line Other intangible assets 3 - 5 Straight-line
Item Years Method Owned buildings 18 - 40 Straight-line Owned buildings - refurbishments 5 - 25 Straight-line Leased buildings - structural refurbishments 18 - 40 Straight-line Leased buildings - refurbishments 5 - 25 Straight-line Land improvements 3 - 13 Straight-line Plant, machinery and equipment 3 - 15 Straight-line Vehicles 3 - 10 Straight-line
Accounting for leases as lessee
The Group assesses at contract inception whether a contract is, or contains, a lease. That is, if the contract conveys the right to control the use of an identified asset for a period of time in exchange for consideration. The Group recognised a right-of-use asset and a corresponding lease liability with respect to all lease agreements, except for short- term leases (defined as a lease with a lease term less than 12 months) and leases of low-value assets. The lease payments of such leases are recognized as an operating expense on a straight-line basis over the term of the lease and payments are presented in cash flow from operating activities.
A. Right-of-use assets
The Group recognises right-of-use assets at the commencement date of the lease (i.e., the date the underlying asset is available for use). Right-of-use assets are measured at cost, less any accumulated depreciation and impairment losses, and adjusted for any remeasurement of lease liabilities. The cost of right-of-use assets includes the amount of lease liabilities recognised, initial direct costs incurred, and lease payments made at or before the commencement date less any lease incentives received. Right-of-use assets are depreciated on a straight-line basis over the shorter of the lease term and the estimated useful lives of the assets, including the period of renewable options, in case it is probably that the option will be exercised.
The right-of-use assets are also subject to impairment.
B. Lease liabilities
At the commencement date of the lease, the Group recognises lease liabilities measured at the present value of lease payments to be made over the lease term. The lease payments include fixed payments less any lease incentives receivable, variable lease payments that depend on an index or a rate, and purchase options if the Group is reasonably certain to exercise these options. Variable lease payments that do not depend on an index or a rate are recognised as expenses in the period in which the event or condition that triggers the payment occurs.
In calculating the present value of lease payments, the Group uses its incremental borrowing rate at the lease commencement date because the interest rate implicit in the lease is not readily determinable. After the commencement date, the amount of lease liabilities is increased to reflect the accretion of interest and reduced for the lease payments made.
A lease liability is remeasured upon a change in the lease term, changes in an index or rate used to determine the lease payments or reassessment of exercise of a purchase option. The corresponding adjustment is made to the related right- of-use asset.
Financial assets
The Group classifies its financial assets as subsequently measured at amortised cost, fair value through other comprehensive income (FVOCI), and fair value through profit or loss (FVTPL). Management determines the classification of its financial assets at initial recognition, which is based on two criteria: the objective of the company’s business model for managing the assets; and whether the instruments’ contractual cash flows represent ‘solely payments of principal and interest’ on the principal amount outstanding (the ‘SPPI criterion’).
The classification and measurement of the company’s financial assets is as follows:
A. Financial assets at amortised cost
Loans and receivables are non-derivative financial assets with fixed or determinable payments which are not quoted in an active market, are held to collect contractual cash flows and are expected to give rise to cash flows representing solely payments of principal and interests. The Group’s financial assets at amortised cost, less any impairment comprise, unless stated otherwise, trade and other receivables, bills of exchange received, short-term deposits and cash and cash equivalents in the statement of financial position. Loans and receivables are measured at amortised cost using the effective interest method, less any impairment.
An estimate of impairment losses for doubtful receivables is made based on a review of all outstanding amounts at the reporting date. An allowance for impairment of trade and other receivables is established if the collection of a receivable becomes doubtful. Such a receivable becomes doubtful when there is objective evidence that the company will not be able to collect all amounts due according to the original terms of the receivable. Significant financial difficulties of the debtor, probability that the debtor will enter into bankruptcy or financial reorganisation, and default or delinquency in payments are considered indicators that the receivable is impaired. The amount of the allowance is the difference between the asset’s carrying amount and the present value of the estimated future cash flows. An impairment loss is recognised in the income statement, as are subsequent recoveries of previous impairments.
/ 237
B. Financial assets at FVOCI
Upon initial recognition, the Group can elect to classify irrevocably its equity investments as equity instruments designated at fair value through OCI when they meet the definition of equity under IAS 32 Financial Instruments: Presentation and are not held for trading. The classification is determined on an instrument-by-instrument basis. Assets classified in this category are stated at fair value, with any resultant gains or losses recognised directly in equity with no recycling through profit or loss upon disposal. The Group elected not to apply FVOCI for equity instruments that do not have a quoted price in an active market and for which their fair value cannot be reliably measured by alternative valuation methods. In this case, the instrument is stated at cost.
C. Financial assets at fair value through profit or loss (FVTPL)
This category includes derivative instruments and equity investments held for trading or for which the Group had not irrevocably elected to classify them at FVOCI.
Inventories
Inventories are valued at the lower of cost and net realisable value. The cost includes expenditure incurred in acquiring the inventories and bringing them to their existing location and condition. The FIFO (first-in, first-out) method is used in assigning the cost of inventories.
The cost of finished products and work in progress comprises raw material, other production material, direct labour, other direct costs and an allocation of fixed and variable overhead based on normal operating capacity. Net realisable value is the estimated selling price in the ordinary course of business, less the estimated completion and selling costs. In the case of contracted sales, the average contract price is used to calculate the net realisable value.
Inventories are written down on a case-by-case basis if the anticipated net realisable value declines below the carrying amount of the inventories. The calculation of the net realisable value takes into consideration specific characteristics of each inventory category, such as expiry date, remaining shelf life and slow-moving indicators.
Cash and cash equivalents
Cash and cash equivalents include all cash balances and short-term highly liquid investments with a maturity of three months or less from the date of acquisition that are readily convertible into cash. They are stated at face value, which approximates their fair value. In the cash flow statement, cash and cash equivalents are presented net of bank overdrafts.
Equity
A. Repurchase of share capital
When the Group buys back its own shares, the amount of the consideration paid, including directly attributable costs, is recognised as a deduction from equity under treasury shares. The result on the disposal of treasury shares sold or cancelled is recognised in retained earnings.
B. Dividends
Dividends are recognised in the consolidated financial statements on the date that the dividends are declared.
C. Share issuance costs
Incremental costs directly attributable to the issue of new shares or options are shown in equity (share capital) as a deduction, net of tax, from the proceeds.
Provisions
Provisions are recognised where (i) the company has a present legal or constructive obligation as a result of past events, (ii) it is probable that an outflow of resources embodying economic benefits will be required to settle the obligation, and (iii) a reliable estimate of the amount of the obligation can be made. Provisions are determined by discounting the expected future cash flows at a pre-tax rate that reflects current market assessments of the time value of money and, where appropriate, the risks specific to the liability.
CONTENTS | CONTENTS FINANCIAL REPORT 238 /
A. Restructuring
A provision for restructuring is recognised when the Group has approved a detailed and formal restructuring plan, and the restructuring has either commenced or has been announced publicly. Costs relating to the ongoing activities of the company are not provided for.
B. Onerous contracts
A provision for onerous contracts is recognised when the expected benefits to be derived from a contract by the Group are lower than the unavoidable cost of meeting its obligations under the contract. Such provision is measured at the present value of the lower of the expected cost of terminating the contract and the expected net cost of continuing with the contract.
C. Disputes and litigations
A provision for disputes and litigations is recognised when it is more likely than not that the Group will be required to make future payments as a result of past events. Such items may include but are not limited to several claims, environmental matters, employment related disputes and claims from tax authorities.
D. Decommissioning
A provision for decommissioning is recognised when the Group has the obligation to decommission a building at the end of the lease agreement.
Employee benefits
A. Defined contribution plans
Contributions to defined contribution plans are recognised as an expense in the income statement when incurred. A defined contribution plan is a pension plan under which the Group pays fixed contributions into a fund. The Group has no legal or constructive obligations to pay further contributions if the fund does not hold sufficient assets to pay all employees the benefits relating to employee service in the current and prior periods.
B. Belgian defined contribution plans with guaranteed return
By law, defined contribution pension plans in Belgium are subject to minimum guaranteed rates of return and therefore classify as defined benefit plans. IASB and IFRIC acknowledge that accounting for these plans in accordance with IAS 19 can be problematic. Considering the uncertainty of the future minimum guaranteed rates of return in Belgium, the Group calculates the net liability as the sum of any individual differences between the mathematical reserves and the minimum guarantee as determined by the Belgian law enforcing the minimum guaranteed rates of return, being the intrinsic value approach.
C. Defined benefit plans
A defined benefit plan is a pension plan that is not a defined contribution plan. Typically, defined benefit plans define an amount of pension benefit that an employee will receive on retirement, usually dependent on one or more factors such as age, years of service and compensation.
For defined benefit plans, the pension expenses are assessed separately for each plan using the projected unit credit method. The projected unit credit method considers each period of service as giving rise to an additional unit of benefit entitlement. Under this method, the cost of providing pensions is charged to the income statement so as to spread the regular cost over the service lives of employees in accordance with the advice of qualified actuaries who carry out a full valuation of the plans at least every three years. The amounts charged to the income statement include current service costs, net interest expense (income), past service costs and the effect of any curtailments or settlements. Past service costs are recognised at the earlier of when the amendment / curtailment occurs or when the Group recognises related restructuring or termination costs.
The pension obligations recognised in the statement of financial position are measured at the present value of the estimated future cash outflows using interest rates based on high quality corporate bond yields, which have terms to maturity approximating the terms of the related liability, less the fair value of any plan assets. Re-measurements, comprising of actuarial gains and losses, the effect of the asset ceiling (excluding net interest) and the return on plan assets (excluding net interest) are recognised in full in the period in which they occur in the statement of comprehensive income. Re-measurements are not reclassified to profit or loss in subsequent periods.
/ 239
D. Other long-term employee benefits
Other long-term employee benefits, such as jubilee awards, are accounted for using the projected unit credit method. However, the accounting method differs from the method applied for defined benefit plans, as actuarial gains and losses are recognised immediately through profit or loss.
Interest-bearing loans
Interest-bearing loans are recognised initially at fair value, less attributable transaction costs. Subsequent to initial recognition, interest-bearing loans are stated at amortised cost with any difference between the initial amount and the maturity amount being recognised in the income statement (as interest expense) over the expected life of the instrument on an effective interest rate basis.
Loans are derecognized when the obligation is discharged, cancelled or expires. When an existing loan is replaced by another from the same lender on substantially different terms, or the terms of the existing loan are substantially modified, such an exchange or modification is treated as the derecognition of the original loan and the recognition of a new liability. The difference in the respective carrying amounts is recognized in the statement of profit and loss.
When a refinancing is done, an assessment is made whether it concerns a debt modification or a debt extinguishment. When a refinancing is considered a debt modification, an analysis is made (qualitative and if needed quantitative) whether or not the modification is substantial. When the modification is substantial, it results in the derecognition of the original loan and the recognition of a new liability. The unamortized transaction costs related to the previous loans are recognized in the statement of profit and loss. Transaction costs related to the new loans are also recognized in the statement of profit and loss except for costs which are considered a yield adjustment as in this case the amount of the loan deducted with the transaction costs is considered the fair value of the debt instrument.
Trade and other payables
Trade and other payables are recognised initially at fair value and subsequently measured at amortised cost using the effective interest method.
Derivatives, hedging and hedging reserves
The Group uses derivatives to hedge its exposure to foreign exchange and interest rate risks arising from operating, financing and investing activities. The net exposure of all subsidiaries is managed on a centralised basis by Corporate Treasury in accordance with the aims and principles laid down by general management. As a matter of policy, the Group does not engage in speculative or leveraged transactions.
Derivatives are initially and subsequently measured and carried at fair value. The fair value of traded derivatives is equal to their market value. If no market value is available, the fair value is calculated using standard financial valuation models, based on the relevant market rates at the reporting date.
The Group applies hedge accounting in accordance with IFRS 9 to reduce income statement volatility. Depending on the nature of the hedged risk, a distinction is made between fair value hedges, cash flow hedges and hedges of a net investment in a foreign entity.
Fair value hedges are hedges of the exposure to variability in the fair value of recognised assets and liabilities. The derivatives classified as fair value hedges are carried at fair value and the related hedged items (assets or liabilities) are re- measured for fair value changes due to the hedged risk. The corresponding changes in fair value are recognised in the income statement. When a hedge ceases to be highly effective, hedge accounting is discontinued and the adjustment to the carrying amount of a hedged interest-bearing financial instrument is recognised as income or expense and will be fully amortised over the remaining period to maturity of the hedged item.
Cash flow hedges are hedges of the exposure to variability in future cash flows related to recognised assets or liabilities, highly probable forecast transactions or currency risk on unrecognised firm commitments. Changes in the fair value of a hedging instrument that qualifies as a highly effective cash flow hedge are recognised directly in shareholders’ equity. The ineffective portion is recognised immediately in the income statement. If the hedged cash flow results in the recognition of a non-financial asset or liability, all gains and losses previously recognised directly in equity are transferred from equity and included in the initial measurement of the cost or carrying amount of the asset or liability. For all other cash flow hedges, gains and losses initially recognised in equity are transferred from the hedging reserve to the income statement when the hedged firm commitment or forecast transaction results in the recognition of a profit or loss. When the hedge ceases to be highly effective, hedge accounting is discontinued prospectively, and the accumulated gain or loss is retained in equity until the committed or forecast transaction occurs. If the forecast transaction is no longer expected to occur, any net cumulative gain or loss previously reported in equity is transferred to the income statement.
CONTENTS | CONTENTS FINANCIAL REPORT 240 /
If a net investment in a foreign entity is hedged, all gains or losses on the effective portion of the hedging instrument, together with any gains or losses on the foreign currency translation of the hedged investment, are taken directly to equity. Any gains or losses on the ineffective portion are recognised immediately in the income statement. The cumulative remeasurement gains and losses on the hedging instrument, that had previously been recognised directly in equity, and the gains and losses on the currency translation of the hedged item are recognised in the income statement only on disposal of the investment.
To comply with the requirements of IFRS 9 regarding the use of hedge accounting, the strategy and purpose of the hedge, the relationship between the financial instrument used as the hedging instrument and the hedged item, and the estimated (prospective) effectiveness are documented by the Group at the inception of the hedge. The effectiveness of existing hedges is monitored quarterly. Hedge accounting for ineffective hedges is discontinued immediately.
The Group also uses derivatives that do not satisfy the hedge accounting criteria of IFRS 9 but provide effective economic hedges under the Group's risk management policies. Changes in the fair value of any such derivatives are recognised immediately in the income statement.
Income tax
Income tax comprises current and deferred tax. Income tax is recognised in the income statement except to the extent that it relates to items recognised directly in equity, in which case the tax effect is also recognised directly in equity.
Current tax is the expected tax payable on the taxable income for the year, using tax rates enacted, or substantively enacted, at the reporting date, and any adjustments to tax payables in respect of previous years. In accordance with IAS 12 Income Taxes, deferred taxes are provided using the so-called comprehensive balance sheet method. This means that, for all taxable and deductible differences between the tax bases of assets and liabilities and their carrying amounts in the statement of financial position a deferred tax liability or asset is recognised. Under this method a provision for deferred taxes is also made for differences between the fair values of assets and liabilities acquired in a business combination and their tax base. IAS 12 prescribes that no deferred taxes are recognised on i) the initial recognition of goodwill, ii) the initial recognition of assets or liabilities in a transaction that is not a business combination and affects neither accounting nor taxable profit and iii) differences relating to investments in subsidiaries to the extent that they will probably not reverse in the foreseeable future and to the extent that the company is able to control the timing of the reversal. The amount of deferred tax provided is based on the expected manner of realisation or settlement of the carrying amount of assets and liabilities, using currently or substantively enacted tax rates.
Deferred tax assets and liabilities are offset if there is a legally enforceable right to offset current tax liabilities and assets, and they relate to income taxes levied by the same tax authority on the same taxable entity, or on different taxable entities which intend either to settle current tax liabilities and assets on a net basis, or to realise the assets and settle the liabilities simultaneously.
The Group recognises deferred tax assets, including assets arising from losses carried forward, to the extent that future probable taxable profit will be available against which the deferred tax asset can be utilised, or the extent of the recognised deferred tax liability.
A deferred tax asset is reduced to the extent that it is no longer probable that the related tax benefit will be realised.
Tax claims are recorded within provisions on the statement of financial position.
Revenue
Revenue is recognised when it is probable that the economic benefits associated with the transaction will flow to the Group and the amount of revenue can be measured reliably.
Revenue is measured at the fair value of the consideration received or receivable.
Fresh operates using three different business models:
• Trading model: Fresh generates revenues through programmed sourcing or spot buying transactions, whereby the margin is determined based on the purchase pricing structure of the respective transaction, i.e. a sales-based purchase price (majority), a fixed price, a minimum guaranteed price or an agreed price range.
• Production model: Fresh generates revenues from own-produced fresh convenience and flowers.
• Service model: Fresh operates some or all of the fresh supply chain of some of its customers, with the added-value services remunerated on a cost-plus basis. For the sale of goods where added-value services, such as ripening or packing, are provided, Fresh is the primary entity responsible for fulfilling the promise to provide the goods to the customer. Some Fresh entities also enter into specific logistics agreements with customers whereby a fixed price per serviced item is agreed.
/ 241
For all transactions, except some logistical services, the Group acts as a principal since the main risks related to the purchase and sale of goods are borne by the Group. For the sale of goods for which added-value services, such as ripening or packing, have been delivered, the Group is the primary entity responsible for fulfilling the promise to provide the goods to the customer. The Group checks the quality of purchased goods and bears the inventory risk and the added-value services are not all in response to customer requests. As a consequence, the gross inflows received from the customers are recognised as revenue.
For all operating models, the revenue is recognised when performance obligations are satisfied by transferring control of the goods or services to the customer. Recognition of revenue typically takes place at a point in time upon delivery of the goods to the customer in accordance with the incoterm. At the time of delivery, risk and rewards are transferred, Greenyard has a right to payment and the customer has taken physical possession of the goods. Customer acceptance occurs in a very short period (maximum three days) after the goods are delivered to the customer’s premises. In the case of service contracts, revenue is recognised over time to the extent that the performance obligation has been satisfied, which in practice is a very short period of time for all services, such as transport, provided by Fresh.
The sale of frozen and prepared fruit and vegetables is mainly based on contractually agreed prices, while the volumes sold are mostly order-based. Fresh vegetable supplies are mainly subject to annual contracts negotiated with the suppliers, determining volumes and prices, whereas the supply of fresh fruit is mainly negotiated on an order by order basis, each of which determines volumes and prices.
In general, the goods and added value services are invoiced as they are delivered or carried out. The amounts are directly recognised in the income statement and do not require the measurement of the stage of completion.
Government grants are recognised where there is a reasonable assurance that the Group will comply with the conditions attached to the grants and the grants will be received. Grants compensating the Group for expenses incurred are systematically recognised as other operating income in the same period in which the expenses are incurred.
Rental income is recognised in other operating income on a straight-line basis over the term of the lease.
Finance result
Interest income comprises interest received or receivables on funds invested and is recognised as it accrues (taking into account the effective yield on the asset) unless collectability is in doubt.
Interest expense comprises interests on interest-bearing loans, calculated using the effective interest rate method, factoring interests and net interests on interest rate swaps settlements. All interest expenses incurred in connection with interest-bearing loans or financial transactions are expensed as incurred as part of interest expense. Any difference between the initial amount and the maturity amount of interest-bearing loans, such as transaction costs and fair value adjustments, are recognised in the income statement over the expected life of the instrument on an effective interest rate basis. The interest expense component of financial lease payments is also recognised in the income statement using the effective interest rate method.
Other finance result comprises dividend income, net gains or losses in the areas of foreign exchange and arising from interest rate swaps that are not part of a hedge accounting relationship, financial assets classified as trading, net fair value on the conversion option, as well as losses resulting from ineffective hedges.
Events after balance sheet date
Events after the balance sheet date which provide additional information about the Group’s position as at the reporting date (adjusting events) are reflected in the financial statements. Events after the balance sheet date which are not adjusting events are disclosed in the notes, if material.
CONTENTS | CONTENTS FINANCIAL REPORT 242 /
3. Critical accounting judgements and key sources of estimation uncertainty
3.1. Critical judgments in applying the entity’s accounting policies
The following are the critical judgments made by management, apart from those involving estimations (see note 3.2. Key sources of estimation uncertainty), that have a significant effect on the amounts reported in the consolidated financial statements.
In conformity with IFRS 9:3.2.2. which states that before evaluating whether, and to what extent, derecognition of a financial asset is appropriate, an entity should assess whether to apply the analysis of the transfer of risks and rewards to a part of a financial asset (or part of a group of similar financial assets) or to a financial asset (or group of similar financial assets) in its entirety. In our assessment of the derecognition of financial assets with regard to our factoring program (see 6.9 and 7.3.2) i.e. the factored receivables, we determined that it is appropriate to separately consider the derecognition of the factored receivables and of the related credit insurance. This means that the appropriateness of derecognising the receivables should be analysed without considering the effect of the credit insurance that was covering them before they were transferred. In our view, a trade receivable and the related acquired credit insurance are not similar financial assets because they are separately contracted with different counterparties, where the counterparty as well as the contractual rights and obligations are of a fundamentally different nature, and therefore not comparable.
3.2. Key sources of estimation uncertainty
Estimates and underlying assumptions are reviewed on an ongoing basis. Revisions to accounting estimates are recognized in the year in which the estimate is revised and in any future years affected.
In applying the Group’s accounting policies described above, the Directors have identified that the following areas are the key estimates that have a significant risk of resulting in a material adjustment to the carrying value of assets and liabilities within the next financial year:
• Goodwill impairment: The Group determines whether goodwill is impaired at least once a year. This requires an estimate of the value in use of the CGUs to which the goodwill is allocated. To estimate the value in use, the Group estimates the expected future cash flows from the CGUs and discounts them to their present value at a given discount rate, which is appropriate for the territory to which the goodwill is allocated. Forecasting expected cash flows and selecting an appropriate discount rate inherently requires estimation. The resulting calculation is sensitive to the assumptions in respect of sales growth rate, adjusted EBITDA growth rate and the discount rate applied. A sensitivity analysis has been performed on the estimates (see note 6.2. Goodwill). The Directors consider that the assumptions made, represent their best estimate of the future cash flows generated by the CGUs, and that the discount rate used is appropriate given the risks associated with the specific cash flows involved. Budgets comprise forecasts based on current and anticipated market conditions that have been considered and approved by the Board of Directors. Although based on the sensitivity analysis performed, there is no impairment charge to goodwill of the Fresh segment, it is considered appropriate to disclose this as an area of significant estimation due to the size of the balance and the fact that it could change as a result of future events within the next five years.
• Current tax provisions: In determining the income tax assets and liabilities recognized in the consolidated statement of the financial position, the Group is required to estimate the outcome of multiple tax years remaining open to tax authority audit in each of the jurisdictions in which it has companies. In making estimates for tax provisioning purposes, management makes use of in-house tax expertise, third-party studies prepared by professional advisors and any other information available. In the event of an audit, the Group may liaise with the relevant taxation authorities to agree an outcome. The tax liability provided for each tax year and jurisdiction is reassessed in each period to reflect our best estimate of the probable outcome in light of all the information available. A final position agreed with a tax authority or through expiry of a tax audit period could differ from the estimates made by us which would impact the current tax liability recognized in the consolidated statement of financial position. Several tax audit discussions are ongoing in different countries and entities. Should a tax audit commence, this would give additional visibility over maximum potential exposures as the tax authorities’ own position becomes clearer. Such developments would then further inform our best estimate in line with the approach above. Conversely, should tax audit windows close without audits commencing, this would enable tax provisions to be released.
/ 243
Deferred tax assessment: Deferred taxes are recognized in respect of temporary differences between the tax treatment and the treatment within the financial statements for assets and liabilities. Deferred tax assets are only recognized to the extent they are expected to be recovered. Recoverability is assessed on an ongoing basis. Deferred tax is calculated at the substantively enacted rate which is expected to apply in the period the asset or liability is expected to be realised. The Corporate Tax team, which has the overview of the Group’s deferred tax positions, is involved in assessing deferred tax assets. Deferred tax assets for tax losses carried forward are based on five-year revenue forecasts. The Group has taken into account advice provided by internal as well as external experts to determine the deferred tax asset positions relating to the tax losses carried forward. Deferred tax assets relating to tax losses carried forward, unused tax credits and temporary differences are recognized only to the extent that it is probable that sufficient taxable profit will exist in the foreseeable future. In estimating this, the Group takes into account aspects such as tax laws, regulations budgets and long-term business strategies (disregarding potential tax planning opportunities). Further details are provided in note 5.6. Income tax expense/ income and note 6.7. Deferred tax assets and liabilities. There is also estimation involved for those potential tax assets that remain unrecognized. The nature and amounts of unrecognized potential tax assets are disclosed in note 6.7. Deferred tax assets and liabilities
Although the Group does not believe that there is significant risk of a material adjustment to deferred tax assets within the next financial year, there is significant uncertainty at each year end and therefore the Group’s overall tax position could change within the next 12 months. Deferred tax assets and liabilities are offset if there is a legally enforceable right to offset current tax liabilities and assets, and they relate to income taxes levied by the same tax authority on the same taxable entity, or on different taxable entities which intend either to settle current tax liabilities and assets on a net basis, or to realize the assets and settle the liabilities simultaneously.
Employee benefit obligations: the determination of the defined benefit obligations is based on actuarial assumptions such as discount rate, salary increases, inflation and average duration of plans which are detailed in note 6.14. Pension and other employee benefit liabilities. These assumptions are considered to be a key source of estimation uncertainty as relatively small changes in the assumptions used may have a significant effect on the Group’s financial statements within the next year. Further information on the carrying amounts of the Group’s defined benefit obligation and the sensitivity of those amounts to changes in discount rate are provided in note 6.14. Pension and other employee benefit liabilities
Leases: Determining the lease term requires judgement. Elements that are considered include assessing the probability that early termination option or extension options will be exercised. All facts and circumstances relevant to the assessment are considered.
4. Segment information
For management purposes, the Group is organised into two operating segments based on the Group’s activities.
The Fresh segment is a worldwide market leader and supplier of fresh fruit and vegetables, flowers and plants, and fresh produce logistics. Segment Long Fresh includes the Frozen and Prepared activities. Frozen is a pioneer and market leader that processes freshly harvested fruits and vegetables into frozen food products that are easy to store and take little or no time to prepare. Prepared is a global player in freshly preserved fruit, vegetables and other ambient food products that are easy to store and ready to eat.
An overview of the companies included in the different segments is provided in note 7.1. Subsidiaries, associates, joint ventures and investments recorded at cost
Management assesses segment performance and allocates resources based on adjusted EBITDA and sales.
The segment’s assets are assets belonging directly to it. Segment assets and segment sales are presented before elimination of intersegment transactions. Sales between segments are on an arm’s length basis in a manner similar to transactions with third parties.
CONTENTS | CONTENTS FINANCIAL REPORT 244 /
Segment information AY 22/23 Continuing operations Fresh Long Fresh Eliminations (1) Unallocated (2) Consolidated €'000 €'000 €'000 €'000 €'000 Sales 3 818 155 875 932 -3 978 - 4 690 110 Third party sales 3 814 525 875 585 - - 4 690 110 Intersegment sales 3 631 347 -3 978 -Adjusted EBITDA 95 081 72 256 - -39 167 298 Total assets at 31 March 2023 1 192 902 637 140 -28 845 172 010 1 973 206
(1) Long-term intersegment receivables and intersegment participations are not included in the segment assets and therefore not included in the eliminations.
(2) Unallocated adjusted EBITDA includes adjusted EBITDA allocated to corporate. Unallocated assets include derivative financial instruments, cash and cash equivalents and other assets allocated to corporate.
We refer to the section Key Financial Information for the reconciliation from EBIT to adjusted EBITDA.
4.1. Information about major customers
The segments have built an elaborated and diversified client portfolio, both in type of clients and geographical spread.
Sales to the three major customers decreased slightly and amounted to 59,3% of total sales in AY 22/23 (AY 21/22 59,9%). Besides the top two customers, no other individual customers represent more than 10% of total sales (for current and previous accounting year). Sales to the ten major customers amount to 75,5% of total sales in AY 22/23 (AY 21/22 76,0%).
4.2. Geographical information
The Group sells its products in more than 100 countries across the world. The table below gives an overview of sales by customer location.
/ 245 Segment information AY 21/22 Continuing operations Fresh Long Fresh Eliminations (1) Unallocated (2) Consolidated €'000 €'000 €'000 €'000 €'000 Sales 3 610 027 793 431 -2 921 - 4 400 537 Third party sales 3 607 390 793 148 - - 4 400 537 Intersegment sales 2 638 284 -2 921 -Adjusted EBITDA 101 894 65 759 - -1 116 166 537 Total assets at 31 March 2022 1 210 320 583 500 -24 295 128 013 1 897 538
Sales AY 22/23 AY 21/22 Germany 29,5% 30,3% The Netherlands 27,0% 27,9% Belgium 14,4% 14,5% The United Kingdom 5,6% 5,9% France 4,2% 4,2% Other - Europe 13,3% 11,9% Other - non-Europe 5,9% 5,3% TOTAL 100% 100%
The table below shows the geographical spread of non-current assets. Non-current assets as shown below do not include goodwill, other financial assets and deferred tax assets.
5. Notes to the consolidated income statement
5.1. Sales
Sales fully relate to contracts with customers and can be disaggregated based on the type of goods and services delivered, being sales related to fresh, frozen and prepared goods. The sales of both frozen and prepared goods are allocated to the Long Fresh segment.
Fresh sales, which increased with 5,7% in AY 22/23, comprise the sale of high-quality top, tropical, citrus and stone fruit, vegetables, salads, fresh-cut flower products and related services.
Frozen sales, which increased with 15,2% in AY 22/23, are based on the processing of freshly-harvested vegetables and fruits into frozen food products that are easy to store, conserve and consume. Greenyard offers a wide range of innovative and high-quality frozen vegetables, fruits, vegetable mixes, convenience products and herbs.
Prepared sales increased with 0,4% in AY 22/23. Note however that Greenyard Prepared Netherlands was sold in the course of AY 21/22. Adjusting like-for-like leads to a sales growth of 17,4% in AY 22/23. Prepared sales comprise the sale of freshly-preserved fruit, vegetables and other ambient food products that are easy to store and ready to eat. Greenyard offers customers an extensive product portfolio, from classic preserved products in cans or jars to ready-made soups, sauces, dips and pasta dishes in a variety of packaging.
The performance obligations relating to the sales are satisfied at a point in time determined by the incoterms. For sales of fresh goods, the performance obligation is predominantly satisfied at the moment the customer accepts the goods at its premises. For frozen and prepared sales, the incoterms vary from ‘ex-work’ to ‘delivered duty paid’. In the event of quality issues, the goods are not accepted or can be returned.
CONTENTS | CONTENTS FINANCIAL REPORT 246 /
Sales AY 22/23 AY 21/22 €’000 €’000 Fresh 3 814 525 3 607 390 Frozen 615 319 533 954 Prepared 260 267 259 194 Long Fresh 875 585 793 148 TOTAL 4 690 110 4 400 537
Geographical spread of non-current assets 31 March 2023 31 March 2022 €'000 €'000 Belgium 220 630 228 126 The Netherlands 152 939 153 981 The United Kingdom 65 220 67 926 Germany 83 299 83 806 Poland 75 989 71 405 France 55 969 58 034 Other 59 044 55 908 TOTAL 713 091 719 186
5.2. Operating expenses
(*) Contain personnel expenses, depreciation and other direct operating expenses.
Depreciation and amortisation expenses included in the cost of sales amount to € 67,4m (AY 21/22 € 62,6m) of which € 26,0m is related to right-of-use assets. The depreciation expenses in selling, marketing and distribution and general and administrative expenses amount to € 34,0m (AY 21/22 € 37,2m) of which € 8,0m is related to right-of-use assets. At the same time, application of IFRS 16 had a positive impact on the rent expenses for an amount of € 40,7m (AY 21/22 € 40,7m). Note that, after the implementation of a new IFRS 16 calculation tool, the allocation of depreciation and amortization on right-of-use asset and rent reversals to cost of sales and overhead expenses has been improved, which explains the shift between both categories.
The increase in cost of sales, personnel and utility costs is mainly driven by inflation impacting Greenyard significantly in cost of produce, transport, personnel, packaging and energy. For further details on the personnel expenses, we refer to note 5.3. Personnel expenses
/ 247
Operating expenses AY 22/23 AY 21/22 €’000 €’000 Cost of goods 3 323 709 3 145 042 Transport 328 725 287 176 Packing, warehousing and farming 337 760 288 894 Depreciation - Transport 940 452 Depreciation - Packing, warehousing and farming 66 441 62 179 Personnel and temporary workforce costs 288 623 278 746 Other 49 211 43 214 Cost of sales (*) 4 395 409 4 105 703 Rentals 2 951 12 Maintenance and repair 3 749 4 071 Personnel expenses 161 439 155 269 Utilities 6 880 3 865 Travel and representation 5 421 3 759 Office expenses 2 271 2 370 Fees 15 711 16 869 Insurance 4 461 4 748 Information and communication technology 11 189 10 395 Depreciation 33 976 37 197 Quality 301 279 Indirect tax 5 153 4 679 Other 8 896 8 005 Selling, marketing and distribution & general and administrative expenses 262 398 251 517 TOTAL 4 657 807 4 357 221
5.3. Personnel expenses
The total number of full-time equivalents (FTEs) as of 31 March 2023 amounted to 8 033 (including temporary staff), compared to 8 455 as of 31 March 2022. This decrease is mainly due to reorganizations in the Fresh segment to strengthen its position and adapt to changes in the market. Despite the decrease in FTE, the salary cost increased due to indexation of wages and salaries consequent to the inflationary environment. The average number of FTEs during AY 22/23 amounted to 8 469, which is a decrease of 304 FTE compared to AY 21/22.
5.4. Other operating income/expense
The higher indemnities recovery in AY 22/23 is almost entirely related to the recovery of previous years’ contributions related to water management in Long Fresh and a received indemnity from a dispute with a former employee in Fresh. The gain on disposal of property, plant & equipment relates largely to the sale of land in the Long Fresh segment.
During AY 21/22 Greenyard finalised the sale of Greenyard Prepared Netherlands and Bardsley Fruit Enterprises for a consideration of respectively € 17,0m and £ 4,2m. After deduction of transaction related expenses, a loss was accounted for on the sale of Prepared Netherlands ad € 0,3m while a gain was realized for an amount of € 3,0m on the sale of Bardsley Fruit Enterprises.
CONTENTS | CONTENTS FINANCIAL REPORT 248 /
Other operating income/expenses (-) AY 22/23 AY 21/22 €'000 €'000 Income from rentals 3 706 3 058 Indemnities recovery 5 848 2 177 Grants 976 1 061 Sale of waste 1 752 1 326 Recharge costs 2 188 1 929 Gain/loss (-) on disposal of property, plant & equipment 1 245 555 Result on sale of subsidiaries - 2 653 Other 249 1 717 TOTAL 15 963 14 475
Personnel expenses AY 22/23 AY 21/22 €'000 €'000 Wages and salaries 256 052 246 580 Social security costs 44 677 43 735 Pension costs - defined benefit plans 315 402 Pension costs - defined contribution plans 5 100 5 843 Termination benefits 677 438 Temporary workforce 121 352 117 701 Other employee benefit expenses 21 889 19 317 TOTAL 450 062 434 015 Included within cost of sales 288 623 278 746 Included within selling, marketing and distribution & general and administrative expenses 161 439 155 269
5.5. Net finance income/cost
The convertible bond loan has been repaid at maturity date in December 2021 with the drawing of a second term loan as stipulated in the refinancing of March 2021. Further, a lease and lease back transaction was concluded in June 2022, generating € 89,9m proceeds, which have been fully used to repay a part of the outstanding bank debt (see Note 6.16. Interest-bearing loans). As such, there was a shift in interest expenses from interests on the convertible bond loan to interest expenses on bank borrowings and the lease and lease back in AY 22/23. Interest expenses of bank borrowings and factoring were also impacted by the increased working capital needs in the current inflationary environment and rising interest rates.
The increased amortization of the transaction costs on term loans and revolving credit facilities in AY 22/23 is due to the accelerated amortization of the remaining unamortized transactions costs as a result of the debt extinguishment of the amended and restated Facilities Agreement signed on 29 March 2021 which was followed by the signing of a new Facility Agreement in September 2022 for a total amount of € 420m (see Note 6.16. Interest-bearing loans).
Foreign exchange losses in AY 22/23 were limited. Further, a fair value gain has been incurred in AY 22/23 originating from the change in fair market value of an interest rate swap contract related to factoring which is not designated as a hedging instrument (see Note 6.18. Risk management description).
/ 249
Net finance income/cost (-) AY 22/23 AY 21/22 €’000 €’000 Interest expense - convertible bond 5 -3 404 Interest expense - bank borrowings -14 369 -8 977 Interest expense - Lease & lease back -1 105Amortisation transaction costs - convertible bond - -461 Amortisation conversion option - -2 007 Amortisation transaction costs - term loan / revolving credit facility -3 147 -1 037 Amortization Debt Issuance Expenses LLB -87Interest expense - factoring -12 970 -5 119 Interest expense - IRS -675 -23 Interest expense - Leasing -10 686 -9 527 Other -226 -139 Interest expense -43 261 -30 696 Interest income 900 221 Interest income 900 221 Foreign exchange gains/losses (-) 561 -1 890 Fair value gains/losses (-) on IRS 8 075Bank and other financial income/cost (-) -696 -2 057 Other finance result 7 940 -3 947 TOTAL -34 422 -34 422
5.6. Income tax expense/income
For a detailed discussion please refer to note
6.7. Deferred tax assets and liabilities
Income tax for AY 22/23 amounts to € 5,0m (AY 21/22 €7,0m). This implies a consolidated effective tax rate of 34,99% (AY 21/22 29,27%). The tax accruals for the current year result from the improved/increased profit before tax positions of several tax-paying entities within the Group. On the other hand, tax loss consolidation has been utilized in some jurisdictions and deferred tax assets have been created on losses in other jurisdictions based on the ability to offset them against taxable profits in the foreseeable future. The key item contributing to the increase in non-deductible items is the permanent differences on account of the lease and leaseback transaction undertaken in June 2022. Income not subject to tax largely relates to one-off transaction settlements of previous years.
CONTENTS | CONTENTS FINANCIAL REPORT 250 /
Income tax expense (-)/income AY 22/23 AY 21/22 €'000 €'000 Current tax on profits for the year -12 260 -12 181 Adjustments in respect of prior years 929 -766 Current tax -11 331 -12 947 Origination and reversal of temporary differences 742 5 692 Deferred tax assets on tax losses and forfeited losses 5 590 270 Deferred tax 6 332 5 963 TOTAL -4 999 -6 984 Effective tax rate reconciliation AY 22/23 AY 21/22 €'000 €'000 Result before taxes (profit/loss (-)) 14 287 23 861 Theoretical tax rate 25% 25% Tax calculated at statutory Belgian tax rate applicable to profits -3 572 -5 965 Tax effects of: Effect of different tax rates in other countries 31 48 Income not subject to income tax 1 952 919 Non-deductible items -6 018 -441 Non-recognised deferred tax assets on tax losses and forfeited losses -7 306 -3 656 Recognition of deferred tax assets not previously recognised 7 358 1 250 Use of deferred tax assets not previously recognised 327 790 Adjustments in respect of prior years 1 024 -707 Nominal tax rate changes 820 -81 Other 384 858 Effective income tax expense (-)/ income -4 999 -6 984 Effective tax rate 34,99% 29,27%
5.7. Earnings per share
(-) attributable to the shareholders of the Group (in €'000):
Earnings per share (EPS) is the amount of post-tax profit attributable to each share. Basic EPS is calculated as the result for the period attributable to the shareholders of the Group divided by the weighted average number of shares outstanding during the year. The weighted average number of shares outstanding is calculated taking into account the treasury shares acquired as part of buyback programs and distributed treasury shares following the exercise by certain beneficiaries of the share option plan of 2017 (1 843 840 as per 31 March 2023). Diluted EPS reflects any commitments the Group has made to issue shares in the future which comprise of potential share-based awards (see note 6.13. Share based compensation):
Dilutive share based awards affect the denominator and represent the weighted average number of ordinary shares that would be issued on conversion of all the dilutive potential ordinary shares into ordinary shares.
/ 251
AY 22/23 Basic Diluted Weighted average number of ordinary shares 49 638 500 49 638 500 Dilution effect of share based compensation - 493 127 Total 49 638 500 50 131 627 Profit/loss (-) attributable to the shareholders of the Group (in €'000): Continuing operations 7 822 7 822 Discontinued operations -Earnings per share (in € per share) 0,16 0,16 AY 21/22 Basic Diluted Weighted average number of ordinary shares 49 921 369 49 921 369 Dilution effect of share based compensation - 706 966 Dilution effect of convertible bond (issued in December 2016) -Total 49 921 369 50 628 335 Profit/loss
Continuing operations 16 018 16 018 Discontinued operations -Earnings per share (in € per share) 0,32 0,32
6. Notes to the consolidated statement of financial position
6.1. Property, plant & equipment
CONTENTS | CONTENTS FINANCIAL REPORT 252 /
Property, plant & equipment AY 22/23 Land and buildings Plant, machinery and equipment Furniture and vehicles Assets under construction TOTAL €'000 €'000 €'000 €'000 €'000 ACQUISITION VALUE Balance at 31 March 2022 265 786 595 240 65 423 19 476 945 925 Additions 1 798 20 110 11 479 24 059 57 446 Sales and disposals -1 401 -8 407 -1 000 -8 -10 815 Transfer from one heading to another 2 083 11 547 200 -13 833 -3 Translation differences -1 330 -2 358 -73 -215 -3 976 Balance at 31 March 2023 266 936 616 133 76 029 29 479 988 576 DEPRECIATION AND IMPAIRMENT LOSSES Balance at 31 March 2022 153 580 427 436 52 062 17 633 095 Depreciation 8 363 32 742 5 652 - 46 757 Reversals after sales and disposals -773 -8 084 -912 - -9 770 Transfer from one heading to another - - -4 - -4 Translation differences -449 -1 312 -165 - -1 926 Balance at 31 March 2023 160 721 450 782 56 633 17 668 152 Net carrying amount at 31 March 2023 106 215 165 351 19 396 29 462 320 423
Property, plant & equipment increased by € 7,6m during AY 22/23, which is the combined effect of € 57,4m additions, offset by (i) € 46,8m depreciation, (ii) € 2,0m decrease from foreign exchange rate fluctuations and (iii) other miscellaneous movements.
The additions in AY 22/23 in the Fresh segment, mainly relate to new trailers and trucks as well as new banana ripening cells and further investments in the citrus packaging line. In Long Fresh, the investments mainly concern a new sauce unit as well as replacement/ improvement capital expenditures in the production facilities.
/ 253 Property, plant & equipment AY 21/22 Land and buildings Plant, machinery and equipment Furniture and vehicles Assets under construction TOTAL €'000 €'000 €'000 €'000 €'000 ACQUISITION VALUE Balance at 31 March 2021 285 100 604 395 62 787 23 907 976 189 Additions 1 283 15 155 5 754 22 131 44 324 Sales and disposals -2 -3 113 -1 251 -33 -4 398 Change in scope: disposal of subsidiaries -24 455 -44 596 -2 335 -237 -71 623 Transfer from one heading to another 3 540 22 378 325 -26 408 -165 Translation differences 320 1 021 143 115 1 598 Balance at 31 March 2022 265 786 595 240 65 423 19 476 945 924 DEPRECIATION AND IMPAIRMENT LOSSES Balance at 31 March 2021 156 407 440 790 50 238 17 647 451 Depreciation 8 926 31 602 4 683 - 45 211 Impairment losses - - - -Reversals after sales and disposals -2 -2 796 -1 041 - -3 839 Change in scope: disposal of subsidiaries -12 531 -42 190 -1 916 - -56 636 Transfer from one heading to another 675 -598 -8 - 70 Translation differences 106 627 106 - 839 Balance at 31 March 2022 153 580 427 436 52 062 17 633 095 Net carrying amount at 31 March 2022 112 205 167 805 13 361 19 458 312 830
6.2. Goodwill
The Group tests the goodwill for impairment annually and when there are indications that the value of goodwill has decreased. The Group’s impairment test for goodwill is based on value-in-use calculations which are, in turn, based on a discounted cash flow model.
In AY 18/19, the goodwill related to the Long Fresh segment of € 78,9m was fully impaired and thus the remaining goodwill of € 477,5m relates to the Fresh segment.
At 31 March 2023, the Group performed its annual impairment test for the Fresh segment. The recoverable amount has been determined based on a value-in-use calculation of cash flow projections from the financial budget of AY 23/24 and long-range plan for the subsequent financial periods until AY 26/27 (together referred to as ‘LRP’), in conjunction with a perpetuity of cash flows to determine terminal value.
The revised BUD/LRP takes into account a margin improvement resulting in an expected average yearly adjusted EBITDA margin post IFRS 16 of 2,7% (which is an increase from 2,6% to 2,9% over the period AY 22/23 - AY 26/27 with a 2,9% EBITDA margin in terminal value) and an average sales growth of 6,0% (over the period AY 22/23 - AY 26/27, mainly due to growth of business with our customers in the ICR model). The value in use is based on cash flow forecasts over a period of four years, in conjunction with a perpetuity of cash flows as of then with a growth rate of 1,5%. Cash flows are discounted at an after-tax discount rate of 7,0% which was benchmarked with the weighted average cost of capital (WACC) provided by the analysts. Note that the risk free rate was increased with 30bp to take the rising interest rates into account. The results of this test have shown that the value in use exceeds the carrying value of the cash flow generating unit (the 'headroom') by € 224,5m.
The major sensitivities for the impairment tests are the sales growth rate, the adjusted EBITDA growth rate and the discount rate. This headroom would reduce to zero (keeping other key parameters constant) if the yearly sales growth rates applied in calculating the value in use were to fall by 197 base points (to an average yearly sales growth of 4,05% and a perpetual sales growth rate of -0,47%), or the yearly adjusted EBITDA growth rates were to fall by 464 base points (reducing the average yearly adjusted EBITDA growth to 9,5% and the perpetual adjusted EBITDA margin to 1,7%) or if the after-tax discount rate was to rise by 292 base points (or a rate of 9,92%) in all periods until AY 26/27 and thereafter. Based on the above assumptions the Group has concluded that no impairment losses need to be recorded at 31 March 2023 on the goodwill of the Fresh segment.
At 31 March 2022, the applied methodology was similar to the one discussed above.
The key parameters of the impairment test of the Fresh segment are presented below.
(1) The discount rate is calculated as the Weighted Average Cost of Capital (WACC).
CONTENTS | CONTENTS FINANCIAL REPORT 254 /
Goodwill 31 March 2023 31 March 2022 €'000 €'000 ACQUISITION VALUE Balance at the end of the preceding period 556 414 556 410 Change in scope: business combinations (note 7.1.) - 4 Balance at the end of the period 556 414 556 414 IMPAIRMENT LOSSES Balance at the end of the preceding period 78 910 78 910 Impairment losses -Balance at the end of the period 78 910 78 910 Net carrying amount at the end of the period 477 504 477 504
Goodwill impairment test - key parameters - post IFRS 16 31 March 2023 31 March 2022 Fresh Average sales growth rate 6,0% 5,2% Perpetual growth rate 1,5% 1,0% Average adjusted EBITDA margin 2,6% 2,8% Discount rate (1) 7,0% 6,8% Headroom (in € million) 224,5 281,1
6.3. Other intangible assets
The decrease in the other intangible assets of € 7,0m mainly results from amortisations of the period (€ 20,5m), partly compensated by investments (€ 13,7m) mainly related to the roll-out of the new ERP system in the Fresh segment.
Customer relationships mainly relate to the client portfolio of the Fresh segment, acquired in the business combination in AY 15/16. The portfolio has a remaining useful life of 12 years.
/ 255
Other intangible assets AY 22/23 Software and licences Customer relationships Other TOTAL €'000 €'000 €'000 €'000 ACQUISITION VALUE Balance at 31 March 2022 79 913 250 074 1 289 331 277 Additions 13 830 - -118 13 712 Sales and disposals -461 - - -461 Change in scope: disposal of subsidiaries - - -Transfer from one heading to another - - -Translation differences -15 - -26 -41 Balance at 31 March 2023 93 267 250 074 1 146 344 488 AMORTISATION AND IMPAIRMENT LOSSES Balance at 31 March 2022 56 287 89 418 1 224 146 928 Amortisation 7 183 13 285 48 20 516 Reversals after sales and disposals -227 - -3 -230 Change in scope: disposal of subsidiaries - - -Transfer from one heading to another - - -Translation differences - - -26 -26 Balance at 31 March 2023 63 243 102 702 1 243 167 188 Net carrying amount at 31 March 2023 30 024 147 372 -97 177 299 Other intangible assets AY 21/22 Software and licences Customer relationships Other TOTAL €'000 €'000 €'000 €'000 ACQUISITION VALUE Balance at 31 March 2021 73 454 250 074 1 284 324 812 Additions 6 643 - - 6 643 Sales and disposals -142 - - -142 Change in scope: disposal of subsidiaries -450 - - -450 Transfer from one heading to another 232 - - 232 Translation differences 177 - 5 182 Balance at 31 March 2022 79 913 250 074 1 289 331 277 AMORTISATION AND IMPAIRMENT LOSSES Balance at 31 March 2021 48 944 76 133 938 126 014 Amortisation 7 533 13 285 281 21 098 Reversals after sales and disposals -120 - - -120 Change in scope: disposal of subsidiaries -222 - - -222 Transfer from one heading to another -1 - - -1 Translation differences 153 - 4 158 Balance at 31 March 2022 56 287 89 418 1 224 146 928 Net carrying amount at 31 March 2022 23 626 160 656 65 184 348
6.4. Leases
The group leases many assets including land and buildings, vehicles, machinery and IT equipment.
The right-of-use assets decreased by € -7,2m over AY 22/23 mainly as a result of € 9,0m additions which are offset by € -34,1m depreciation and other movements for an amount of € 17,9m. The additions in AY 22/23 mainly relate to new trucks, forklifts and trailers. Other movements almost entirely consist of remeasurements of right-of-use assets following the significant index increases all across Europe (€ 16,1m). During the accounting year, a new lease accounting software was implemented. During this migration, non-material errors were identified with respect to prior periods. The corrections hereon were also included in other movements of the right-of-use assets.
The maturity analysis of lease liabilities is disclosed in note 6.18. Risk management policy.
The total cash outflow for leases in AY 22/23 amounted to € 41,9m.
CONTENTS | CONTENTS FINANCIAL REPORT 256 /
Right-of-use assets 31 March 2023 Land and buildings Plant, machinery and equipment Furniture and vehicles TOTAL €'000 €'000 €'000 €'000 Balance at 31 March 2022 197 225 6 630 8 351 212 206 Additions 634 2 551 5 828 9 012 Depreciation -25 830 -2 809 -5 446 -34 084 Other movements 14 126 476 3 314 17 916 Balance at 31 March 2023 186 155 6 848 12 047 205 049 Right-of-use assets 31 March 2022 Land and buildings Plant, machinery and equipment Furniture and vehicles TOTAL €'000 €'000 €'000 €'000 Balance at 31 March 2021 200 669 8 169 11 448 220 286 Additions 11 711 1 592 3 469 16 772 Depreciation -24 612 -3 224 -6 114 -33 950 Other movements 9 457 92 -451 9 098 Balance at 31 March 2022 197 225 6 630 8 351 212 206
Lease liabilities 31 March 2023 31 March 2022 €’000 €’000 Non-current 200 810 202 612 Current 30 445 29 386 TOTAL 231 254 231 998
Amounts recognised in the income statement 31 March 2023 31 March 2022 €’000 €’000 Depreciation 34 084 33 950 Interest on lease liabilities 10 686 9 527 Expenses relating to short-term leases 3 050 1 301 Expenses relating to leases of low-value assets 240 89 TOTAL 48 061 44 866
6.5. Investments accounted for using equity method
The movement in the investments accounted for using the equity method can be detailed as follows:
using equity method
Summarized financial information of the company’s joint-ventures and associates is as follows:
(1) Figures at 31 December
There are no contingent liabilities relating to the Group’s interest in the associates or joint ventures incurred jointly with other investors, and none arising because the investor is severally liable for all or part of the liabilities of the associate or joint venture.
/ 257
Name of investment Description of interest Type of investment 31 March 2023 31 March 2022 Grupo Yes Procurement Marketing SL Procurement of fruit and vegetables for export purposes in Spain Joint venture 50% 50% Logidis Sistem SL Bundling transport of fresh products using subcontractors in Spain Joint venture 50% 50% Ekho Fresh Ltd. The sale and distribution of fruits and vegetables in the UK Associate 49% 0% Agritalia Srl Bio certified cooperative with growers network across Italy Associate 33% 33%
Investments accounted for
AY 22/23 AY 21/22 €'000 €'000 Balance at the end of the preceding period 8 206 7 679 Share of profit/loss (-) 443 492 Other changes 1 35 Balance at the end of the period 8 650 8 206
Investments accounted for using equity method - at 31 March Assets Liabilities Net assets 2023 2022 2023 2022 2023 2022 €'000 €'000 €'000 €'000 €'000 €'000 Grupo Yes Procurement Marketing SL 17 296 12 426 5 063 1 116 12 233 11 310 Logidis Sistem SL 10 057 7 208 7 557 4 806 2 500 2 402 Ekho Fresh Ltd. 24 - 91 - -67Agritalia Srl(1) 2 440 3 209 2 140 2 802 300 408 Investments accounted for using equity method Sales Expenses Profit after tax AY 22/23 AY 21/22 AY 22/23 AY 21/22 AY 22/23 AY 21/22 €'000 €'000 €'000 €'000 €'000 €'000 Grupo Yes Procurement Marketing SL 36 098 20 747 35 175 19 924 923 823 Logidis Sistem SL 25 449 17 964 25 351 17 805 98 159 Ekho Fresh Ltd. 153 - 221 - -68Agritalia Srl(1) 7 840 11 384 7 940 11 351 -100 33
6.6. Other financial assets and liabilities
In September 2022, the group entered into € 287,4m of interest rate swaps, hedging the primary indebtedness, and € 212,3m of interest swaps, hedging its factoring exposure (hedging of approx. 75% of estimated average indebtedness throughout the year). Furthermore, it concluded a forward-starting 3-year interest rate swap from December 2024 onwards for respective amounts of € 147,8m and € 151,2m (hedging of approx. 50% of estimated average indebtedness throughout the year).
The interest rate swaps convert the rate of the interest rate exposed instruments from variable to fixed and are concluded with highly rated counterparties. In the first two years the interest is set at about 1,65% and the next three years at a rate of about 2,2%. The interest rate swap hedging the primary indebtedness is based on the three-month EURIBOR benchmark rate and has a fair value of € 8,8m as of 31 March 2023 while the interest rate swap hedging the factoring exposure is based on the one-month EURIBOR benchmark rate and has a fair value of € 8,1m as of 31 March 2023.
The interest rate swap hedging the primary indebtedness is designated as a hedging instrument and therefore hedge accounting was applied hereon. The IRS linked to the factoring exposure is not designated as a hedging instrument and therefore no hedge accounting was applied hereon. Consequently, this instrument is recognized at fair value through the income statement (see ‘other financial result’).
The forward agreements relate to fx forwards for which the increase in liabilities is almost entirely driven by USD forwards.
6.7. Deferred tax assets and liabilities
CONTENTS | CONTENTS FINANCIAL REPORT 258 /
Deferred taxes (net carrying amount) 31 March 2023 31 March 2022 Deferred tax assets Deferred tax liabilities Deferred tax assets Deferred tax liabilities €'000 €'000 €'000 €'000 Balance at the end of the preceding period 21 152 30 437 18 061 32 268 Increase/decrease (-) via income statement 23 712 17 380 1 568 -4 395 Increase/decrease (-) via equity -2 720 207 -596 423 Change in scope: disposal of subsidiaries - - -1 752 -1 890 Translation differences -15 52 -138 23 Set-off of assets and liabilities -10 575 -10 575 4 008 4 008 Balance at the end of the period 31 554 37 501 21 152 30 437
Other financial assets and liabilities 31 March 2023 31 March 2022 Assets Liabilities Assets Liabilities €'000 €'000 €'000 €'000 IRS - cash flow hedging 16 852 - -Non-current derivatives 16 852 - -Forward agreements - held-for-trading 14 - 16Forward agreements - cash flow hedges 441 1 278 306 370 Current derivatives 455 1 278 322 370 Equity investments - - -TOTAL 17 307 1 278 322 370
The deferred tax liability on derivatives relates to interest rate swaps while a significant portion of the movement of deferred taxes on Property, Plant and equipment, interest bearing loans and non-current liabilities is a result of the lease and lease back transaction undertaken in June 2022. The total amount of fiscal losses for which a deferred tax asset has been set up amounts to € 88,6m (gross) at 31 March 2023 (AY 21/22: € 74,5 m). These losses mainly relate to tax losses originated in Belgium, Austria and Germany.
/ 259 Deferred taxes (allocation) 31 March 2023 31 March 2022 Deferred tax assets Deferred tax liabilities Deferred tax assets Deferred tax liabilities €'000 €'000 €'000 €'000 Intangible assets and property, plant & equipment 28 132 34 997 14 184 42 339 Derivatives 209 4 213 16Interest-bearing loans 2 775 67 114Inventories - 3 244 - 3 093 Trade and other receivables 291 60 300 127 Provisions 3 391 12 4 400 12 Current liabilities 132 - 530 23 Non-current liabilities - 20 639 -Fiscal losses and other tax credits 23 417 - 17 827Tax reserves - 1 064 - 1 064 Total deferred taxes related to temporary differences 58 348 64 295 37 371 46 656 Set-off of assets and liabilities -26 794 -26 794 -16 219 -16 219 Net deferred tax assets/liabilities 31 554 37 501 21 152 30 437
Maturity date of unrecognised fiscal losses and other tax credits (gross) AY 22/23 AY 21/22 €'000 €'000 Within one year 434 3 227 Between one and five years 23 356 8 427 Indefinite 220 361 155 895 TOTAL 244 150 167 549 Country- wise break up of unrecognised fiscal losses and other tax credits (gross) AY 22/23 Country €'000 Austria 42 525 Belgium 33 425 Germany 54 524 France 49 430 Netherlands 35 261 Peru 18 Poland 23 771 UK 5 197 TOTAL 244 150
6.8. Inventories
Raw materials and consumables mainly include fresh fruit, vegetables and packing materials. Fresh fruit and vegetables are either used for trading (Fresh segment) or for processing (Long Fresh segment).
Work in progress and finished goods mainly relate to the Long Fresh segment. Work in progress includes frozen vegetables which are stored in bulk (not yet packed).
The increase in inventories, which is mainly driven by the Long Fresh segment, is primarily attributed to the effects of inflation and to a limited extent higher volumes.
A part of inventories is pledged under the Group’s current financing programs. We refer to note 7.3. Off-balance sheet commitments for further detail hereon.
6.9. Trade and other receivables
Trade receivables relate fully to sales from contracts with customers. The payment terms for the sale of fresh goods vary but the majority are 60 days. For the sale of frozen and prepared goods, the payments terms vary to a maximum of 120 days.
The other receivables mainly relate to VAT, other recoverable taxes and deposits. Prepaid expenses and accrued income mainly relate to prepayments on maintenance contracts, rent and IT costs. Prepayments comprise prepayments to growers and suppliers.
Management believes that the fair value does not differ significantly from the carrying value.
CONTENTS | CONTENTS FINANCIAL REPORT 260 /
Trade and other receivables 31 March 2023 31 March 2022 €'000 €'000 Trade receivables 99 99 Valuation allowances on trade receivables -99 -99 Trade receivables net -Other receivables 305 243 Guarantee deposits 807 665 Prepayments 557 687 Other receivables net 1 670 1 596 Non-current 1 670 1 596 Trade receivables 162 205 170 633 Valuation allowances on trade receivables -3 830 -4 924 Trade receivables net 158 375 165 709 Other receivables 54 433 46 061 Prepaid expenses and accrued income 13 220 16 343 Prepayments 12 984 11 560 Other receivables net 80 637 73 965 Current 239 012 239 674
Inventories 31 March 2023 31 March 2022 €'000 €'000 Raw materials and consumables 50 402 38 268 Work in progress and finished goods 324 980 302 929 TOTAL 375 382 341 197
A major part of trade and other receivables are pledged under the Group’s current financing and factoring programs. For more information, refer to note 7.3. Off-balance sheet commitments
Ageing analysis of trade receivables and valuation allowances
The valuation allowances on trade and other receivables are determined by management. When amounts are more than 30 days overdue, an estimation is made with regard to recoverability and, if relevant (bankruptcy, etc.), an appropriate provision is recorded. No valuation allowances are taken by the Group for overdue amounts where collection is still deemed probable, for example, because outstanding amounts are recoverable from credit insurance, tax authorities or because the Group holds sufficient securities.
The Group’s exposure to credit risks is described in note 6.18. Risk management policy.
Current and non-current trade and other receivables in foreign currencies
Factoring
Most of the Group’s subsidiaries benefit from a multi-country syndicated factoring agreement. In accordance with the syndicated factoring agreement, undisputed trade receivables are sold to certain commercial finance companies on a basis which is non-recourse, including the receivables of the ten largest customers, to the extent the Group is not making use of their supply chain financing program. The financing obtained through the factoring has an off-balance character (see also note 3.1. Critical judgments in applying the entity’s accounting policies). The syndicated factoring agreement also contains a negative pledge (meaning that the receivables can only be sold to the syndicate of commercial finance companies), a maximum dilution ratio (meaning that at least 95% of the payments should be on the bank account of the syndicate of commercial finance companies), and a leverage test (the test used for the Facilities Agreement).
/ 261
Ageing of trade receivables 31 March 2023 31 March 2022 Gross Valuation allowances Net Gross Valuation allowances Net €'000 €'000 €'000 €'000 €'000 €'000 Not overdue 88 387 -16 88 371 60 975 -154 60 821 Overdue less than 30 days 61 514 -38 61 476 88 557 - 88 557 Overdue between 30 and 60 days 7 384 -26 7 358 10 048 -63 9 985 Overdue more than 60 days 4 921 -3 751 1 170 11 053 -4 707 6 346 TOTAL 162 205 -3 830 158 375 170 633 -4 924 165 709
Valuation allowances on short-term receivables AY 22/23 AY 21/22 €000 €000 Balance at the end of the preceding period -4 924 -5 797 Additions -739 -530 Non-recoverable amounts (use) 195 193 Reversals 1 639 1 210 Balance at the end of the period -3 830 -4 924
Trade and other receivables: foreign currencies 31 March 2023 31 March 2022 €'000 €'000 GBP 16 979 17 646 USD 19 422 19 027 PLN 6 388 6 411 CZK 5 523 5 323 Other 7 527 8 068
Subsidiaries in the United Kingdom, France, Germany, the Netherlands, Italy, Austria, Poland, Spain and Belgium participate in the syndicated factoring program which is subject to an overall maximum program amount of € 375,0m. This maximum program amount is the maximum that can be drawn for the Group, subject to the receivables sold to the factoring syndicate.
Apart from the multi-country syndicated factoring programme mentioned earlier, only one US entity entered into a bilateral factoring agreement.
Factoring is used when the transferred receivables are subject to credit insurance through credit insurers with at least an investment grade rating, since the syndicate of commercial finance companies bears the ultimate credit risk.
As at 31 March 2023, € 309,5m of financing had been obtained through the multi-country syndicated factoring program (€ 294,3m as at 31 March 2022). The late-payment risk related to the factoring has been assessed as immaterial.
In accordance with IFRS 9 Financial instruments: Recognition and Measurement, all non-recourse trade receivables, included in these factoring programs, are derecognised for the non-continuing involvement part (also see note 3.1. Critical judgments in applying the entity’s accounting policies and note 6.18 Risk management policy).
6.10. Cash & cash equivalents and bank overdrafts
6.11. Financial instruments by category
CONTENTS | CONTENTS FINANCIAL REPORT 262 /
Cash and cash equivalents and bank overdrafts 31 March 2023 31 March 2022 €'000 €'000 Cash and cash equivalents 119 357 98 504 Bank overdrafts -1 -478 TOTAL 119 356 98 025
The cash & cash equivalents are held at reputable banks.
Financial assets by category at Assets at amortised cost Assets at fair value through profit and loss Derivatives used for hedging TOTAL 31 March 2023 Note €'000 €'000 €'000 €'000 Equity investments 6.6. - - -Derivatives 6.6. - 8 089 9 219 17 307 Trade and other receivables excluding prepayments 6.9. 227 140 - - 227 140 Cash and cash equivalents 6.10. 119 357 - - 119 357 TOTAL 346 497 8 089 9 219 363 805 Financial assets by category at Assets at amortised cost Assets at fair value through profit and loss Derivatives used for hedging TOTAL 31 March 2022 Note €'000 €'000 €'000 €'000 Equity investments 6.6. - - -Derivatives 6.6. - 16 306 322 Trade and other receivables excluding prepayments 6.9. 229 022 - - 229 022 Cash and cash equivalents 6.10. 98 504 - - 98 504 TOTAL 327 526 16 306 327 847
6.12. Issued capital, share premium and other capital instruments Share capital and share premium
The Board of Directors is authorised, for a period of five years as from 17 October 2019 (the date the resolutions of the Extraordinary Shareholders’ Meeting of 20 September 2019 were published in the Belgian Official State Gazette) to increase the capital of the Company in one or more instalments up to a maximum amount equal to the share capital amounting to € 293 851 765. As the Board of Directors increased the share capital by € 50,0m on 26 March 2021, the amount remaining available for a capital increase within the framework of the authorized capital is equal to € 243 851 759.
(1) As per the bylaws of Greenyard NV. There were no movements in the issued capital during AY 22/23. All shares are without par value.
Treasury shares
As stipulated in article 12 of Greenyard’s articles of association, the Board of Directors is explicitly authorised to acquire, during a five-year period counting from the date of the Extraordinary Shareholders’ Meeting of 15 September 2017, and within the limits of the law, whether on or outside the stock exchange, directly or indirectly, by way of purchase or exchange, contribution or any other way of acquisition, the maximum number of Company’s shares permitted by law, without requiring Shareholders’ Meeting’s approval or resolution. In AY 17/18, the Group bought back 1 750 000 treasury shares for an amount of € 30,0m. In AY 21/22 the Group bought back 600 000 shares and granted 21 000 treasury shares in the context of the partial exercise of the 2019 SOP. In AY 22/23 the Group granted 99 014 treasury shares in the context of the partial exercise of the 2019 SOP. As per 31 March 2023 the Group holds 1 843 840 treasury shares, representing 3,6% of the total shares (per 31 March 2022 the group held 1 942 854 treasury shares, representing 3,8% of the shares).
6.13. Share based compensation Performance Share Units
On the recommendation of the Remuneration Committee, on 31 May 2017, the Board of Directors approved the Long Incentive (LTI) Performance Share Plan for Greenyard NV (the Plan). The Plan awarded in 2017 (“Series 2017”) and 2018 (“Series 2018”) the Leadership Team and other key persons at Greenyard (the Beneficiaries) performance share units (PSUs) which are optional constructions granting the beneficiaries Greenyard shares. The number of shares granted to beneficiaries depends on total shareholder return (TSR) increase over a 3-year period (the performance period) times a performance factor. The TSR at the end of the performance period is calculated as follows: average share price during the period 15 May – 14 June preceding the end date of the performance period, minus the average share price at the start of the performance period, plus the dividends per share distributed by Greenyard during the performance period. As of AY 19/20, no new Performance Share Units were granted under the existing long-term incentive Performance Share Units Plan (PSU Plan), in view of the implementation of the 2019 Stock Option Plan which replaced the PSU Plan as long-term incentive plan.
TSR increase >=10% per year
5% per year>= TSR increase < 10% per year 1,5
0% >= TSR increase < 5% per year 1,0
TSR increase < 0% -
Because of the pay structure of PSUs (including averages of closing prices at the maturity of the structure), the economic value must be valued using numerical techniques. Monte-Carlo simulations using geometric Brownian motion assumptions were used to value the PSUs. The estimation for the relevant implied volatility assumption is based on benchmarking techniques considering the premium of listed equity options with comparable maturities. As a result, volatilities assumptions used were 21,3% for the Series 2017 and 20,9% for the Series 2018.
/ 263
Performance condition Number of shares granted per PSU
2,0
Share capital Number of shares Statutory amount (1) Capitalized transaction costs Group amount €'000 €'000 €'000 Balance at 31 March 2022 51 515 443 343 852 -6 160 337 692 Balance at 31 March 2023 51 515 443 343 852 -6 160 337 692
Using this valuation approach, the value per PSU for the Series 2017 was calculated at € 20,23 and for the series 2018 at € 10,49 per PSU.
The number of PSUs can be summarised as follows:
The outstanding performance shares under the PSU Plan for 2018 vested on 15 June 2021 subject to realisation of the performance condition, after which date, all performance shares expired.
Based on the value calculated at grant date, the cost of the share-based payments affects the income statement and the equity, spread over the 3-year vesting period. In the event of PSUs being forfeited, the cost for the remainder of the vesting period impacts the income statement in the period when the PSUs are forfeited.
Stock Options
In AY20/21 the Board of Directors approved the 2021 Stock Option Plan, enabling it to grant certain stock options to selected staff members, including Leadership Team members. Stock options under the 2021 Stock Option Plan have been granted at the end of AY 20/21 (i.e. on 19 February 2021) and were accepted by the beneficiaries within 60 days after the grant date. Upon the achievement of the vesting conditions under the Plan, the options will gradually vest over a period of four years, ending on 31 March 2025. In total 910 000 options were accepted. Note that in AY21/22, 60 000 additional options were granted and 30 000 were forfeited.
On 14 March 2019, the Board of Directors approved the 2019 Stock Option Plan enabling it to grant certain stock options to selected staff members, consisting of Leadership Team members and key employees. The 2019 Stock Option Plan was applicable as from AY 19/20, upon acceptance by the beneficiaries concerned of the options granted within 60 days after the grant date. Upon the achievement of the vesting conditions under the Plan, the options were definitively acquired (vested) on 31 March 2022.
CONTENTS | CONTENTS FINANCIAL REPORT 264 /
Number of PSU's 31 March 2022 Granted AY 22/23 Forfeited AY 22/23 31 March 2023 Series 2017 - - -Series 2018 - - -TOTAL - - -Number of PSU's 31 March 2021 Granted AY 21/22 Forfeited AY 21/22 31 March 2022 Series 2017 - - -Series 2018 52 594 - -52 594TOTAL 52 594 - -52 594 -
AY 22/23 AY 21/22 Impact Income statement Equity Income statement Equity €'000 €'000 €'000 €'000 Series 2017 - - -Series 2018 - - 46 46 TOTAL - - 46 46
Number of options 31 March 2022 Granted AY 22/23 Forfeited AY 22/23 Exercised AY 22/23 31 March 2023 Plan 2019 934 000 - - -99 014 834 986 Plan 2021 940 000 - - - 940 000 TOTAL 1 874 000 - - -99 014 1 774 986 Number of options 31 March 2021 Granted AY 21/22 Forfeited AY 21/22 Exercised AY 21/22 31 March 2022 Plan 2019 955 000 - - -21 000 934 000 Plan 2021 910 000 60 000 -30 000 - 940 000 1 865 000 60 000 -30 000 -21 000 1 874 000
The average market price at the moment of exercise of the share options in AY 22/23 was € 8,87. The options granted are recognised at fair value at grant date in accordance with IFRS 2. The fair value of the options is determined using a Black Scholes pricing model.
The exercise price for the granted options in AY21/22 was €8,54
6.14. Pension and other employee benefit liabilities Defined contribution plans
For defined contribution plans, the Group pays contributions to pension funds or insurance companies. Once the contributions have been paid, the Group has no further payment obligation. These contributions constitute an expense in the year in which they are due. The contributions paid during AY 22/23 amounted to € 5,1m (AY 21/22 € 5,8m).
Belgian defined contribution plans – presented as defined benefit plans
By law, Belgian defined contribution pension plans are subject to minimum guaranteed rates of return and therefore must be considered as defined benefit plans. Pension legislation was amended at the end of 2015 and defines the minimum guaranteed rate of return as a variable percentage linked to government bond yields observed in the market from 1 January 2016 onwards. For contributions paid from 1 January 2016 onwards, the minimum guaranteed rate of return equals 1,75% on employer and employee contributions. The former rates (3,25% on employer contributions and 3,75% on employee contributions) continue to apply to contributions paid up to 31 December 2015. The minimum guaranteed rates of return did not lead to a material net obligation to be accounted for by the Group. The net obligation was estimated using individual information provided by the insurance companies, analysing the difference between the guaranteed rates of return and the return offered by the insurance companies.
Defined benefit plans and other employee benefits
The costs relative to IAS 19 provisions are recorded under personnel costs, whereas the interest component is recognised in finance costs.
The Group operates several defined benefit plans: two for employees in Germany and additional plans in Italy, France and Austria.
The actuarial valuation method used is the projected unit credit cost method. This method allocates future accruals to the year in which the benefit is earned. The sum of accruals for prior years is the liability for the present value of defined benefit obligations. The plan assets were valued using the fair value method. For the insured plans, the fair value takes into account the present value of the expected future cash flows.
/ 265
AY 22/23 AY 21/22 Impact Income statement Equity Income statement Equity €'000 €'000 €'000 €'000 Plan 2019 - -525 336 336 Plan 2021 446 446 928 928 TOTAL 446 -79 1 264 1 264
Pricing model details Stock Option Plan 2021 2019 Share price at grant date (€) 7,050 3,500 Exercise price (€)(1) 6,450 3,436 Expected volatility 55% 62% Expected dividend yield 5,67% 5,67% Vesting period 4 years 3 years Risk free interest rate -0,401% 0,106% Fair value (€) 2,411 1,090 (1)
One of the plans in which the Group participates is the Gustav Scipio Stiftung Fund (GUSS), a multi-employer defined- benefit pension fund in Germany. The assets and liabilities attributable to each member of the fund at the end of each accounting year are determined by an independent actuary, as are the contributions due from members. The ratio of contribution obligations is determined within the GUSS articles of association. Contributions are based upon the ratio of unfunded liabilities between members. Unfunded liabilities are determined as the fund liabilities minus assets allocated to members. If, according to the annual actuarial report, the Group has no further obligations to beneficiaries of the plan and ceases to be liable under the GUSS, it will be entitled to a reimbursement payment in cash minus any negative tax impact on the other members. According to the GUSS articles of association, entities are not liable for the liabilities of the other entities within the fund. In the event of a wind-up of the fund, all assets and liabilities will be split between the members in the proportions determined by an independent actuary. Such a wind-up would require the approval from the GUSS Board of Directors and the Bremen State Authority.
The Group has several other long-term benefit liabilities (e.g. jubilees) and post-employment benefit liabilities.
The net defined benefit obligation detail and movement can be summarised as follows:
CONTENTS | CONTENTS FINANCIAL REPORT 266 /
Employee benefit liabilities 31 March 2023 31 March 2022 €'000 €'000 Obligations for defined benefit plans 12 714 15 467 Obligations other employee benefits 1 021 1 209 TOTAL 13 735 16 676 Defined benefits - income statement AY 22/23 AY 21/22 €'000 €'000 Employee benefit expense 315 402 Interest expense 263 163 TOTAL 578 565
Defined benefit - amounts recognised in the statement of financial position 31 March 2023 31 March 2022 €'000 €'000 Present value of defined benefit obligation 28 697 28 562 Fair value of plan assets -15 984 -13 095 Net liability 12 714 15 467 Movement in defined benefit obligation AY 22/23 AY 21/22 €'000 €'000 Balance at the end of the preceding period 28 562 29 527 Current service cost 350 414 Interest cost 306 186 Remeasurement: • Experience gain (-)/loss 22 -609 • Gain (-)/loss due to demographic assumption changes - -2 • Gain (-)/loss due to financial assumption changes -2 846 -1 281 Benefits paid -713 -903 Curtailments/plan closures - -12 Other events 3 089 1 242 Settlements -72Balance at the end of the period 28 697 28 562
The “Other events” relates to an upgross of both the pension asset and liability of the Belgian defined contribution plans meeting the definition of a defined benefit plan, but without impact on the net liability.
The following table summarises the components of the net benefit expenses recorded either directly in equity (other comprehensive income) or in the income statement:
The actuarial assumptions and average duration of the major pension plans are detailed below:
For the major plans the sensitivity of the defined benefit obligation is as follows:
/ 267 Movement in fair value of plan assets AY 22/23 AY 21/22 €'000 €'000 Balance at the end of the preceding period 13 095 11 917 Interest income 43 24 Employer contributions 690 784 Return on plan assets (excluding interest income) -266 -107 Benefits paid from plan assets -685 -763 Other events 3 109 1 242 Balance at the end of the period 15 984 13 095
Defined benefit - development of accumulated other comprehensive income AY 22/23 AY 21/22 €'000 €'000 Experience gain (-)/loss 22 -609 Gain (-)/loss due to demographic assumption changes - -2 Gain (-)/loss due to financial assumption changes -2 846 -1 281 Return on plan assets (excluding interest income) 266 107 Total movement in other comprehensive income -2 558 -1 785 Defined benefit - expense recognised in the income statement AY 22/23 AY 21/22 €'000 €'000 Current service cost 350 414 Curtailments - -12 Other events -36Interest cost 306 186 Interest income -43 -24 Expense recognised in income statement 578 565
Principal actuarial assumptions Germany Italy 31 March 2023 31 March 2022 31 March 2023 31 March 2022 Discount rate 3,7% 1,8% 3,7% 1,8% General wage increases 1,8% 1,8% 2,9% 2,9% Inflation 2,4% 2,4% 2,4% 2,4% Average duration of pension plans 11,7 13,2 10,4 12,2
Sensitivity of defined benefit obligationmajor plans 31 March 2023 31 March 2022 DBO at discount rate Impact increase of 0,50% Impact decrease of 0,50% DBO at discount rate Impact increase of 0,50% Impact decrease of 0,50% Germany 11 407 -619 681 13 914 -872 969 Italy 1 806 -90 82 2 104 -115 119 TOTAL 13 213 -709 763 16 019 -988 1 088
The plan assets mainly consist of:
The expected employer contributions to be paid during AY 22/23 amount to € 0,8m.
6.15. Provisions
The decrease in provisions of € -2,6m in AY 22/23 is mainly attributable to the additions in decommissioning (€ 2,9m) and in legal claims (€ 0,7m) which is offset by used provisions (€ -4,6m) and the reversal of unused amounts (€ -1,3m) following several settlements on historical disputes. For further information concerning pending disputes, refer to note 7.2. Main Disputes.
CONTENTS | CONTENTS FINANCIAL REPORT 268 /
Provisions 31 March 2023 Legal claims Decommissionning Onerous contracts Restructuring TOTAL €000 €000 €000 €000 €000 Balance at 31 March 2022 9 012 6 071 451 - 15 534 Additions 721 2 925 49 - 3 696 Unused amounts reversed -875 -413 - - -1 288 Used during period -4 730 -262 359 - -4 632 Transfer to lease liabilities - - -396 - -396 Balance at 31 March 2023 4 128 8 322 464 - 12 914 Analysis of total provisions Non-current 796 8 321 - - 9 117 Current 3 332 - 464 - 3 796 TOTAL 4 128 8 321 464 - 12 914 Provisions 31 March 2022 Legal claims Decommissionning Onerous contracts Restructuring TOTAL €000 €000 €000 €000 €000 Balance at 31 March 2021 7 515 6 008 1 168 36 14 727 Additions 3 717 63 80 -36 3 824 Unused amounts reversed -207 - -58 - -265 Used during period -2 013 - - - -2 013 Translation differences - - -738 - -738 Balance at 31 March 2022 9 012 6 071 451 - 15 534 Analysis of total provisions Non-current 4 461 6 071 -104 - 10 428 Current 4 550 - 555 - 5 106 TOTAL 9 012 6 071 451 - 15 534
Detail of plan assets Germany 31 March 2023 31 March 2022 Insurance contracts -Equity instruments -Corporate bonds 100% 100% Cash - -
6.16. Interest-bearing loans
Lease and lease back transaction
On 30 June 2022, Greenyard has completed a lease and lease back transaction regarding a long lease right on the food processing and warehouse facility of its Prepared division in Bree, Belgium. The transaction generated € 89,9m proceeds, net of tax which have been immediately and fully used to repay the term loan B under the Amended and Restated Facilities Agreement signed on 29 March 2021. As a result, the total outstanding amounts drawn under the term loans facilities reduced from € 300,0m to € 210,1m at that moment.
/ 269
Interest-bearing loans at 31 March 2023 Due within 1 year Due between 1 and 5 years Due after 5 years TOTAL At amortised cost €'000 €'000 €'000 €'000 Term loan 25 000 180 233 - 205 233 Revolving credit facility - 87 940 - 87 940 Bank overdrafts 1 - - 1 Other bank loans 948 516 - 1 464 Lease and leaseback financing 3 973 16 071 66 773 86 817 TOTAL 29 922 284 761 66 773 381 456 Interest-bearing loans at 31 March 2023 Fixed Floating TOTAL Gross €'000 €'000 €'000 Gross bank debt (pre-hedge) - 298 964 298 964 Interest rate hedge 277 975 -277 975Lease and leaseback financing 89 047 - 89 047 Gross financial debt (post-hedge) 367 022 20 989 388 012 Net financial debt (post-hedge) 365 518 15 938 381 456 Fixed/Floating Ratio 94,6% 5,4% 100% Interest-bearing loans at 31 March 2023 Secured Non-secured TOTAL At amortised cost €'000 €'000 €'000 Total 293 175 88 281 381 456 Interest-bearing loans at 31 March 2022 Due within 1 year Due between 1 and 5 years Due after 5 years TOTAL At amortised cost €'000 €'000 €'000 €'000 Term loan 35 000 263 091 - 298 091 Revolving credit facility - 86 752 - 86 752 Bank overdrafts 478 - - 478 Other bank loans 9 150 767 - 9 917 Lease and Leaseback financing - - -TOTAL 44 628 350 610 - 395 238 Interest-bearing loans at 31 March 2022 Fixed Floating TOTAL Gross €'000 €'000 €'000 Gross bank debt (pre-hedge) - 397 895 397 895 Gross financial debt (post-hedge) - 397 895 397 895 Net financial debt (post-hedge) - 395 238 395 238 Fixed/Floating Ratio 0% 100% 100% Interest-bearing loans at 31 March 2022 Secured Non-secured TOTAL At amortised cost €'000 €'000 €'000 Total 384 843 10 395 395 238
This long-term lease has a lease term of 20 years with a fixed interest of 1,64%. As of March 2023, outstanding financial liabilities related to the long-term lease amount to € 86,8m.
Our analysis of the accounting treatment regarding the lease and lease back concluded that the transaction classifies as a lease and lease back. As such, there is no actual sale and therefore, the envisaged transaction was recorded as a mere financing transaction. Incremental costs to obtain this financing were accordingly deducted from the outstanding financial liability and will be amortised over the lease term of 20 years.
Bank loans
On 22 September 2022, Greenyard has completed and signed a new Facility Agreement for a total amount of € 420m with a pool of banks, consisting of a € 220m senior secured term loan and a € 200m senior secured Revolving Credit Facility, both with a 5-year tenor maturing on 22 September 2027. On 11 January 2023, Greenyard converted these loans into sustainability linked loans, further emphasizing the commitment of the company to embed sustainability in every layer of the company.
This financing fully replaces the € 467,5m amended and restated Facilities Agreement signed on 29 March 2021, which had a maturity date on 31 March 2024. The latter agreement in turn amended the Original 2016 Facilities Agreement of the group. The proceeds of the new financing have been primarily used to repay the existing Facilities. The use of proceeds is to finance general corporate purpose needs, including working capital and create liquidity headroom (for growth).
The banking syndicate of the group has been extended from 6 to 11 banks, adding several new banking partners that have an international presence, matching the geographies in which the group is active.
The € 220,0m term loan bears a margin between 1,75% and 2,50%, based on a leverage grid. This margin can be decreased or increased by a maximum of 0,075% depending on the compliance to 4 sustainability KPI’s. The first € 12,5m instalment was foreseen 6 months after the closing of the transaction, and occurred on 22 March 2023, and subsequent € 25,0m repayments will occur each 12 months after the first instalment. As a result an amount of € 207,5m (excluding deducted transaction costs) was outstanding on 31 March 2023.
The € 200,0m revolving facility bears a margin between 1,50% and 2,25%, based on the same leverage grid, and includes a (limited) guarantee line. This margin can be decreased or increased by a maximum of 0,075% depending on the compliance to 4 sustainability KPI’s. The revolving facility can be drawn in several currencies, but as per 31 March 2023 all drawings were made in EUR.
The applicable covenants under the new Facility Agreement include a Leverage Ratio (adjusted Net debt/Adjusted EBITDA) below 3,0x, and an Interest Cover Ratio above 4,0x. Calculations are before application of IFRS 16 lease debt accounting.
Our analysis of the accounting treatment concluded that the refinancing of Greenyard qualifies as a debt extinguishment as the former refinancing was formally ended, the remaining outstanding liabilities were settled in cash and the syndicate of lenders substantially changed. Consequently, the unamortised transaction expenses related to the former refinancing were directly recorded in P&L (impact ad € 2,7m) and the incremental costs to obtain the new financing were accordingly deducted from the outstanding financial liability and are amortised over 5 years. The transaction costs related to this transaction, are allocated proportionally to the term loan and the revolving facilities. The bank loans are recorded at amortised cost.
The new facilities have been pre-hedged during the summer of 2022, in a context of an increasing interest rate environment, via forward-starting interest rate swaps that have partially converted the floating interest rate component of the debt into a fixed rate. As per 31 March 2023, an amount of € 278,0m was hedged. This interest rate swap hedging the primary indebtedness is designated as a hedging instrument and therefore hedge accounting is applied hereon.
Short-term bank debt varies in function of cash generated by operations, working capital needs and factoring drawdown. The drawn amount on the revolving credit facility as per 31 March 2023 amounts to € 90,0m (excluding deducted transaction costs).
The Group also avails of bilateral facilities with individual financial institutions outside of the syndicate banks for an amount of € 6,1m (€ 23,3m per 31 March 2022), of which € 1,5m (€ 10,4m per 31 March 2022) was used as at 31 March 2023.
All interest-bearing bank liabilities at 31 March 2023 are expressed in euros and concluded at market conditions. Following contractual agreements with some financial institutions, most overdrafts are presented net of cash.
For further information on bank covenants and the rights and commitments not included in the financial statement, refer to note 7.3. Off-balance sheet commitments.
CONTENTS | CONTENTS FINANCIAL REPORT 270 /
Changes in liabilities arising from financing activities
In accordance with IAS 7, a reconciliation of the net debt position (excluding lease accounting) is presented here below:
/ 271 Reconciliation nominal to carrying amount Term loan Revolving credit facility Lease and leaseback and other bank loans Other bank loans TOTAL Bank loans at 31 March 2023 €'000 €'000 €'000 €'000 €'000 Nominal amount 207 500 90 001 89 047 1 464 388 012 Transaction costs at inception -2 363 -2 148 -2 317 - -6 828 Amortisation transaction costs 97 88 87 - 271 Carrying amount 205 233 87 940 86 817 1 464 381 456 Reconciliation nominal to carrying amount Term loan Revolving credit facility Other bank loans TOTAL Bank loans at 31 March 2022 €'000 €'000 €'000 €'000 Nominal amount 300 000 87 500 10 395 397 895 Transaction costs at inception -2 572 -1 122 - -3 694 Amortisation transaction costs 663 374 - 1 037 Carrying amount 298 091 86 752 10 395 395 238
Reconciliation of net cash flow to movement in net debt (excl lease accounting) 31 March 2023 31 March 2022 €'000 €'000 Net debt, opening balance -303 620 -339 946 Increase/(decrease) in cash, cash equivalents and bank overdrafts 21 548 17 910 Proceeds from borrowings, net of transaction costs -479 112 -135 763 Repayment of borrowings 497 047 153 371 New transaction costs -6 828 New finance leases (non-cash) -5 636Changes in scope - -259 Effect of exchange rate fluctuations -362 1 037 Other changes -321 31 Net debt, closing balance -277 285 -303 620
6.17. Trade and other payables
The increase in trade payables as compared to previous year is mainly explained by price inflation on purchases and high business activity in the last weeks of the year.
The accrued charges mainly relate to utilities, temporary worker expenses, third party services and packaging costs. The decrease in accrued charges is mainly explained by lower accrued interest charges (€ - 1,0m at 31 March 2023 compared to € - 1,3m at 31 March 2022).
The table below gives an overview of the most important current and non-current trade and other payables in foreign currency.
6.18. Risk management policy
The Group's activities are exposed to a variety of financial risks: market risk (foreign exchange risk and interest rate risk), credit risk, and liquidity risk. The Group's overall risk management programme seeks to minimise potential adverse effects of the financial risks on the Group's financial performance. In order to manage certain market risks, the Group uses derivative financial instruments.
The Board of Directors has overall responsibility for the establishment and management of the Group’s risk management, including financial risk management. The Audit Committee is responsible for developing and monitoring the Group’s risk management policies. Internal audit, under the direction of the Audit Committee, undertakes both regular and ad hoc reviews of risk management controls and procedures, the results of which are reported to the Audit Committee.
The daily financial risk management is carried out by Corporate Treasury under the corporate treasury policies. Corporate Treasury identifies, evaluates and hedges financial risks in close co-operation with the Group's operating units.
6.18.1. Market risk
Market risk is the risk of changes in market parameters, such as foreign exchange rates and interest rates, which can influence the Group’s performance. The objective is to control and manage this market risk within the limits of acceptable parameters, while optimising the return earned by the Group.
CONTENTS | CONTENTS FINANCIAL REPORT 272 /
Trade and other payables 31 March 2023 31 March 2022 €'000 €'000 Other payables 3 142 4 143 Non-current 3 142 4 143 Trade payables 708 478 637 801 Tax 21 477 22 199 Remuneration and social security 36 128 35 074 Accrued charges 23 377 23 955 Other 16 429 14 790 Other payables 97 411 96 019 Current 805 889 733 819
Trade and other payables: foreign currencies 31 March 2023 31 March 2022 €'000 €'000 GBP 34 954 36 328 USD 13 583 13 306 PLN 14 992 15 046 CZK 14 746 14 212 Other 11 413 12 526
In the normal course of business, the Group uses financial derivatives to manage the market risks. All these transactions are carried out in line with corporate treasury policy. It is Group policy not to undertake speculative transactions.
Foreign exchange risk
The Group operates internationally and is exposed to foreign exchange risk arising from various currency exposures. The currency exposure is mainly linked to the Group’s operations in the UK, the Czech Republic, the US and Poland and to non-euro transactions in eurozone entities. Foreign exchange exposure arises from future commercial transactions and recognised assets and liabilities.
Foreign exchange risk arises when future commercial transactions are denominated in a currency that is not the entity's functional currency.
The receivables and liabilities in foreign currency can give rise to a realised gain or loss depending on whether the daily exchange rate at the time of receipt or payment differs from the exchange rate at which the receivable or payable is recorded.
Management has set up guidelines to require Group entities to manage their foreign exchange risk with regard to their local currency. Subsidiaries are required to hedge their entire foreign exchange risk exposure with Corporate Treasury. To manage its foreign exchange risk arising from future commercial transactions, the Group uses foreign exchange forward contracts.
Corporate Treasury's foreign exchange risk management practice applies the following hedging ratios per currency pair:
Over 3 months up to 6 months
Over 6 months and up to 1 year
If required for commercial reasons, a cash flow can be hedged at 100%.
Foreign exchange sensitivity
The sensitivity analysis is applied to third-party and intercompany loans and deposits and trade and other receivables and liabilities, in so far as the foreign currency differs from the functional currency of the Group. A 10% fluctuation in foreign exchange rates is taken into account when calculating the foreign exchange sensitivity below. These fluctuations would affect the profit before income tax.
The sensitivity analysis is also applied on the outstanding forward agreements for a 10% fluctuation in the foreign exchange rate. These fluctuations would affect equity.
The analysis below reflects the sensitivity of the US dollar, the British pound and the Polish zloty versus the EUR. The exposure to foreign currency changes for all other currencies is deemed not material. A positive sign represents a gain; a negative sign represents a loss.
The sensitivity is based on a net receivable position per 31 March 2023 of € -76,8m for GBP (31 March 2022 € -75,0m), of € 6,1m for USD (31 March 2022 € 16,0m) and of € -36,2m for PLN.
/ 273
Period Hedging ratios
100%-75%
Up to 3 months
75%-50%
50%-0%
Foreign exchange sensitivity 31
31
Effect on profit Effect on equity Effect on profit Effect on equity before income tax before income tax €'000 €'000 €'000 €'000 GBP +10% 6 981 -4 184 6 837 -770 -10% -8 532 3 424 -8 356 700 USD +10% -553 3 487 -1 478 -222 -10% 676 -2 853 1 806 202 PLN +10% 3 287 1 280 -10% -4 017 -1 047
March 2023
March 2022
Interest rate risk
Interest rate risk is the risk that the fair value or future cash flows of a financial instrument will fluctuate because of changes in market interest rates. The floating interest rate debt of the Group arises mainly from its Facilities Agreement and the financing retrieved from the multi-country factoring program.
The Group analyses its interest rate exposure on a dynamic basis. Various scenarios are simulated taking into consideration renewal of existing positions, alternative financing and hedging. Based on these scenarios, the Group calculates the impact on profit and loss of a defined interest rate shift. The scenarios are run only for liabilities that represent the major interest- bearing positions. At March 2023, Greenyard has € 381,5m in indebtedness (excl. lease liabilities), primarily with floating rate facilities, as well as a factoring agreement, also with floating rates. Therefore, changes in interest rates can have a material impact on the financial result of the group. The group may enter into interest rate derivatives to hedge its exposure to changes in interest rates.
As of September 2022, the group entered into € 287,4m of 2-year interest rate swaps, hedging the primary indebtedness, and € 212,3m of 2-year interest swaps, hedging its factoring exposure. Furthermore, it concluded forward-starting 3-year interest rate swaps from September 2024 onwards for respective amounts of € 147,8m and € 151,2m, for the same hedging purpose;
The interest rate swaps convert the interest rate of the exposed instruments from variable to fixed and are concluded with highly rated counterparties. In the first two years the interest is set at about 1,65% and the next three years at a rate of about 2,2%. The interest rate swap hedging the primary indebtedness is based on the three-month EURIBOR benchmark rate and has a fair value of € 8,8m as of 31 March 2023 while the interest rate swap hedging the factoring exposure is based on the one-month EURIBOR benchmark rate and has a fair value of € 8,1m as of 31 March 2023.
The interest rate swap hedging the primary indebtedness is designated as a hedging instrument and therefore hedge accounting was applied hereon. The IRS linked to the factoring exposure is not designated as a hedging instrument and therefore no hedge accounting was applied hereon. Consequently, this instrument is recognized at fair value through P&L.
The impact of the fixed-rate hedging strategy has been beneficial so far in the context of increased interest rate environment, and its impact on the average effective interest rate applicable to financial instruments is shown in the table below.
The sensitivity on the valuation of interest rate exposed financial instruments is shown in the table below.
CONTENTS | CONTENTS FINANCIAL REPORT 274 /
Financial liabilities at amortised cost 31 March 2023 31 March 2022 €'000 Average effective interest rate €'000 Average effective interest rate Fixed interest rate Bank loans and Lease and leaseback financing 365 518 3,50% 395 238 1,97% Floating interest rate Bank loans 15 938 5,16% -TOTAL 381 456 395 238
Interest rate sensitivity Nominal value at Impact 20 bps Impact 20 bps Nominal value at Impact 20 bps Impact 20 bps 31 March 2023 increase of interest rate decrease of interest rate 31 March 2022 increase of interest rate decrease of interest rate €'000 €'000 €'000 €'000 €'000 €'000 Bank loans and Lease and leaseback financing 381 456 -778 778 395 238 264 -264 IRS 490 292 2 539 -2 539 277 1 -1
Interest rate risk: maturity of financial assets and liabilities
Foreign exchange risk and interest rate risk: derivative financial instruments
Derivatives are reported at fair value and hedge accounting is applied for all derivatives except for derivates which are not designated as a hedging instrument. For financial derivatives, no offsetting has been applied.
The forward agreements expire on 14 October 2024 at the latest. The interest rate swaps expire on 22 September 2027 at the latest.
The fair value of derivatives is calculated using pricing models taking into account current market rates. For IRS, this information is provided by the Group’s financial institutions with which the financial instruments have been concluded. For the forward agreements, Corporate Treasury calculates the fair value.
/ 275
Remaining terms of financial assets and liabilities at 31 March 2023 Average effective Interest Rate Total carrying value < 1 year 1-5 year > 5 year % €'000 €'000 €'000 €'000 Assets and liabilities with fixed interest rates Bank loans 4,09% 278 700 24 545 254 155Lease and leaseback financing 1,64% 86 817 3 973 16 071 66 773 Lease liabilities 3,60% 231 254 30 445 89 367 111 443 Assets and liabilities with floating interest rates Cash and cash equivalents - 119 357 119 357 -Bank loans 5,16% 15 938 1 404 14 535Bank overdrafts - 1 1 -Remaining terms of financial assets and liabilities at 31 March 2022 Average effective Interest Rate Total carrying value < 1 year 1-5 year > 5 year % €'000 €'000 €'000 €'000 Assets and liabilities with fixed interest rates Lease and leaseback financing - - - -Lease liabilities 4,17% 231 998 29 386 89 367 113 245 Bank loans - - - -Assets and liabilities with floating interest rates Cash and cash equivalents - 98 504 98 504 -Bank loans 1,97% 394 760 44 150 350 610Bank overdrafts 2,01% 478 478 -All financial assets and liabilities are classified at amortised cost
31 March 2023
31 March 2022.
at
and
Outstanding derivatives: nominal amounts at maturity date 31 March 2023 31 March 2022 Due within 1 year Due between 1 and 5 years Due after 5 years Due within 1 year Due between 1 and 5 years Due after 5 years €'000 €'000 €'000 €'000 €'000 €'000 Foreign exchange risk Forward agreements 401 122 5 546 - 227 378 -Interest rate risk IRS 19 439 470 853 - - 277TOTAL 420 561 476 399 - 227 378 277 -
6.18.2. Credit risk
Credit risk is the risk of financial loss to the Group through a customer or a financial counterparty being unable to fulfil its contractual obligations. The Group is exposed to credit risk from its operating activities (primarily trade receivables) and from its financing activities, including deposits with banks and financial institutions, foreign exchange transactions and other financial instruments.
The Group’s exposure to credit risk on operating activities is influenced mainly by the individual characteristics of each customer. To protect itself against customer defaults and bankruptcies, the Group uses the services of international credit insurance companies, and also applies internal customer credit limits.
The Group’s credit policy does not identify any material credit risk exposure on its customers. Receivables for the ten largest debtors are credit insured and the three largest customers represent 59,3% of sales, as disclosed in note 4.1. Information about major customers
Non-credit insured receivables are reviewed for impairment risk, based on the ageing of the receivables.
Credit insurance is mandatory for all trade receivables sold to the factor company. Certain entities benefit also from credit insurance although their receivables are not factored.
Credit risk exposure on non-credit insured customers is continuously monitored by Corporate Treasury and any customer whose credit limit exceeds a predefined amount, is subject to a credit check. The credit check and customer rating are based upon the customers’ shareholders and group structure, the balance sheet and profit and loss accounts of the last two calendar years and related audit report and the weighted average days paid late. An internal credit limit is mandatory for non-credit insured customers before confirming the order to the customer and before shipping the goods. Approval of the internal credit limits is subject to the Greenyard Authority Matrix. Impairment losses are recorded on an individual basis.
The Group also makes advances to key suppliers generally to secure produce in key categories and mostly only after loading of the produce. Advances made are generally interest bearing and recovered through deduction from payments made in respect of produce delivered by the counterparty. Approval of advances to suppliers is also subject to the Greenyard Authority Matrix based on an evaluation of the supplier.
Financial investments are only allowed if the counterparties meet the minimum acceptable credit ratings at the time of initiation of the investment without exceeding a maximum concentration per counterparty. Investment counterparties must be banks and issuers with a credit rating of BBB (Standard & Poor’s), Baa (Moody’s Investor Service) or better.
CONTENTS | CONTENTS FINANCIAL REPORT 276 / Fair value by type of derivative 31 March 2023 Assets Liabilities Net Position Movement through income statement Movement through equity € '000 € '000 € '000 € '000 € '000 Foreign exchange risk Forward agreements 455 1 278 -823 - -775 Interest rate risk IRS 16 852 - 16 852 8 075 8 778 TOTAL 17 307 1 278 16 029 8 075 8 003 Fair value by type of derivative 31 March 2022 Assets Liabilities Net Position Movement through income statement Movement through equity € '000 € '000 € '000 € '000 € '000 Foreign exchange risk Forward agreements 322 370 -49 - 1 838 Interest rate risk IRS - - - -TOTAL 322 370 -49 - 1 838
Credit risk covers only the instrument category of ‘loans and receivables’ (L&R). For the other instrument categories, the credit risk is considered as limited
6.18.3. Liquidity risk
Liquidity risk is the risk that the Group will not be able to meet its financial obligations on their due date. The Group’s approach to managing liquidity is to ensure, as far as possible, that it will always have sufficient liquidity to meet its liabilities when due, under both normal and stress conditions without incurring unacceptable losses or risking damage to its reputation.
The Group monitors its risk of a shortage of funds using a cash positioning tool. Short-term cash flow forecasting is performed in the operating entities of the Group and aggregated by Corporate Treasury. Corporate Treasury monitors forecasts of the Group's liquidity requirements to ensure it has sufficient cash to meet operational needs. It also secures that sufficient headroom is maintained on its undrawn committed borrowing facilities at all times so that the Group does not breach borrowing limits or covenants (where applicable) on any of its borrowing facilities.
Most of the subsidiaries are part of a cash pool scheme, as such funds are collected on a daily basis on the bank accounts held by Corporate Treasury. For subsidiaries not part of a cash pool scheme, surplus cash above balances required for working capital purposes are transferred to Corporate Treasury.
The Group’s policy requires always having adequate facilities available to cover unanticipated financing requirements. The Group has approval of committed term and revolving borrowings of up to € 395m per 31 March 2023 (€ 452,5m per 31 March 2022).
At 31 March 2023, the Group has € 97,5m of unused available lines under its Facilities Agreement (31 March 2022 € 66m) excluding € 12,5m guarantee lines. The total uncommitted bilateral facilities for an amount of € 6,1m (31 March 2022 € 23,3m), were unused for € 4,6m at 31 March 2023 (31 March 2022 € 13m).
For a discussion of the existing lines and their terms and conditions, see note 6.16.
Interest-bearing loans
The table below categorises the Group's financial liabilities into relevant maturity groupings based on the remaining period at the reporting date to the contractual maturity date. The undiscounted cash flows reflect net interest payments and principal repayments. Derivative financial assets and liabilities are included in the analysis for the residual cash flows.
/ 277
Remaining terms of financial debts Contractually agreed undiscounted cash flows 31 March 2023 Due within 1 year Due between 1 and 5 years Due after 5 year TOTAL €'000 €'000 €'000 €'000 Bank loans 43 061 324 718 - 367 779 Lease and leaseback financing 5 391 21 565 76 802 103 758 Lease liabilities 39 930 181 064 169 613 390 607 Trade and other payables 805 889 3 142 - 809 031 Non-derivatives 894 271 530 489 246 415 1 671 175 IRS -6 586 -9 591 - -16 176 Forward agreements 432 63 - 496 Derivatives -6 153 -9 527 - -15 681 TOTAL 888 118 520 961 246 415 1 655 495
Remaining terms of financial debts
Contractually agreed undiscounted cash flows
All instruments held at the reporting date and for which payments had been contractually agreed are included. Forecasted data relating to future, new liabilities are not included. Amounts in foreign currencies have been translated at the closing rate. The variable interest payments arising from financial instruments were calculated using the applicable forward interest rates.
6.18.4. Transfers of financial assets
In relation to factoring, the total derecognised trade receivables amounted to € 309,5m as of 31 March 2023 (€ 294,3m as of 31 March 2022). Greenyard has transferred 95% of the credit risk to the factors. The remaining credit risk remains in its accounts as a continuing involvement in the transferred receivables and is recognised, together with the retained late payment risk of which the latter is however considered immaterial (see also note 6.9 Trade and other receivables).
As the legal ownership of the receivables is transferred to the factors, and the transferred receivables are credit insured for the benefit of the factors, payments by debtors and credit insurers will be done to the factors. Management of the transferred receivables is done by Greenyard as agent for the factors. There is no contractual obligation for Greenyard to fulfil a payment obligation in the event of an insolvency of credit insurers. More information can be found under note 6.9 Trade and other receivables
Greenyard uses factoring arrangements as part of its liquidity management and has a total amount of € 375m of committed factoring programme lines outstanding as of 31 March 2023 (same as of 31 March 2022). These factoring programmes are set up with a limited number of counterparties and therefore constitute a significant concentration in terms of liquidity risk for Greenyard.
6.18.5. Financial assets and liabilities – fair value
Derivative financial instruments are measured at fair value at inception and at each reporting date, with the movement recognised in the income statement unless they are designated as cash flow hedges. Where instruments are classified as cash flow hedges, they are accounted for under hedge accounting rules with gains or losses arising on the effective portion of the derivative instrument recognised in the cash flow hedge reserve, as a separate component of equity. Gains or losses on any ineffective portion of the derivative are recognised in the income statement. When the hedged transaction matures, the related gains or losses in the cash flow hedge reserve are transferred to the income statement. The net carrying amounts and respective fair values are analysed for the various classes of financial assets and liabilities. The table below only includes the financial assets and liabilities for which the fair value differs from the carrying amount. For all other financial assets and liabilities, the Group considers the carrying amounts to approximate the fair values.
The fair value of bank loans is calculated as the present value of the future cash flows (level 2 input).
CONTENTS | CONTENTS FINANCIAL REPORT 278 /
31 March 2022 Due within 1 year Due between 1 and 5 years Due after 5 year TOTAL €'000 €'000 €'000 €'000 Bank loans 51 897 359 982 - 411 879 Lease and leaseback financing - - -Lease liabilities 40 211 170 695 211 084 421 990 Trade and other payables 662 664 4 143 - 666 807 Non-derivatives 754 772 534 820 211 084 1 500 676 IRS - - -Forward agreements -536 60 - -475 Derivatives -536 60 - -475 TOTAL 754 236 534 880 211 084 1 500 200
Financial assets and liabilities by class and category at 31 March 2023 Net carrying amount Fair value €'000 €'000 Bank loans 294 639 299 981 Lease and leaseback financing 86 817 79 600 Financial assets and liabilities by class and category at 31 March 2022 Net carrrying amount Fair value €'000 €'000 Bank loans 394 760 411 839
6.18.6. Capital structure
To maintain a strong capital base and sustain market confidence, the Board of Directors regularly reviews and monitors the Group’s capital structure. This involves evaluating dividend policy and return on capital (based on shareholders’ equity).
In accordance with article 12 of the Company’s articles of association, the Board of Directors is authorized, during a five-year period counting from the date of the Extraordinary Shareholders’ Meeting of 17 September 2021, and within the limits determined by law, to acquire the maximum number of Company’s shares permitted by law, without requiring further Shareholders’ Meetings’ approval or resolution. By the end of August 2017, the Company completed a share buyback programme launched in March 2017 with a total of 1 750 000 Greenyard shares repurchased at a total cost of € 30,0m, including associated costs. In the framework of a second share buyback programme launched at the end of August 2021, the Company repurchased 600 000 Greenyard shares by January 2022, at a total cost of € 5,5m.
These Greenyard shares are held as treasury shares. As of 31 March 2023, Greenyard holds 1 843 840 treasury shares, representing 3,6% of the total number of Company’s shares.
The Group also constantly seeks to optimize its capital structure (balance between debts and equity) to ensure that entities in the Group will be able to continue as going concerns while maximising the return to stakeholders through the optimisation of the debt to equity ratio. The Group is determined to keep its leverage ratio to a level structurally below 2,5x over the coming periods.
The Group targets a flexible structure in terms of periodicity and credit type, which enables it to seize potential opportunities. Note 6.12. Issued capital, share premium and other capital instruments and note 6.16. Interest-bearing loans provide more detail on equity and debt components.
The Group has leverage ratio covenants as detailed in note 7.3. Off-balance sheet commitments.
6.18.7. Fair value hierarchy included in the statement of financial position
The table above analyses the Group’s financial instruments of initially measured at fair value, sorted by valuation method. The different levels have been defined as follows:
• Level 1: quoted prices (unadjusted) in active markets for identical assets or liabilities.
• Level 2: fair value measurement: the fair values of other financial assets and liabilities are determined in accor-dance with generally accepted pricing models based on discounted cash flow analysis using prices from observable current market transactions and dealer quotes for similar instruments. This mainly relates to derivative financial instruments.
- Forward agreements are measured using quoted forward exchange rates and yield curves derived from quoted interest rates with matching maturities.
- Interest rate swaps are measured at the present value of future cash flows estimated and discounted using the applicable yield curves derived from quoted interest rates.
• Level 3: fair value measurement: the fair value of the remaining financial assets and liabilities is derived from valuation techniques which include inputs that are not based on observable market data.
During the past financial year, there were no transfers of financial assets or liabilities between levels 1 and 2.
/ 279
Assets and liabilities at fair value 31 March 2023 31 March 2022 Level 1 Level 2 Level 3 TOTAL Level 1 Level 2 Level 3 TOTAL €'000 €'000 €'000 €'000 €'000 €'000 €'000 €'000 Financial assets at fair value Derivatives - Forward agreements, IRS and equity investments - 455 - 455 - 322 - 322 Total - 455 - 455 - 322 - 322 Financial liabilities at fair value Derivatives - Forward agreements and IRS - 1 278 - 1 278 - 370 - 370 Total - 1 278 - 1 278 - 370 - 370
7. Other elements
7.1. Subsidiaries, associates, joint ventures and investments
recorded at cost
The parent company of the Group is Greenyard NV, Sint-Katelijne-Waver, Belgium. The subsidiaries, associates, joint ventures and investments recorded at cost of the Group as per 31 March 2023 are presented below.
Long Fresh
CONTENTS | CONTENTS FINANCIAL REPORT 280 /
Long Fresh: Subsidiaries Country of incorporation Consolidation method % of interest 31 March 2023 31 March 2022 Greenyard Frozen Langemark NV Belgium Full 100% 100% Greenyard Frozen Belgium NV Belgium Full 100% 100% Pinguin Langemark NV Belgium Full 100% 100% Greenyard Prepared Investments BE NV Belgium Full 100% 100% Greenyard Prepared Belgium NV Belgium Full 100% 100% BND CV(4) Belgium Full 25% 25% Greenyard Frozen Brazil Ltda Brazil Full 100% 100% Greenyard Frozen Investments FR (Moréac) SAS France Full 66% 66% Greenyard Frozen Investments FR (Comines) SAS France Full 66% 66% Greenyard Frozen Comines SAS France Full 100% 100% Greenyard Frozen France SAS France Full 100% 100% Greenyard Frozen Holding FR SAS France Full 100% 100% Greenyard Frozen Investments PL Sp. Z o.o. Poland Full 100% 100% Greenyard Frozen Poland Sp. Z o.o. Poland Full 100% 100% LiliCo Hungary Kft.(1) Hungary Full 100% 100% Greenyard Frozen UK Ltd. UK Full 100% 100% Greenyard Prepared UK Ltd. UK Full 100% 100% Greenyard Prepared Netherlands B.V.(3) The Netherlands Full 0% 0% Long Fresh: Investments recorded at cost Country of incorporation Consolidation method % of interest 31 March 2023 31 March 2022 Alberts NV Belgium Not consolidated 7% 7%
/ 281 Fresh Fresh: Subsidiaries Country of incorporation Consolidation method % of interest 31 March 2023 31 March 2022 Bakker Belgium NV Belgium Full 100% 100% Greenyard Fresh NV Belgium Full 100% 100% Greenyard Fresh Belgium NV Belgium Full 100% 100% Greenyard Fresh Direct Belgium NV Belgium Full 100% 100% Greenyard Transport Belgium NV Belgium Full 100% 100% Greenyard Logistics Belgium NV Belgium Full 100% 100% Greenyard Fresh Holding NL B.V. The Netherlands Full 100% 100% Greenyard Fresh Netherlands B.V. The Netherlands Full 100% 100% Greenyard Fresh Investments NL B.V. The Netherlands Full 100% 100% Bakker Barendrecht B.V. The Netherlands Full 100% 100% Bakker Barendrecht Transport B.V. The Netherlands Full 100% 100% Holland Crop B.V.(2) The Netherlands Full 0% 0% Bakker Centrale Inkoop B.V. The Netherlands Full 100% 100% Greenyard Flowers Netherlands B.V. The Netherlands Full 100% 100% Greenyard Supply Chain Services B.V. The Netherlands Full 100% 100% Greenyard Fresh France SAS France Full 100% 100% Delta Stocks Sarl France Full 100% 100% Greenyard Fresh Beteiligungs GmbH Germany Full 100% 100% Greenyard Fresh Holding DE GmbH & Co KG Germany Full 100% 100% Greenyard Fresh Trade International GmbH(2) Germany Full 0% 0% Greenyard Fresh Germany GmbH Germany Full 100% 100% Fresh Solutions GmbH Germany Full 100% 100% Greenyard Fresh Services GmbH Germany Full 100% 100% Greenyard Fresh Austria GmbH Austria Full 100% 100% Greenyard Fresh Spain SA Spain Full 100% 100% Mor K.B. International Ltd Israel Full 65% 65% Amore Srl Italy Full 46% 46% Biofarm Srl Italy Full 100% 100% Greenyard Fresh Italy Srl Italy Full 100% 100% Bardsley Fruit Enterprises Ltd.(3) UK Full 0% 0% Greenyard Fresh UK Ltd. UK Full 100% 100% Pastari International Ltd(1) Turkey Full 60% 60% Greenyard Logistics Poland Sp. Z o.o. Poland Full 100% 100% Bakker Trans sro Czech Republic Full 100% 100% Bakker sro Czech Republic Full 100% 100% Greenyard USA Co US Full 100% 100% Seald Sweet LLC US Full 90% 90% Greenyard Logistics USA Inc US Full 100% 100% Mor U.S.A. Inc US Full 65% 65% DFM Brazil Ltda Brazil Full 100% 100% Greenyard Fresh Brazil Ltda Brazil Full 100% 100% Greenyard Fresh Peru SAC Peru Full 100% 100% Greenyard Fresh Chile Ltda Chili Full 100% 100% Greenyard Fresh Colombia SAS Colombia Full 100% 100% M.I.S.A. Int. (Pty) Ltd South Africa Full 65% 65%
(1) Liquidated or in liquidation
(2) Merger in AY21/22
(3) Divestment in AY21/22
(4) Greenyard has ‘de facto’ control based on certain statements in the articles of association: on the one hand they have more rights and blocking possibilites and on the other hand they are always involved in the representation in and out of court of the CV.
(5) Acquired in AY22/23
Significant restrictions
There are no significant restrictions (e.g. resulting from borrowing arrangements, regulatory requirements or contractual arrangements between investors with significant influence over a subsidiary) on the ability of subsidiaries to transfer funds to their parent company in the form of cash dividends, or to repay loans or advances made by the parent company, except for those mentioned in note 7.3. Off-balance sheet commitments, with the approval of the majority shareholder. In addition, there are no significant restrictions on the Company’s or its subsidiaries’ ability to access or use the assets and settle the liabilities of the Group, except for those mentioned in note 7.3. Off-balance sheet commitments
Changes in the consolidation scope
No major changes occurred in the consolidation scope during AY 22/23. During AY 21/22 the following changes were noted:
• On 11 June 2021, Greenyard Prepared Netherlands was sold for a consideration of € 17,0m. After deduction of transaction related expenses, a loss was accounted for on this transaction ad € 0,3m.
• The stake in Bardsley Fruit Enterprises was sold for a consideration of £ 4,2m. After deduction of transaction related expenses, a gain was realized for an amount of € 3,0m.
7.2. Main disputes
To the extent the expected outcome of the disputes mentioned below would result in a potential financial impact for Greenyard, a provision has been recorded or an existing one has been revised.
Tax dispute
Greenyard Frozen Brazil Ltda. imports frozen fruit and vegetables from Europe for which the company has received an exemption from paying ICMS (tax on circulation of goods and services) from the state of São Paulo. Frozen fruit and vegetables are considered basic and natural products which are generally exempt from ICMS. However, local tax authorities do not consider frozen fruit and vegetables to be natural products and claim administrative penalties for such imports. This is general practice in the frozen vegetables business. The total litigations of Greenyard in this respect amount to R$ 22,5m (€ 6,1m) relating to the period 2010-2016 for which no amounts were paid nor accrued. A final favourable court decision was pronounced by the Supreme Court on 17 August 2017. Procedures before the courts of first instance to execute the Supreme Court judgement and cancel the total amount of fines imposed by the local tax authorities are pending. To date, the majority of the individual cases have been resolved in our favour.
CONTENTS | CONTENTS FINANCIAL REPORT 282 /
Fresh: Joint ventures and associates Country of incorporation Consolidation method % of interest 31 March 2023 31 March 2022 Grupo Yes Procurement Marketing SL Spain Equity method 50% 50% Logidis Sistem SL Spain Equity method 50% 50% Agritalia Srl Italy Equity method 33% 33% Ekho Fresh Ltd.(5) UK Equity method 49% 0% Fresh: Investments recorded at cost Country of incorporation Consolidation method % of interest 31 March 2023 31 March 2022 Campoverde Spa Agricola Italy Not consolidated 2% 2% Carpe Naturam Soc. Consortile ARL Italy Not consolidated 9% 9% Kiwi Passion S.r.l. Consorzio Italy Not consolidated 7% 7%
Banana license dispute
In 2002, Greenyard Fresh Italy S.r.l. (formerly Univeg Trade Italia S.r.l. and previously Bocchi Import Italia S.r.l.) received a claim relating to allegedly unpaid customs duties on banana imports between October 1998 and November 1999. The Greek tax authorities alleged that the company used false licenses to trade bananas and claimed payment of € 3,3m (including interest), whereas the company purchased the false licenses in good faith. In March 2023, the Greek Supreme Court finally decided to reject the company’s appeal in relation to the administrative proceedings. Based on this, the tax authorities could enforce their initial claims for payment. Greenyard Fresh Italy S.r.l. is currently contemplating the next steps, including a potential appeal related to the enforcement proceedings.
Loan debt due by Peruvian grower
Greenyard Fresh Peru SAC and a local grape grower signed an agreement whereby the grower undertook to deliver (at least) 2k tons of grapes per season, in the period between 2014 and 2018. In order to finance the purchase of additional plantations by the grower, the company granted a long-term loan of USD 500k, repayable in annual installments from 2015 to 2019. Since the grower remains in breach of its obligation to repay the loan, Greenyard Fresh Peru SAC has initiated proceedings to enforce its collateral, which are pending.
7.3. Off-balance sheet commitments
7.3.1. Commitments concerning purchases of property, plant and equipment and fresh vegetables
Per 31 March 2023 and 31 March 2022, the Group committed for the purchase of property, plant and equipment, and fresh fruit and vegetables an amount of:
The Group has concluded sowing and purchase contracts with a number of farmers for the procurement of fresh fruit and vegetables. The contracted amounts can still fluctuate as a function of climate conditions and market prices for fresh fruit and vegetables.
7.3.2. Factoring
In accordance with IFRS 9 Financial instruments: Recognition and Measurement, all non-recourse trade receivables, included in factoring programs, are derecognised for the non-continuing involvement part (see also Critical judgments in applying the entity’s accounting policies).
As of 31 March 2023, total derecognised trade receivables amounted to € 309,5m (€ 294,3m as of 31 March 2022). As the claims are transferred to the factors, and the claims are credit insured, payments of claims will be done to the agent of the factors. No further payment will thereafter be due by the credit insurers. Claim management is done by Greenyard itself. There is no contractual obligation for Greenyard to fulfil a payment obligation in the event of an insolvency of its credit insurers. Greenyard has transferred 95% of the risk to the factors. The remaining risk remains in its accounts.
7.3.3. Bank and bond covenants and undertakings
Group Facilities Agreement
In September 2022, the Group refinanced its bank loans through a new Facilities Agreement for an aggregate amount of € 420,0m consisting of a € 220,0m term loan facility and a € 200,0m revolving credit facility with a new consortium of banks. Regarding the term loan, a first € 12,5m instalment was foreseen 6 months after the closing of the transaction, and occurred on 22 March 2023, and subsequent € 25,0m instalments will occur each 12 months after the first instalment.
The facilities bear interest composed of EURIBOR plus a margin. The margin is not the same for the term loan as it is for the revolving credit facility. The margin is based on the Group’s leverage ratio. The term loan bears a margin between 1,75% and 2,50%, based on
/ 283
Purchase commitments 31 March 2023 31 March 2022 €‘000 €‘000 Fresh fruit and vegetables 133 295 97 931 Property, plant & equipment 4 734 5 575 Other 75 389 TOTAL 138 104 103 894
a leverage grid. The revolving credit facility bears a margin of between 1,50% and 2,25%, based on a leverage grid. Short-term bank debt varies in function of cash generated by operations, working capital needs and factoring drawdown. The margin can be adjusted (decreased or increased) by a maximum of 0,075% depending on the compliance to four Sustainability KPI’s defined in the Facilities Agreement.
Next to a change of control clause and customary general covenants, the Facilities Agreement includes financial covenants being an interest cover ratio and a leverage ratio which are tested on a semi-annual basis (30 September and 31 March) and reported to the lenders. The leverage ratio is calculated as the interest-bearing debt (at nominal value, transaction cost excluded) deducting cash and cash equivalents before the impact of IFRS 16 divided by the last twelve month Adjusted EBITDA, corrected for acquisitions. The interest cover ratio means the ratio of Adjusted EBITDA to net finance charges (excluding factoring charges and transaction costs) in respect of the relevant period. At 31 March 2023, Greenyard complied with its covenants.
The Facilities Agreement also stipulates that a flexible pool of guarantors guarantees the amounts drawn and outstanding under the Facilities Agreement. The (size and composition of the) pool of guarantors is subject to a Guarantor Cover requirement for which the Guarantors jointly need to meet certain minimum levels on coverage of total consolidated gross assets (65%), corrected for customer relations and goodwill, total consolidated net sales (65%) and consolidated Adjusted EBITDA of the Group (80%). The most material entities in the group in terms of EBITDA contribution, net sales or assets are included in this guarantor pool. The guarantor cover test is required annually at year-end and Guarantors need to be added to the Facilities Agreement in case that the guarantor test is not met. To the extent that the ratio would not be met, Greenyard would need to add additional entities as guarantor to meet this test within 45 days. For 31 March 2023, all requirements were met.
7.3.4. Securities
In September 2022, the Group successfully refinanced its bank facilities and entered into the Facilities Agreement. These facilities are secured through different types of asset pledges. In general, main assets, mostly including shares, cash balances, property, plant and equipment, inventories, trade and other receivables of the Group’s subsidiaries, located in Belgium, France, the Netherlands, Poland, UK, Spain, Germany and US are pledged or secured through mortgages. On a consolidated basis, meaning excluding intercompany positions, total pledged assets amounted to € 3 161,4m at 31 March 2023 of which € 2 730,0m related to business assets, € 108,0m to property, plant and equipment, € 212,0m to inventories and receivables, € 111,3 to cash and cash equivalents.
The Company will issue comfort letters to some of its subsidiaries confirming financial support until their General Shareholders’ Meeting in 2024.
7.3.5. Bank and corporate guarantees
On 31 March 2023, the Group has outstanding bank guarantees amounting to € 9,2m and outstanding corporate guarantees amounting to € 128,8m. The main beneficiaries are tax/customs authorities, landlords, tenants, lenders, suppliers and customers.
7.3.6. Contingent liabilities
There are no contingent liabilities, other than the above-mentioned responsibilities and warranties.
7.4. Related parties
Transactions between Greenyard NV and its subsidiaries have been eliminated in the consolidation and are therefore not included in this note. Transactions with joint ventures and associates are included.
For an overview of the application of articles 7:96 and 7:97 BCAC, reference should be made to the Corporate Governance Statement chapter.
The Fruit Farm Group
Until December 2019, Greenyard Group had a strategic fruit sales, marketing and distribution agreement with The Fruit Farm Group. Since then, Greenyard entities only do business directly with local individual key suppliers within The Fruit Farm Group.
The Fruit Farm Group is ultimately owned by the reference shareholder of the Group.
CONTENTS | CONTENTS FINANCIAL REPORT 284 /
Joint ventures
Transactions with joint ventures relate to sourcing, packing and selling of fruit and vegetables and logistic services.
Remuneration of the Board of Directors and Leadership Team
(1) Excluding Mr Hein Deprez (as permanent representative of Deprez Invest NV) who receives a management fee in his capacity of co-CEO.
(2) The Leadership Team’s remuneration consists of the fixed remuneration and bonus of the Leadership Team members (including the co-CEOs).
As well the annual remuneration paid to the Board of Directors as to the Leadership team slightly decreased in AY 22/23 as compared with AY 21/22.
The Leadership Team’s total annual remuneration includes the remuneration of both co-CEOs, Mr Hein Deprez (as permanent representative of Deprez Invest NV) and Mr Marc Zwaaneveld (as permanent representative of MZ-B BV), and the remuneration of the other Leadership Team members.
For more detailed information in this respect and with respect to disclosures relating to the 2020 Code, reference should be made to the Corporate Governance Statement chapter.
7.5. Events after balance sheet date
Greenyard has secured an incremental € 45m revolving credit line in order to support its further growth. The syndicated banks have signed a consent letter thereto on 1 June 2023.
There are no other major events subsequent to the balance sheet date which have a major impact on the further evolution of the Group.
7.6. Fees group auditor
During AY 22/23, additional services for a total amount of € 109k were provided by the statutory auditors and persons working under cooperative arrangements with them. These services mainly consist of supplementary audit and advisory services.
The audit fees charged to the Group for the accounting year ending 31 March 2023 amounted to € 1,5m.
All additional fees were presented in advance to the Audit Committee for approval. The Group’s Audit Committee gave a positive decision on this extension.
/ 285
Related parties 31 March 2023 31 March 2022 €’000 €’000 The Fruit Farm Group Purchase of products, services and other goods 16 775 23 939 Sales of services and other goods 130 154 Trade payables 186 303 Other entities Purchase of products, services and other goods 2 596 3 692 Joint ventures Purchase of products, services and other goods 24 194 13 633 Sales of services and other goods 56 15 Interest and similar revenue -Trade receivable incl advances 36 7 Trade payables 8 399 2 531
Remuneration AY 22/23 AY 21/22 €’000 €’000 Board of Directors(1) 474 490 Leadership Team(2) 4 982 5 034

286 / UNLEASHING THE PURE POWER OF PLANTS
Statement of responsible persons

/ 287 GREENYARD ANNUAL REPORT 2022/2023
Declaration regarding the information given in this financial report for the 12-month period ended 31 March 2023.
Sint-Katelijne-Waver, 8 June 2023
The undersigned, in the name and on behalf of Greenyard NV, declare that, as far as they are aware:
• The financial statements, established in conformity with the applicable accounting standards, give a true and fair view of the equity, the financial position and the results of Greenyard NV, including its consolidated subsidiaries;
• The financial report for the 12-month period ended 31 March 2023 contains a true and fair statement of the important events, the results and the position of Greenyard NV, including its consolidated subsidiaries, as well as a comment on the principal risks and uncertainties confronting the Group.
Ahok BV, represented by Mr Koen Hoffman, Chairman of the Board of Directors
Deprez Invest NV, represented by Mr Hein Deprez, co-CEO and managing director
MZ-B BV, represented by Mr Marc Zwaaneveld, co-CEO
Chilibri BV, represented by Mr Geert Peeters, CFO
CONTENTS | CONTENTS FINANCIAL REPORT 288 /
/ 289

290 / UNLEASHING THE PURE POWER OF PLANTS
Statutory auditor’s report on the consolidated financial statements

/ 291 GREENYARD ANNUAL REPORT 2022/2023
Statutory auditor’s report to the shareholders’ meeting of Greenyard NV for the year ended 31 March 2023 - Consolidated financial statements
In the context of the statutory audit of the consolidated financial statements of Greenyard NV (“the company”) and its subsidiaries (jointly “the group”), we hereby submit our statutory audit report. This report includes our report on the consolidated financial statements and the other legal and regulatory requirements. These parts should be considered as integral to the report
We were appointed in our capacity as statutory auditor by the shareholders’ meeting of 17 September 2021, in accordance with the proposal of the board of directors (“bestuursorgaan” / “organe d’administration”) issued upon recommendation of the audit committee and presentation of the works council. Our mandate will expire on the date of the shareholders’ meeting deliberating on the financial statements for the year ending 31 March 2023 in view of Article 41 of EU Regulation nr. 537/2014 that states that as from 17 June 2020, an audit mandate can no lon ger be prolonged for those audit mandates running 20 years or more at the date of entry into force of the regulation Due to a lack of online archives dating back prior to 1997, we have not been able to determine exactly the first year of our appointment. We have performed the statutory audit of the consolidated financial statements of Greenyard NV for at least 2 5 consecutive periods
Report on the consolidated financial statements
Unqualified opinion
We have audited the consolidated financial statements of the group, which comprise the consolidated statement of financial position as at 31 March 2023, the consolidated income statement, the consolidated statement of comprehensive income, the consolidated statement of changes in equity and the consolidated statement of cash flow for the year then ended, as well as the summary of significant accounting policies and other explanatory notes. The consolidated statement of financial position shows total assets of 1 973 206 (000) EUR and the consolidated statement income statement shows a profit for the year then ended of 9 289 (000) EUR
In our opinion, the consolidated financial statements give a true and fair view of the group’s net equity and financial position as of 31 March 2023 and of its consolidated results and its consolidated cash flow for the year then ended, in accordance with International Financial Reporting Standards (IFRS) as adopted by the European Union and with the legal and regulatory requirements applicable in Belgium.
Basis for the unqualified opinion
We conducted our audit in accordance with International Standards on Auditing (ISA) , as applicable in Belgium. In addition, we have applied the International Standards on Auditing approv ed by the IAASB applicable to the current financial year, but not yet approved at national level. Our responsibilities under those standards are further described in the “Responsibilities of the statutory auditor for the audit of the consolidated financial statements” section of our report. We have complied with all ethical requirements relevant to the statutory audit of consolidated financial statements in Belgium, including those regarding independence.
We have obtained from the board of directors and the company’s officials the explanations and information necessary for performing our audit.
We believe that the audit evidence obtained is sufficient and appropriate to provide a basis for our opinion.
CONTENTS | CONTENTS FINANCIAL REPORT 292 / Greenyard NV | 31 March 2023 1
Key audit matters
Key audit matters are those matters that, in our professional judgment, were of most significance in our audit of the consolidated financial statements of the current period. These matters were addressed in the context of our audit of the consolidated financial statements as a whole and in f orming our opinion thereon, and we do not provide a separate opinion on these matters.
K Key audit matters How our audit addressed the key audit matters
Goodwill impairment assessment
The group’s goodwill is relative to the Cash Generating Unit ‘Fresh’ and amounts to 477 MEUR.
We focused on this area due to the size of the goodwill balance (477 MEUR as at 31 March 202 3) and because the directors’ assessment of the “value in use” of the Group’s CGUs involves judgements about the future results of the business and the discount rates applied to future cash flow forecasts.
The group disclosed the nature and the value of the assumptions used in the impairment test in note 6.2 to the consolidated financial statements. The key estimates embedded in the impairment test are disclosed in note 3.2 to the consolidated financial statements.
In response to this matter, we obtained an understanding of the impairment assessment process and tested the design and implementation of the relevant internal control procedures.
Our substantive audit procedures included amongst others the challenge of the methodology and management’s assumptions. Key assumptions relate to forecasted revenue & EBITDA growth, average EBITDA margin and discount rate applied. We involved internal valuation experts to assist us in this challenge especially in respect of assessing the reasonableness of the discount rate.
We critically challenged management’s assumptions with reference to historical data, and where applicable, to external benchmarks.
We carried out audit procedures on management’s sensitivity calculations and related available information.
We critically assessed the historical accuracy of management’s budgets and forecasts. We compared current performance with forecasts and corroborated previous forecasts with actual data.
We assessed the adequacy of the disclosures with respect to the impairment test and the sensitivity analyses.
/ 293 Greenyard NV | 31 March 2023 2
Responsibilities of the board of directors for the preparation of the consolidated financial statements
The board of directors is responsible for the preparation and fair presentation of the consolidated financial statements in accordance with International Financial Reporting Standards (IFRS) as adopted by the European Union and with the legal and regulatory requirements applicable in Belgium and for such internal control as the board of directors determines is necessary to enable the preparation of consolidated financial statements that are free from material misstatement, whether due to fraud or error.
In preparing the consolidated financial statements , the board of directors is responsible for assessing the group’s ability to continue as a going concern, disclosing, as applicable, matters to be considered for going concern and using the going concern basis of accounting unless the board of directors either intends to liquidate the group or to cease operations, or has no other realistic alternative but to do so.
Responsibilities of the statutory auditor for the audit of the consolidated financial statements
Our objectives are to obtain reasonable assurance about whether the consolidated financial statements as a whole are free from material misstatement, whether due to fraud or error, and to issue a statutory auditor’s report that includes our opinion. Reasonable assurance is a high level of assurance, but is not a guarantee that an audit conducted in accordance with ISA will always detect a material misstatement when it exists. Misstatements can arise from fraud or error and are considered material if, indivi dually or in the aggregate, they could reasonably be expected to influence the economic decisions of users taken on the basis of these consolidated financial statements.
During the performance of our audit, we comply with the legal, regulatory and normativ e framework as applicable to the audit of consolidated financial statements in Belgium. The scope of the audit does not comprise any assurance regarding the future viability of the company nor regarding the efficiency or effectiveness demonstrated by the board of directors in the way that the company’s business has been conducted or will be conducted.
As part of an audit in accordance with ISA, we exercise professional judgment and maintain professional skepticism throughout the audit. We also:
identify and assess the risks of material misstatement of the consolidated financial statements, whether due to fraud or error, design and perform audit procedures responsive to those risks, and obtain audit evidence that is sufficient and appropriate to provide a bas is for our opinion. The risk of not detecting a material misstatement resulting from fraud is higher than for one resulting from an error, as fraud may involve collusion, forgery, intentional omissions, misrepresentations, or the override of internal contr ol;
obtain an understanding of internal control relevant to the audit in order to design audit procedures that are appropriate in the circumstances, but not for the purpose of expressing an opinion on the effectiveness of the group’s internal control;
evaluate the appropriateness of accounting policies used and the reasonableness of accounting estimates and related disclosures made by the board of directors;
CONTENTS | CONTENTS FINANCIAL REPORT 294 / Greenyard NV | 31 March 2023 3
conclude on the appropriateness of the use of the going concern basis of accounting by the board o f directors and, based on the audit evidence obtained, whether a material uncertainty exists related to events or conditions that may cast significant doubt on the group’s ability to continue as a going concern. If we conclude that a material uncertainty exists, we are required to draw attention in our statutory auditor’s report to the related disclosures in the consolidated financial statements or, if such disclosures are inadequate, to modify our opinion. Our conclusions are based on the audit evidence obtained up to the date of our statutory auditor’s report. However, future events or conditions may cause the group to cease to continue as a going concern;
evaluate the overall presentation, structure and content of the consolidated financial statements, and whether the consolidated financial statements represent the underlying transactions and events in a manner that achieves fair presentation.
obtain sufficient appropriate audit evidence regarding the financial information of the entities and business activities within the group to express an opinion on the consolidated financial statements. We are responsible for the direction, supervision and performance of the group audit. We remain solely responsible for our audit opinion.
We communicate with the audit committee regarding, amongst other matters, the planned scope and timing of the audit and significant audit findings, including any significant deficiencies in internal control that we identify during our audit.
We also provide the audit committee with a statement that we have complied with relevant ethical requirements regarding independence, and we communicate with them about all relationships and other matters that may reasonably be thought to bear on our independence, and where applicable, related safeguards.
From the matters communicated to the audit committee, we determine those matters that were of most significance in the audit of the consolidated financial statements of the current period and are therefore the key audit matters. We describe these matters in our report unless law or regulation precludes any public disclosure about the matter.
Other legal and regulatory requirements
Responsibilities of the board of directors
The board of directors is responsible for the preparation and the content of the directors’ report on the consolidated financial statements, the statement of non-financial information attached to the directors’ report on the consolidated financial statements and other matters disclosed in the annual report on the consolidated financial statements
Responsibilities of the statutory auditor
As part of our mandate and in accordance with the Belgian standard complementary to the International Standards on Auditing (ISA) as applicable in Belgium, our responsibility is to verify, in all material respects, the director’s report on the consolidated financial statements, the statement of non-financial information attached to the directors’ report on the consolidated financial statements and other matters disclosed in the annual report on the consolidated financial statements , as well as to report on these matters.
/ 295 Greenyard NV | 31 March 2023 4
Aspects regarding the directors’ report on the consolidated financial statements and other information disclosed in the annual report on the consolidated financial statements
In our opinion, after performing the specific procedures on the directors’ report on the consolidated financial statements, this report is consistent with the consolidated financial statements for that same year and has been established in accordance with the requirements of article 3:32 of the Code of companies and associations.
In the context of our statutory audit of the consolidated financial statements we are responsible to consider, in particular based on information that we became aware of during the audit, if the directors’ report on the consolidated financial statements and other information disclosed in the annual report on the consolidated financial statements are free of material misstatements, either by information that is incorrectly stated or otherwise misleading. In the context of the procedures performed, we are no t aware of such a material misstatement.
The non-financial information as required by article 3:32, § 2 of the Code of companies and associations, has been disclosed in the directors’ report on the consolidated financial statements. This non -financial information has been established by the company in accordance with the GRI standards. In accordance with article 3:80 § 1, 5° of the Code of companies and associations we do not express any opinion on the question whether this non-financial information has been established in accordance with these standards.
Statements regarding independence
Our audit firm and our network have not performed any prohibited services and our audit firm has remained independent from the group during the performance of our mandate.
The fees for the additional non-audit services compatible with the statutory audit, as defined in article 3:65 of the Code of companies and associations, have been properly disclosed and disaggregated in the notes to the consolidated financial statements
Single European Electronic Format ( ESEF)
In accordance with the draft standard on the audit of the compliance of the financial statements with the Single European Electronic Format ("ESEF"), we are required to check the compliance of the ESEF format and of the tagging with the technical regulatory standards as defined by the European Delegated Regulation No. 2019/815 of 17 December 2018 (hereinafter "Delegated Regulation").
The board of directors is responsible for the preparation, in accordance with the ESEF requirements, of the consolidated financial statements in the form of an electronic file in ESEF format (“digital consolidated financial statements”) included in the annual financial report.
Our responsibility is to obtain sufficient and appropriate evidence to conclude that the format and the tagging of the digital consolidated financial statements comply, in all material respects, with the ESEF requirements as stipulated by the Delegated Regulation.
Our audit procedures, as referred to above, of the annual financial report and the digital consolidated financial statements is still ongoing at the date of this report. A separate audit report will be issued on the compliance of the financial statements with the Single European Electronic Format ("ESEF")
CONTENTS | CONTENTS FINANCIAL REPORT 296 / Greenyard NV | 31 March 2023 5
Greenyard NV | 31 March 2023
Other statements
This report is consistent with our additional report to the audit committee referred to in article 11 of Regulation (EU) No 537/2014.
Signed at Gent
T The statutory auditor
Deloitte Bedrijfsrevisoren/Réviseurs d’Entreprises BV/SRL
Represented by Kurt Dehoorne

Deloitte Bedrijfsrevisoren/Réviseurs d’Entreprises BV/SRL
Registered Office: Gateway building, Luchthaven Brussel Nationaal 1 J, B-1930 Zaventem
VAT BE 0429.053.863 - RPR Brussel/RPM Bruxelles - IBAN BE86 5523 2431 0050 - BIC GKCCBEBB
Member of Deloitte Touche Tohmatsu Limited

/ 297

298 / UNLEASHING THE PURE POWER OF PLANTS
Condensed statutory accounts of the parent company greenyard nv, according to belgian accounting standards

/ 299 GREENYARD ANNUAL REPORT 2022/2023
The statutory financial statements of the parent company, Greenyard NV, are presented below in a condensed form. The statutory auditor issued an unqualified report on the financial statements of Greenyard NV. In accordance with Belgian company law, the directors’ report and financial statements of the parent company, Greenyard NV, together with the statutory auditor’s report, will be deposited with the National Bank of Belgium.
They are available on our website www.greenyard.group and on request from:
Greenyard NV
Strijbroek 10
BE – 2860 Sint-Katelijne-Waver Belgium
www.greenyard.group
CONTENTS | CONTENTS FINANCIAL REPORT 300 /
/ 301 ASSETS Codes 31 March 2023 31 March 2022 €’000 €’000 NON-CURRENT ASSETS 20/28 282 901 282 045 Formation expenses 20 234 467 Intangible assets 21 1 187 1 675 Tangible assets 22/27 2 047 470 Land and buildings 22 -Plant, machinery and equipment 23 7 23 Furniture and vehicles 24 39 21 Leasing and other similar rights 25 34 63 Other tangible assets 26 -Assets under construction and advance payments 27 1 968 364 Financial assets 28 279 433 279 433 Affiliated enterprises 280/1 279 233 279 233 Participating interests 280 279 233 279 233 Amounts receivable 281 -Other enterprises linked by participating interests 282/3 -Participating interests 282 -Amounts receivable 283 -Other financial assets 284/8 200 200 Shares 284 200 200 Amounts receivable and cash guarantees 285/8 -CURRENT ASSETS 29/58 140 925 133 643 Amounts receivable after more than one year 29 87 000 87 000 Trade receivables 290 -Other amounts receivable 291 87 000 87 000 Stocks and contracts in progress 3 -Stocks 30/36 -Raw materials and consumables 30/31 -Work in progress 32 -Finished goods 33 -Goods purchased for resale 34 -Immovable property acquired or constructed for resale 35 -Advance payments 36 -Contracts in progress 37 -Amounts receivable within one year 40/41 1 935 4 391 Trade receivables 40 1 935 4 391 Other amounts receivable 41 -Investments 50/53 11 764 15 629 Own shares 50 11 764 15 629 Other investments and deposits 51/53 -Cash at bank and in hand 54/58 39 081 25 776 Deferred charges and accrued income 490/1 1 146 847 TOTAL ASSETS 20/58 423 825 415 688
CONTENTS | CONTENTS FINANCIAL REPORT 302 / LIABILITIES Codes 31 March 2023 31 March 2022 €’000 €’000 EQUITY 10/15 411 468 408 740 Capital 10 343 852 343 852 Issued capital 100 343 852 343 852 Uncalled capital 101 -Share premiums 11 -Revaluation surplus 12 -Reserves 13 47 921 47 536 Legal reserve 130 11 154 10 769 Reserves not available for distribution 131 11 789 15 654 In respect of own shares held 1310 11 764 15 629 Other 1311 25 25 Untaxed reserves 132 1 477 1 477 Reserves available for distribution 133 23 501 19 636 Profit/ loss (-) carried forward 14 19 695 17 352 Investment grants 15 -Advance to shareholders on the split of net assets 19 -PROVISIONS AND DEFERRED TAXATION 16 -Provisions for liabilities and charges 160/5 -Pensions and similar obligations 160 -Taxation 161 -Major repairs and maintenance 162 -Environment liabilities 163 -Other liabilities and charges 164/5 -Deferred taxation 168 -CREDITORS 17/49 12 359 6 948 Amounts payable after more than one year 17 895 681 Financial debts 170/4 5 34 Subordinated loans 170 -Unsubordinated bonds 171 -Leasing and other similar obligations 172 5 34 Credit institutions 173 -Other loans 174 -Trade debts 175 800 647 Suppliers 1750 800 647 Bills of exchange payable 1751 -Advances received on contracts in progress 176 -Other amounts payable 178/9 90Amounts payable within one year 42/48 11 464 6 267
/ 303 Current portion of amounts payable after more than one year 42 34 34 Financial debts 43 -Credit institutions 430/8 -Other loans 439 -Trade debts 44 4 612 4 403 Suppliers 440/4 4 612 4 403 Bills of exchange payable 441 -Advances received on contracts in progress 46 -Taxes, remuneration and social security 45 1 606 1 808 Taxes 450/3 481 714 Remuneration and social security 454/9 1 125 1 095 Other payables 47/48 5 212 21 Accrued charges and deferred income 492/3 -TOTAL EQUITY AND LIABILITIES 10/49 423 825 415 688
CONTENTS | CONTENTS FINANCIAL REPORT 304 / INCOME STATEMENT Codes AY 22/23 AY 21/22 €’000 €’000 Operating income 70/76A 28 094 23 124 Turnover 70 27 737 22 719 Increase (+) ; Decrease (-) in stocks of finished goods and work and contracts in progress 71 -Own construction capitalised 72 -Other operating income 74 358 405 Non-recurring operating profit 76A Operating charges 60/66A 28 083 21 650 Raw materials. consumables and goods for resale 60 -Purchases 600/8 -Increase (-) ; Decrease (+) in stocks 609 -Services and other goods 61 16 682 16 265 Remuneration, social security costs and pensions 62 4 822 4 541 Depreciation of and other amounts written off formation expenses, intangible and tangible assets 630 918 795 Increase (+) ; Decrease (-) in amounts written off stocks, contracts in progress and trade receivables 631/4 -Increase (+) ; Decrease (-) in provisions for liabilities and charges 635/8 -Other operating charges 640/8 5 662 48 Operating charges capitalised as reorganisation 649 -Non-recurring operating charges 66A -Operating profit/loss (-) 9901 11 1 475 Financial income 75/76B 12 372 24 294 Recurring financial income 75 12 372 24 294 Income from financial assets 750 9 262 31 Income from current assets 751 2 772 3 590 Other financial income 752/9 338 20 673 Non-recurring financial income 76B -Financial charges 65/66B 4 005 3 174 Recurring financial charges 65 4 005 3 174 Interest and other debts charges 650 - 1 078 Increase (+) ; Decrease (-) in amounts written off current assets other than stocks, contracts in progress and trade receivables 651 525 120 Other financial charges 652/9 3 480 1 975 Non-recurring financial charges 66B Profit/loss (-) for the period before taxes 9903 8 378 22 595 Transfer from deferred taxation 780 -Transfer to deferred taxation 680 -Income taxes 67/77 684 806 Income taxes 670/3 684 806 Adjustment of income taxes and write-back of tax provisions 77 -Profit/loss (-) of the period 9904 7 694 21 788 Transfer from untaxed reserves 789 -Transfer to untaxed reserves 689 -Profit/loss (-) for the period available for appropriation 9905 7 694 21 788
/ 305 APPROPRIATION ACCOUNT Codes AY 22/23 AY 21/22 €’000 €’000 Profit/loss (-) to be appropriated 9906 25 047 18 442 Profit/loss (-) for the period available for appropriation (9905) 7 694 21 788 Profit/loss (-) brought forward 14P 17 352 -3 347 Transfers from equity 791/2 3 866 8 276 From capital and share premiums 791 -From reserves 792 3 866 8 276 Transfers to equity 691/2 4 250 9 365 To capital and share premiums 691 -To legal reserve 6920 385 1 089 To other reserves 6921 3 866 8 276 Profit/loss (-) to be carried forward (14) 19 695 17 352 Shareholders' contribution in respect of losses 794 -Distribution of profit 694/7 4 967Dividends 694 4 967Directors' emoluments 695 -Employees 696 -Other allocations 697 - -

306 / UNLEASHING THE PURE POWER OF PLANTS
Financial definitions

/ 307 GREENYARD ANNUAL REPORT 2022/2023
CAPEX
Capital expenditures
EBIT Operating result
EPS Earnings per share
IRS Interest rate swap
Liquidity
Leverage
Net financial debt (NFD)
Net financial debt (NFD) excl. lease accounting
NFD (for leverage)
Net result
Adjusting items
Current assets (including assets classified as held for sale)/Current liabilities (including liabilities related to assets classified as held for sale)
NFD (for leverage) / adjusted EBITDA (for leverage)
Interest-bearing debt (at nominal value) after the impact of lease accounting (IFRS 16), less derivatives, bank deposits, cash and cash equivalents and restricted cash
Interest-bearing debt (at nominal value) before the impact of lease accounting (IFRS 16), less derivatives, bank deposits, cash and cash equivalents and restricted cash
Net financial debt (NFD) excl. lease accounting
Profit/loss (-) for the period
Adjusting items are one-off expenses and income that in management’s judgement need to be disclosed by virtue of their size or incidence. Such items are included in the consolidated income statement in their relevant cost category, but separately disclosed in the chapter Key financial information reconciling EBIT to adjusted EBITDA. Transactions which may give rise to adjusting items are principally restructuring and reorganization activities, impairments, disposal of assets and investments, claims, IFRS 3 acquisition accounting and corporate finance related projects and the effect of the accelerated repayment of certain financial indebtedness.
Adjusted EBITDA
EBIT corrected for depreciation, amortization and impairments excluding adjusting items, excluding EBIT corrected for depreciation, amortization and impairments from minor operations that are divested or divestment is in process (not within the scope of IFRS 5).
Adjusted EBITDA (for leverage) Adjusted EBITDA excluding the impact of lease accounting (IFRS 16)
LTM
LTM adjusted EBITDA
LTM adjusted EBITDA (for leverage)
Working capital
Last twelve months
Last twelve months adjusted EBITDA, corrected for acquisitions and disposals on a like-forlike basis
Last twelve months adjusted EBITDA, corrected for acquisitions and disposals on a like-forlike basis and excluding the impact of lease accounting (IFRS 16)
Working capital is the sum of the inventories, trade and other receivables (non-current and current) and trade and other payables (current). In this respect trade and other receivables are corrected for long-term (financing) receivables and accrued interest income and trade and other payables exclude accrued interest expenses and dividend payable.
AY 22/23
AY 21/22
Accounting year ended 31 March 2023
Accounting year ended 31 March 2022
CONTENTS | CONTENTS FINANCIAL REPORT 308 /
About Greenyard
Greenyard (Euronext Brussels: GREEN) is a global market leader of fresh, frozen and prepared fruit & vegetables, flowers and plants. Counting Europe’s leading retailers amongst its customer base, Greenyard provides efficient and sustainable solutions to customers and suppliers through best-in-class products, market leading innovation, operational excellence and outstanding service.
Our vision is to make lives healthier by helping people enjoy fruit & vegetables at any moment, easy, fast and pleasurable, whilst fostering nature.
With around 8 500 employees operating in 19 countries worldwide, Greenyard identifies its people and key customer and supplier relationships as the key assets which enable it to deliver goods and services worth approx. € 4,6 billion per annum.
www.greenyard.group
 Greenyard NV / Strijbroek 10 / 2860 Sint-Katelijne-Waver / Belgium
