MATHEMATICS I
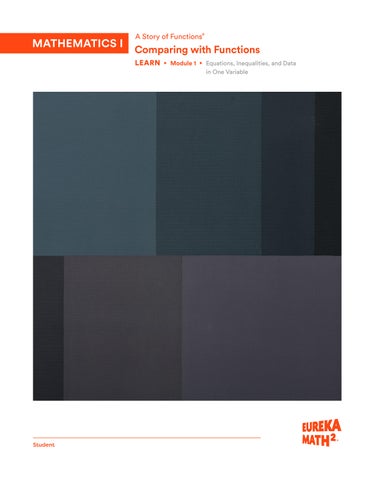
LEARN ▸ Module 1 ▸ Equations, Inequalities, and Data in One Variable
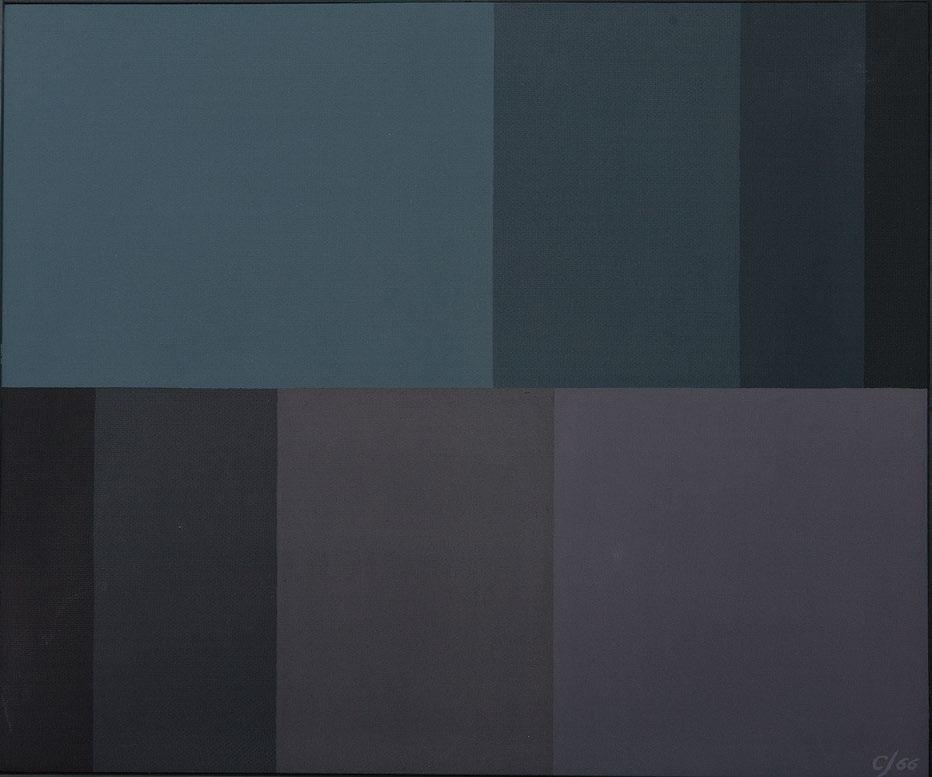
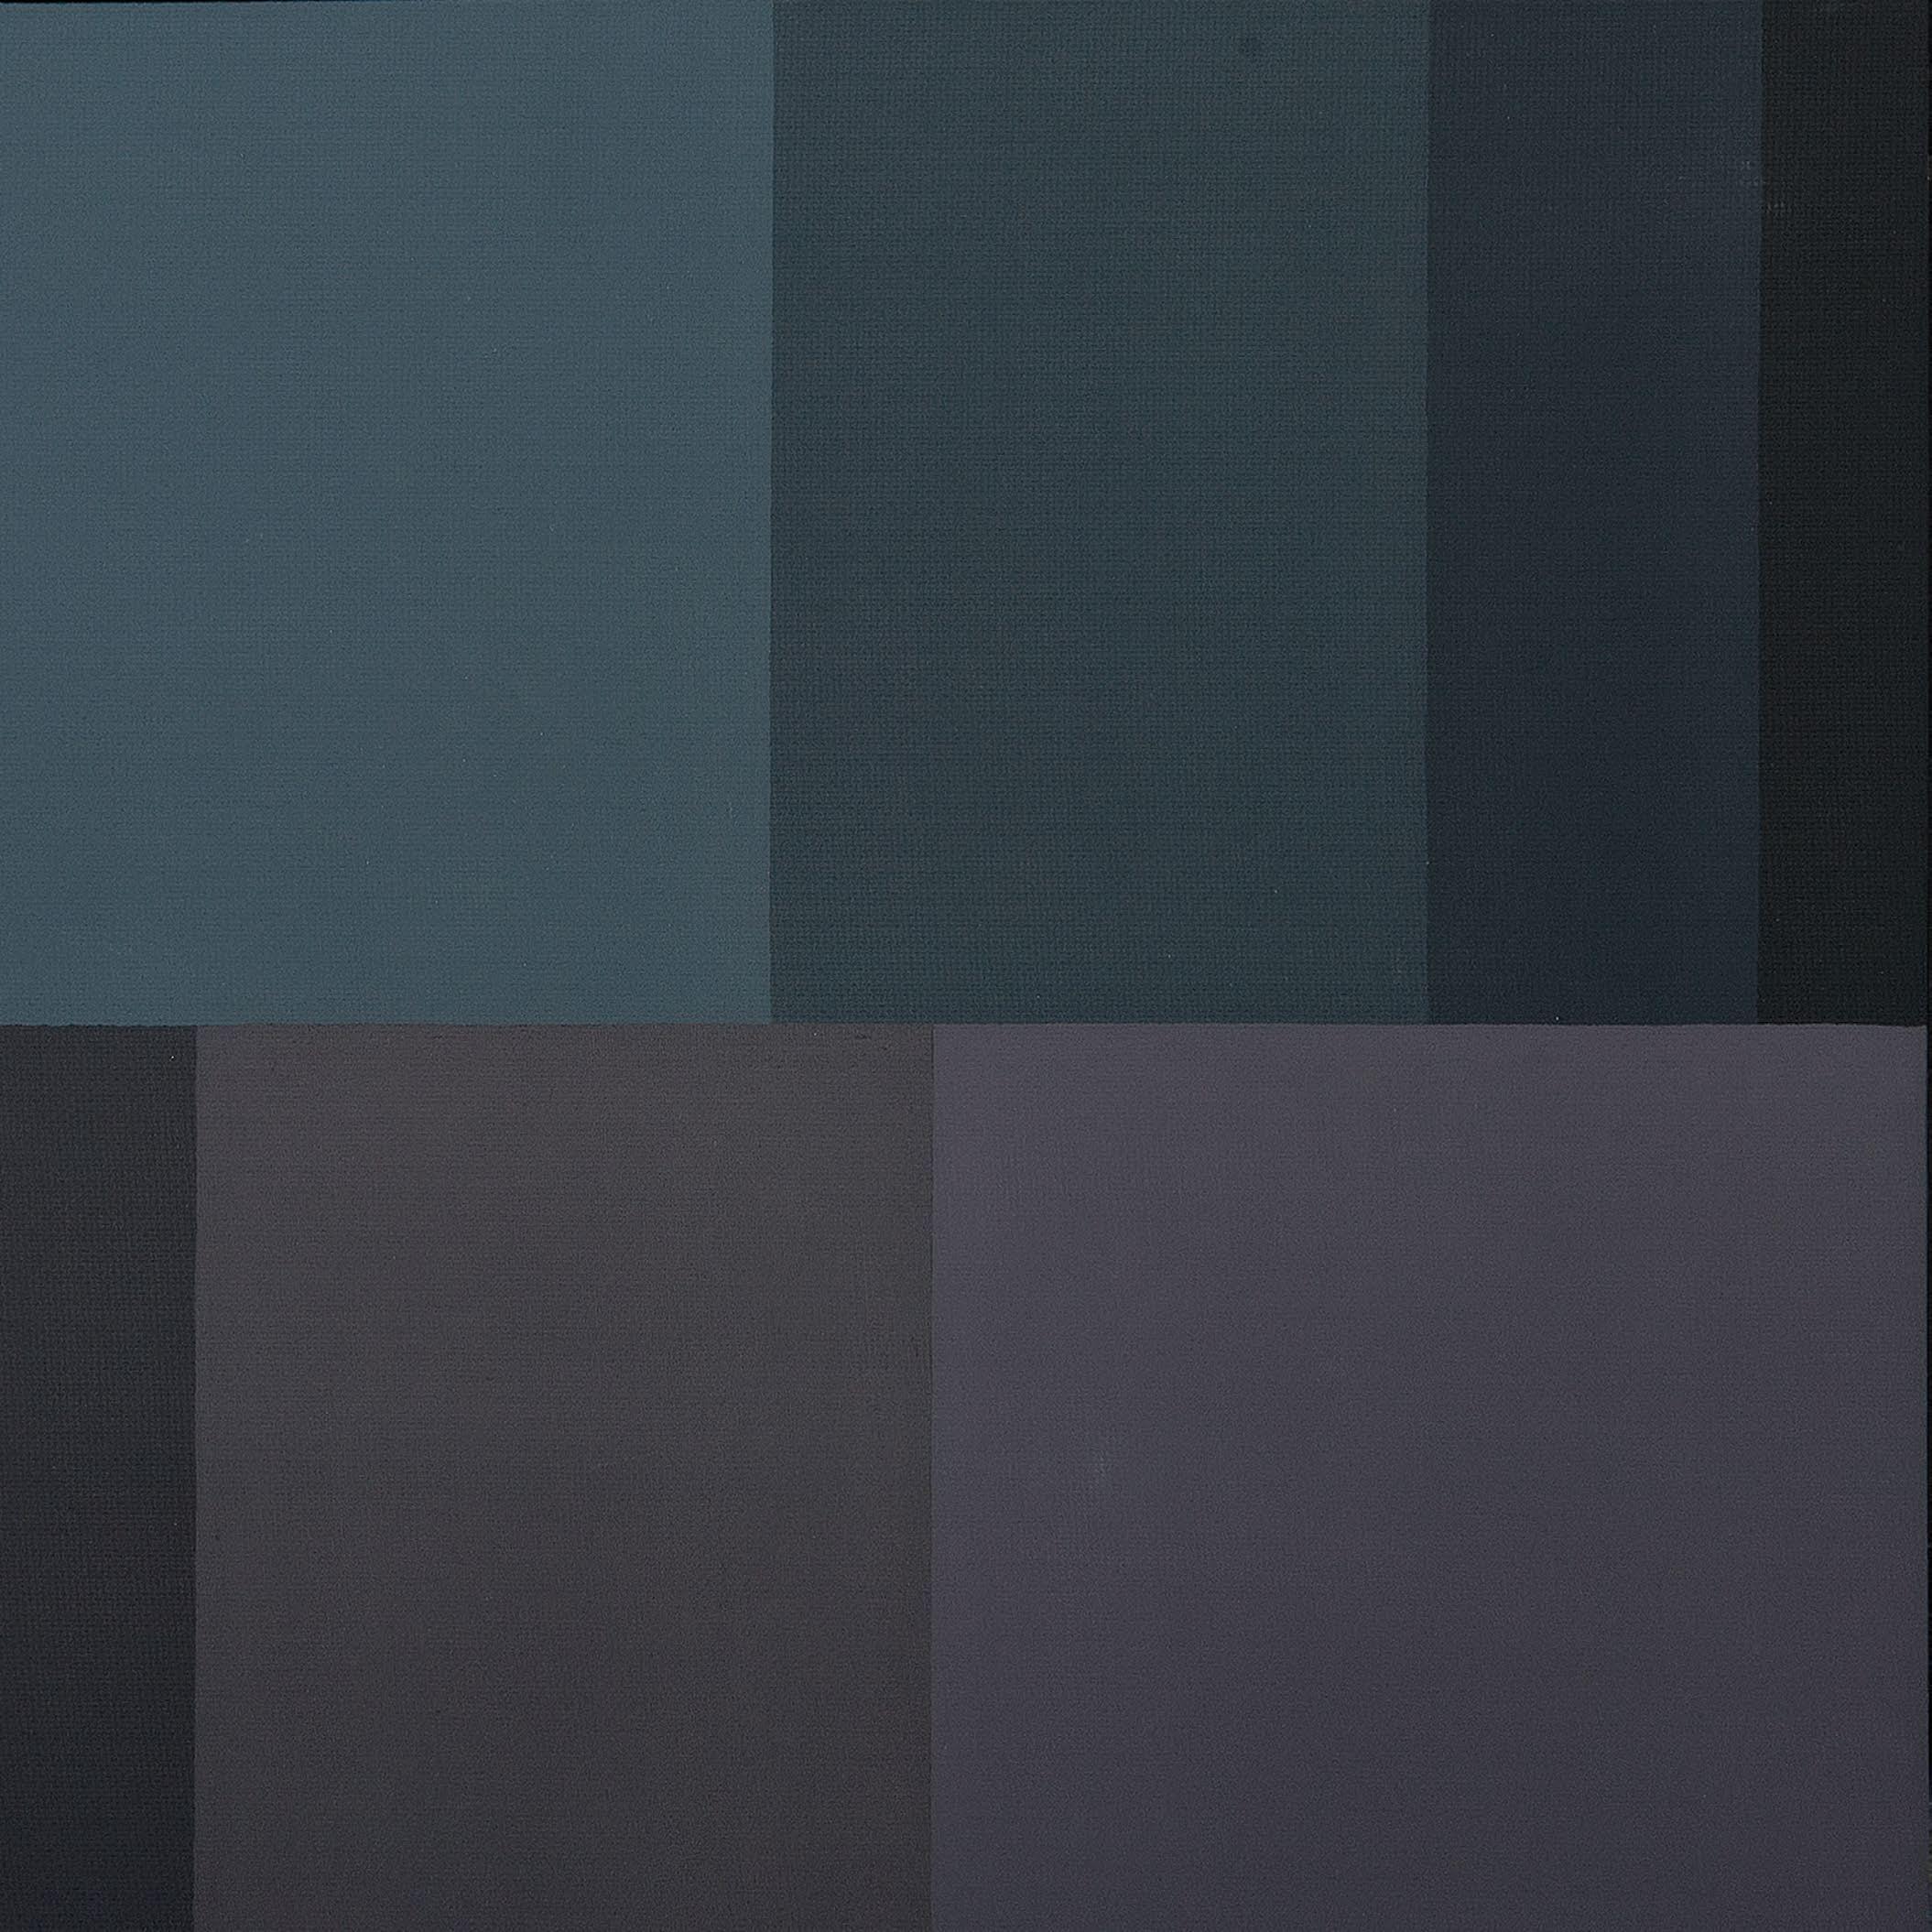
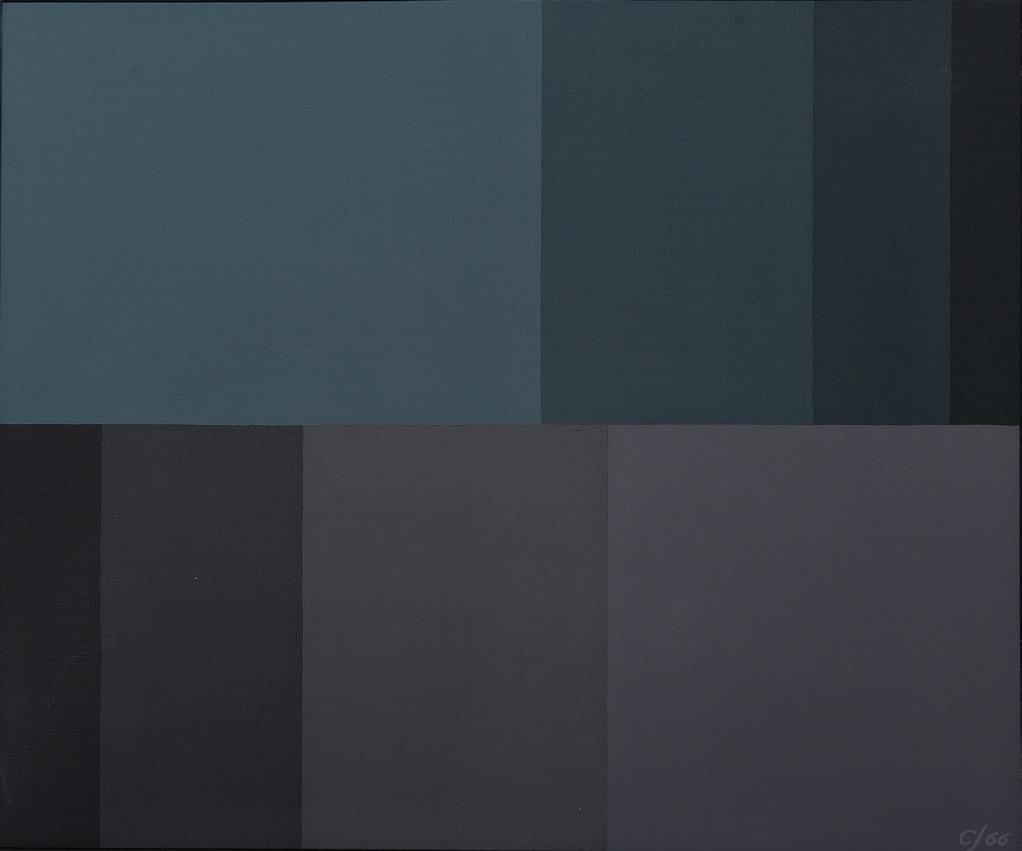
Although he is best known as a cartoonist for his comic strip Barnaby and the book Harold and the Purple Crayon, the American artist Crockett Johnson also took a keen interest in mathematics, painting more than 100 pieces relating to mathematics and mathematical physics during his life. His painting Logarithms shows two sequences of rectangles. How do the lengths of the rectangles in the top row relate to those in the bottom row?
On the cover Logarithms, 1966
Crockett Johnson, American, 1906–1975
Masonite and wood
Smithsonian National Museum of American History, Washington, DC, USA
Crockett Johnson, Logarithms, 1966, masonite and wood, 56 cm x 66.3 cm x 3.8 cm; 22 1/16 in x 26 1/8 in x 1 1/2 in. Courtesy of Ruth Krauss in memory of Crockett Johnson, Smithsonian National Museum of American History
Module 1 Equations, Inequalities, and Data in One Variable
2 Equations, Inequalities, and Data in Two Variables
3 Functions and Their Representations
4 Transformations of the Plane and Constructions
5 Linear and Exponential Functions
6 Modeling with Data and for Contexts

variable standing in for unspecified number manipulations to create a new quantity
2x + 5
You already know how to make facial expressions. You make them all the time.
(Yes, even now.)
You know how to make algebraic expressions, too. An expression is simpler than an equation, a function, or an inequality. It’s just a quantity.
Take x. That’s a quantity. So it’s a simple expression.
Or 2x. That’s double the last quantity. It’s another expression.
Or 2 x + 5. That’s five more than the last quantity—and it’s yet another expression.
Algebraic expressions, like facial expressions, can get complicated. But remember: Just as a facial expression captures a single emotion, an algebraic expression captures a single quantity.


1. There are 4 checkout lanes at a grocery store that have a different number of shopping carts in line. Use the data to determine which lane has the fastest checkout time. Show or explain your reasoning.
2. A grocery store has the following options:
A. 4 lines for 4 checkout lanes that each have a cashier
B. 1 line for all 4 self-checkout lanes
Consider the options from the customer’s perspective and from the grocery store’s perspective. Which option is better? Why?
Name
Reflect on the lesson.
Date
1. There are 2 checkout lanes at a grocery store that have different checkout data. The scatter plot and checkout summary for each lane are based on two different data sets.
The number of shopping carts in each lane and number of items in each shopping cart are shown.
a. Which lane has the faster checkout time? How do you know?
b. Which lane has the faster checkout time? How do you know?
c. Which lane has the faster checkout time? How do you know?
d. Which lane has the faster checkout time? How do you know?
2. Is it possible to apply a combination of statistical, geometric, and algebraic thinking to solve problem 1? If so, which combination did you use, and how?
3. Give two examples of where you apply statistics in your everyday life.
4. Give two examples of where you apply geometry in your everyday life.
5. Give two examples of where you apply algebra in your everyday life.
For problems 6 and 7, evaluate.
6. −12.14 − 2.32
7. 9.9 + 11.25 + (−4)
8. Which equations are true? Choose all that apply.
A. 72 + 45 = 9(8 + 5)
B. 80 + 60 = 8(10 + 60)
C. 24 + 6 = 6(4 + 1)
D. 39 + 27 = 3(19 + 9)
E. 48 + 28 = 4(12 + 7)
9. Hana made a mistake solving w − 16 = −25.
w − 16 = −25
w − 16 + 16 = −25 − 16
w = −41
The solution is −41.
a. Identify Hana’s mistake and explain what she should have done to solve the problem correctly.
b. Solve for w.
Name Date
Looking for Patterns
Describing Patterns
Draw on the polygons to decompose them if it helps you explain your thinking.
Name
Date
Examine the pattern of pentagons. The side length of each pentagon is 1 unit.
a. Describe the total number of 1-unit line segments for figure n.
b. Write an expression for your description in part (a).
Name Date
In this lesson, we
• examined and extended visual patterns.
• wrote expressions to describe patterns.
1. Examine the pattern of pentagons.
a. How many line segments are required to draw figure 6? 25 line segments are required to draw figure 6.
Each figure has 4 more line segments than the previous figure. Figure 5 has 21 line segments.
b. Complete the table. The side length of each pentagon is 1 unit.
Only the line segments on the outside of the figure count toward the perimeter.
The number of line segments in each figure is 1 more than 4 times the figure number.
The perimeter of each figure is 2 more units than 3 times the figure number.
Name
1. Examine the pattern of squares.
Date
a. Draw figure 4 and figure 5.
b. Write an expression that can be used to find the number of squares in figure n.
c. Construct figure 10 and verify that the expression you wrote in part (b) gives the correct number of squares in the figure when n = 10.
d. Complete the table. The side length of each square is 1 unit.
Figure Number
Number of 1-Unit Line Segments Perimeter (units)
2. Examine the pattern of triangles.
a. Draw figure 5 and figure 6.
b. Complete the table. The side length of each triangle is 1 unit.
Figure Number
Number of 1-Unit Line Segments Perimeter (units)
c. Verify that the expression you wrote for the perimeter of figure n gives the correct perimeter of figure 10
3. Examine the pattern.
a. Draw figure 4 and figure 5
b. Write an expression that can be used to find the number of triangles inside figure n
c. Construct figure 10 and verify that the expression you wrote in part (b) is valid when n = 10
10
d. Complete the table. The side length of each polygon is 1 unit. Figure Number
of Line Segments
4. Examine the pattern of bees.
a. How many bees will be in figure 4?
b. Describe how to find the number of bees in figure n.
5. Examine the pattern of mice.
a. How many mice will be in figure 4?
b. Describe how to find the number of mice in figure n.
Remember
For problems 6 and 7, evaluate.
9. Find the solution to g 7 = 8 by using the given method.
a. Solve by using tape diagrams.
b. Solve algebraically.
Name Date The Commutative, Associative, and Distributive Properties
1. Match each expression in table 1 to an expression in table 2.
Table 1
9 + p + 2
9(p + 2)
9 ⋅ 2 ⋅ p
p) 6 9 + ( p + 6)
9p + 54
Table 2 (9 + p) + 6
9p + 18
9 ⋅ ( p ⋅ 6)
9( p + 6)
2 ⋅ 9 ⋅ p p + 9 + 2
Complete the statements in the tree map, and provide examples of each property.
Commutative
If a and b are real numbers, then Multiplication
If a and b are real numbers, then Addition
Properties of Arithmetic
Associative
If a , b , and c are real numbers, then Multiplication
If a , b , and c are real numbers, then Addition
If a , b , and c are real numbers, then Distributive
Example
An algebraic expression is a number, a variable, or the result of placing previously generated algebraic expressions into the blanks of one of the four operators, ( ) + ( ),
or into the base blank of an exponentiation with an exponent that is a rational number, (
2. Write some examples of algebraic expressions.
Two expressions are equivalent expressions if both expressions evaluate to the same number for every possible value of the variables.
If we can rewrite one expression as the other by using the commutative, associative, and distributive properties and the properties of exponents, then the two expressions are equivalent.
3. Write two equivalent expressions. Explain why the expressions are equivalent.
4. Write a nonexample of two equivalent expressions. Explain why the expressions are not equivalent.
5. Show that −8(−5b + 7) + 5b is equivalent to 45b − 56 by using a flowchart and a two-column table.
6. Show that 3( y + 2) + 9x is equivalent to 3(3x + y) + 6 by completing the flowchart. Write the property or operation used in each step on the line next to the double-ended arrow.
7. Show that y(4 + y) − 12 − y2 is equivalent to 4y − 12 by completing the two-column table. Write the property or operation used in each step.
8. Show that 2(5a − 7 − 8 + 10a) is equivalent to 30(a − 1) by writing the property or operation used in each step on the line next to each double-ended arrow.
9. Show that 2(3a) − a(b + 10) + 8(ab + 10) is equivalent to 7ab − 4a + 80. Organize your work in a two-column table or a flowchart.
Name Date
Show that 6 + 5w − 3(w + 5) and 2w − 9 are equivalent expressions by writing the property or operation used in each step.
Expression
6 + 5w − 3(w + 5)
6 + 5w − 3w − 15
6 − 15 + 5w − 3w −9 + 2w
2w − 9
Property or Operation Used
Name Date
In this lesson, we
• used the commutative, associative, and distributive properties to rewrite algebraic expressions.
• applied properties and operations to show that two algebraic expressions are equivalent.
The Distributive Property
If a, b, and c are real numbers, then
a(b + c) = ab + ac.
3(2 + 4) = 3 ⋅ 2 + 3 ⋅ 4
6(t + 5) = 6t + 30
The Associative Property of Addition
If a, b, and c are real numbers, then
(a + b) + c = a + (b + c).
(3 + 2) + 4 = 3 + (2 + 4)
(6 + t) + 5 = 6 + (t + 5)
The Commutative Property of Addition
If a and b are real numbers, then a + b = b + a.
3 + 2 = 2 + 3
6 + t = t + 6
An algebraic expression is a number, a variable, or the result of placing previously generated algebraic expressions into the blanks of one of the four operators, ( ) + ( ), ( ) − ( ), ( ) ( ), ( ) ÷ ( ), or into the base blank of an exponentiation with an exponent that is a rational number, ( )( ) .
The Associative Property of Multiplication
If a, b, and c are real numbers, then
(a ⋅ b) ⋅ c = a ⋅ (b ⋅ c).
(3 ⋅ 2) ⋅ 4 = 3 ⋅ (2 ⋅ 4)
(6 ⋅ t) ⋅ 5 = 6 ⋅ (t ⋅ 5)
The Commutative Property of Multiplication
If a and b are real numbers, then a ⋅ b = b ⋅ a.
3 ⋅ 2 = 2 ⋅ 3
6 ⋅ t = t ⋅ 6
1. Show that 6 + 10x (2x 3) 20x 2 is equivalent to 30x + 6 by writing the property or operation used in each step next to each double-ended arrow.
distributive property
The arrows are double-ended to show that the expressions on each end are equivalent to each other.
commutative property of addition
addition of like terms
commutative property of addition
2. Show that 2(7a) − 3(4a − 1) is equivalent to 2a + 3 by writing the property or operation used in each step. Leave this box blank because the expression in this row is the original expression.
Multiplication
For problems 1–4, write two equivalent expressions for each situation.
1. Total length of both segments
2. Area of the rectangle
For problems 5–10, identify the property that justifies why each pair of expressions is equivalent.
+
11. Show that 2(3x + 2) − 4(3x + 2) is equivalent to −6x − 4 by writing the property or operation used in each step.
12. Show that −8 + x(x + 3) + 4( y + 3) is equivalent to x2 + 3x + 4( y + 1) by writing the property or operation used in each step.
13. Show that −4a + (a + 2) ⋅ 3a − 3a2 is equivalent to 2a by writing the property or operation used in each step on the line next to each double-ended arrow.
14. Show that 2g + 8(g − 4) − 7g is equivalent to 3g − 32 by completing the flowchart. Write the property or operation used in each step on the line next to each double-ended arrow.
2g + 8(g – 4) – 7g
2g + 8g – 32 – 7g
2g – 7g + 8(g – 4)
2g + 8g – 7g – 32
2g – 7g + 8g – 32
3g – 32
15. Show that (5p + 3) − 4 − 9p is equivalent to −1 − 4p by using a flowchart or a two-column table. State the property or operation used in each step.
16. Show that 2(2 + n3) + n(5n2 + 2) is equivalent to 7n3 + 2n + 4. Write the property or operation used in each step.
For problems 17 and 18, evaluate.
19. Evaluate. 1 2 x + 1 3 y + 9 for x = 8 and y = 27
For problems 20 and 21, solve the equation.
x − 2) = 28
Name Date
1. A clothing store is having a sale where a 20% discount is applied at checkout. You also have a coupon for $10 off, which can also be applied at checkout. Is it a better deal to apply the $10 coupon before or after the 20% discount, or does it matter? Explain.
2. Let x represent the total purchase price in problem 1.
a. What does the expression x − 0.2x − 10 represent in this situation?
b. What does the expression 0.8x − 10 represent in this situation?
c. What does the expression 0.8(x − 10) represent in this situation?
3. On Monday nights, a bowling alley charges $10 per person and $3.80 for each person’s shoe rental. On Wednesday nights, the same bowling alley charges $12 per person with no charge for shoe rental.
a. Write an expression that represents the total cost for p people to bowl on a Monday night.
b. Write an expression that represents the total cost for p people to bowl on a Wednesday night.
c. Which expressions represent the total cost for p people to bowl if each person bowls on both a Monday night and a Wednesday night? Choose all that apply.
A. 10p + 3.8p + 12p
B. 10p + 3.8p
C. 25.8p
D. 3.8p + 22p
E. 12p
4. Zara works as a customer service representative for an online clothing store. At the beginning of the day, Zara begins responding to messages in the company’s email inbox. The expression 105 − 15n models the number of messages remaining in the inbox n hours after Zara began responding to the messages.
a. What does 105 represent in this situation?
b. What does −15 represent in this situation?
5. The expression 105 + 5n − 20n also models the number of messages remaining in the inbox n hours after Zara began responding to them.
a. Is 105 + 5n − 20n equivalent to the expression given in problem 4? Explain.
b. Based on the expression 105 + 5n − 20n, what might be happening in this situation?
6. Nina and Fin are raising money for charity by asking for cash donations and selling T-shirts. The expression 250 + 8n models the total amount of money Nina raised, where n represents the number of T-shirts Nina sold. The expression 175 + 8f represents the total amount of money Fin raised, where f represents the number of T-shirts Fin sold.
a. Who raised more money in cash donations? Explain.
b. What is the price that Nina and Fin sold each T-shirt for? How do you know?
c. What does the expression (250 + 8n) + (175 + 8f ) represent?
d. Show that 8(n + f ) + 425 is equivalent to the expression given in part (c).
e. What does the expression (n + f ) represent in part (d)?
f. What does 425 represent in part (d)?
7. Write a situation that can be modeled by the expression 50x + 100
Name Date
Computer World sells a certain laptop model for a markup price that is 15% more than its purchase price p. During a one-week sale, the markup price was discounted by $100. The expression 12(1.15p − 100) represents the total amount of money in dollars from the sale of this laptop model for that week.
a. What does 1.15p represent in this situation?
b. What does −100 represent in this situation?
c. What does 12 represent in this situation?
Name Date
In this lesson, we
• described what the coefficients and terms of a linear expression represent in a given situation.
• interpreted linear expressions that represent different situations.
• created a situation that could be modeled by a given expression.
1. At a local pizza restaurant, the price of one slice of pizza is $2.25 more than the price of one soda, which is x dollars. Bahar and Angel get dinner at the pizza restaurant. The expression 2x + 3(x + 2.25) models the total price of their dinner.
a. What does the expression 2x represent in this situation?
The expression 2x represents the price of 2 sodas.
b. What does the expression x + 2.25 represent in this situation?
The expression x + 2.25 represents the price of 1 slice of pizza.
c. What does the expression 3(x + 2.25) represent in this situation?
The expression 3(x + 2.25) represents the price of 3 slices of pizza.
d. Write an expression that represents the total price of their dinner if they instead purchased 1 soda and 4 slices of pizza. x + 4(x + 2.25)
e. Write an equivalent expression to your answer for part (d).
Sample: 5x + 9
To write a new expression, consider how the coefficients and terms in the original expression change based on the context.
2. Write a situation that can be modeled by the expression 1.25p + 7.50.
Sample: Huan paid $7.50 for a notebook and bought p pencils that cost $1.25 each.
When deciding on a context that can be modeled by a specific expression, identify the part of the context that is constant and the part that changes.
Name Date
1. Mason played 4 games at the arcade on his own, and then he played g more games after meeting up with his friends. Mason paid $0.75 to play each game.
a. What does the expression 4 + g represent in this situation?
b. What does the expression 0.75(4 + g) represent in this situation?
c. What does the expression 3 + 0.75g represent in this situation?
2. Li Na watched 3 videos on her phone before school and then watched v more videos after school. Each video was 2 minutes long. The expressions 6 + 2v and 2(3 + v) both model this situation.
a. What does each part of the expression 6 + 2v represent in this situation?
b. What does each part of the expression 2(3 + v) represent in this situation?
3. On Fridays, a water park charges $25 per person and $8 to rent an inner tube. On Saturdays, the same water park charges $26 per person, and there is no charge to rent an inner tube.
a. Write an expression that represents the total cost for n people to go to the water park on Friday if each person rents an inner tube.
b. Write an expression that represents the total cost for n people to go to the water park on Saturday.
c. Suppose n people go to the water park on both Friday and Saturday. Write an expression that represents the total cost if each person rents an inner tube both days.
d. Write an equivalent expression to your answer for part (c).
4. A bookstore sells each book at a 40% markup. The expression 0.4b + b models the selling price of each book, where b represents the manufacturer’s price of a book in dollars.
a. What does 0.4 represent in this situation?
b. The expression 1.4b also models the selling price of each book. Is this expression equivalent to the expression in problem 4? Explain.
5. An indoor gym charges rock climbers the following fees:
• An hourly harness rental fee
• An hourly shoe rental fee, which is twice as much as the harness rental fee
• A monthly fee for using the facilities
Angel spends the same number of hours h rock climbing each time he goes to this gym. The following expressions each model the total amount of money Angel spent on rock climbing during the same month at this gym:
5(h(1 + 0.50)) + 15
5(h + 0.50h) + 15
5(1.50h) + 15
a. What does 5 represent in this situation?
b. What does 1 represent in this situation?
c. What does 0.50 represent in this situation?
d. What does 1.50 represent in this situation?
e. What does 15 represent in this situation?
f. What does the expression 1.50h represent in this situation?
g. What does the expression h + 0.50h + 15 represent in this situation?
6. Write a situation that can be modeled by the expression 3n + 25.
7. Write a situation that can be modeled by the expression 6a + 4b.
For problems 8 and 9, evaluate.
10. Evaluate 0.2x + 11 − 0.5y when x = 16 and y = 6.
11. Solve for x in the equation −4(x − 6) = −2(3x + 2) − 8.
In algebra, every statement is like a job posting. Think of it as a mathematical HELP WANTED sign, describing the role to be performed and the necessary qualifications. And who are the job applicants?


Numbers, of course.
Sometimes, every number fits the description. In these jobs, everyone gets hired.
So many qualified app
WANTED:
2(x+3) = 2x+6
Sometimes, no numbers fit the description. These jobs are impossibilities, like requiring that employees be age 25 or younger, with at least 30 years of job experience.
WANTED:

x+2 = x+3
Hd to raise the salary we’re ofering.
And sometimes—the most interesting times, in fact—certain numbers fit the description, while other numbers do not. These postings are like those for real jobs: selective, competitive, intriguing to study.
WANTED: x2 = 25
Congratulations. You’re both hired.
All across the sciences, we seek out numbers: a population’s size, a chemical’s concentration, a roller coaster’s speed. Though we don’t know what number we need, we know a fact or two about it. That’s where algebra comes in: to describe the number’s traits and then to recruit qualified applicants.

Remember, the next time you solve an algebraic equation, you’re the one doing the hiring.

Name Date
Read the following excerpt.
At the start of the 15th century, Johannes Gutenberg developed the printing press. Although Chinese monks had developed a printing technique around 600 CE, the technology was not used widely until the Gutenberg printing press was introduced. It could print much faster than other presses, which meant that publishers could produce more books and pamphlets for a lower cost. Thanks to Gutenberg’s printing press, more people could now afford books. New ideas in science and mathematics spread quickly.
A print shop needed to print the same number of copies of a novel as copies of a cookbook.
• The novel has twice as many pages as the cookbook.
• On day 1, all of the printing presses made copies of the novel.
• On day 2, the printing presses were split into two groups of equal size.
▸ The first group continued to print copies of the novel. The last novel was finished at the end of the day.
▸ The second group printed copies of the cookbook. There were still cookbooks left to print at the end of the day.
• On day 3, one printing press continued to print copies of the cookbook.
• On day 4, one printing press continued to print copies of the cookbook and finished at the end of the day.
• All of the printing presses printed pages at the same constant rate.
How many printing presses are at the print shop?
Record your notes and comments about work samples from other students.
Name Date
Evan is 7 years younger than his sister, Danna. The sum of their ages is 37. Using any method, find their ages.
Name Date
In this lesson, we
• solved a problem by reasoning quantitatively, by using a variety of strategies such as guess and check or creating tape diagrams.
• solved a problem algebraically by creating an equation in one variable.
The number of adult tickets sold at a basketball game is 5 more than 2 times the number of student tickets sold. A total of 98 tickets are sold. How many adult tickets are sold?
Solve with a Tape Diagram
This section is 1 unit and represents the number of student tickets sold.
98 is the total number of tickets sold.
These sections are 2 units and represent 2 times the number of student tickets sold. 98 − 5 = 93 3 units = 93 1 unit = 31
There are 31 student tickets sold. 98 − 31 = 67
There are 67 adult tickets sold.
This section represents 5 tickets.
Let x represent the number of student tickets sold. Then 2x + 5 represents the number of adult tickets sold.
The sum of the number of student tickets sold and the number of adult tickets sold is the total number of tickets sold.
x + (2 x + 5) = 98
3x + 5 = 98
3x = 93 x = 31
There are 31 student tickets sold.
Substitute 31 for x in 2x + 5 to find the number of adult tickets sold.
2(31) + 5 = 62 + 5 = 67
There are 67 adult tickets sold.
Name Date
1. The larger of two numbers is 16 more than 3 times the smaller number. The sum of the two numbers is 62.
Nina used a tape diagram to find the two numbers. Find the error in Nina’s work and correct it. Then find the numbers. Smaller
2. Mason read 1 3 of his book on Monday. On Tuesday, he read half of the remaining pages. On Wednesday, he read 54 pages to finish the book. What is the total number of pages in Mason’s book? Use a tape diagram to solve.
3. A printing company will print equal numbers of textbooks and novels to complete an order.
a. A textbook has 3 times as many pages as a novel. Write expressions to represent the number of pages in each type of book.
b. Write an expression for the total number of pages if the order is for 2560 copies of each type of book.
c. The printing company needs to print a total of 1,925,120 pages to complete the order. Use your expression from part (b) to write and solve an equation to determine the number of pages in each type of book.
For problems 4–7, use any method to solve.
4. Levi is 4 years older than twice his younger brother’s age. The sum of their ages is 25. How old is each boy?
5. Three times the difference of a number and 5 is equal to the sum of the number and 12. What is the number?
6. Danna, Evan, and Mason combine their money to buy their friend a present. Evan spends $5.50 more than Danna. Danna spends $3.00 less than Mason. They spend a total of $25. How much money does each person spend?
7. Ji-won has $68, and Emma has $18. How much money will Ji-won have to give Emma so that Emma will have 4 times as much money as Ji-won?
For problems 8 and 9, solve the equation.
8. 2 5 + x = 4 9. x 3 = 2.1
10. Show that 7 + 2m + 6m(m + 3) and 6m2 + 20m + 7 are equivalent expressions. Write the property or operation used in each step.
For problems 11 and 12, solve the inequality.
11. x 5 > 13
12. 2 ≤ x + 7
Student Edition: Math 1, Module 1, Topic B, Lesson 6 5
Name Date
For problems 1–10, determine whether the sentence is true or false.
1. I am in math class.
2. The president of France is also the president of Mexico.
3. 4 + 1 = 3 + 2
4. 3 + 2 = 4 − 9
5. 3 + 2 > 4 − 9
6. 4 + 1 = 5 333
7. 1 + 1 = 1 23 5
8. (7 + 9)2 = 162
9. 32 + 42 = 72
10. 32 × 42 = 122
For problems 11–15, complete the table by using the provided equation or inequality to determine whether the number sentence is true or false for each value of x.
16. Solve the inequality. Write the solution set by using set-builder notation. Then graph the solution set on the number line.
b − 6 < −3
Solution set:
Name Date
Solve each equation or inequality. Write the solution set, and graph the solution set on a number line.
1. 8 + 2p = 2(p + 4)
2. 4 + x ≤ 7
Name Date
In this lesson, we
• determined whether equations and inequalities are true for different values of the variable.
• represented solution sets in set notation, in words, and on graphs.
An element of a set is an item in the set.
An empty set is a set that has no elements. Set-builder notation is a representation of a set that builds the set by describing what is in it. The set is denoted by curly braces containing a variable on the left followed by a vertical bar and constraints listed on the right of the bar.
1. The graph represents the solution set of an equation or inequality. Write the solution set. –1010 8967452301
The solution set of this problem is infinite, so we use set-builder notation. This solution set means “the set of all values of a such that a ≤ 0.”
2. Solve the equation 9 + 3x = 6x. Write the solution.
9 + 3x = 6x 9 = 3x
= x
The solution set of this problem is finite, so we use set notation. This solution set means “the set consisting of the number 3.”
For problems 3 and 4, solve the equation. Write the solution set, and then graph the solution set on a number line.
3. 6x − 12 = 6(x − 12)
6x 12 = 6(x 12)
6x 12 = 6x 72 12 = 72
The solution set of this problem is the empty set. This notation means “a set with no elements.”
4.
A graph of the empty set does not show any points or shading. 6x − 12 = 6(x − 2)
6x 12 = 6(x 2)
6x 12 = 6x 12
The solution set of this problem contains all values of x. This notation means “the set of all real numbers.”
A graph of the set of all real numbers shows shading on the entire number line, including both arrows.
Name
Date
For problems 1–4, each set is the solution set of an equation or inequality. Graph the solution set. 1.
For problems 5–8, each graph represents the solution set of an equation or inequality. Write the solution set.
9. What is the solution set of an equation? Explain in your own words.
For problems 10–13, write a sentence that interprets the solution set of the equation or inequality.
10. 19 + x = 10; {−9}
For problems 14–19, find the solutions to the equation. Write the solution set. 14.
For problems 20–23, solve the equation or inequality. Write the solution set, and then graph the solution set on the number line.
24. The equation A = l ⋅ w gives the area of a rectangle in square units with length l units and width w units.
a. Find A when l = 10 and w = 15.5.
b. Find l when A = 26 and w = 2.
c. Find w when A = 9 and l = 1 2 .
25. Create an equation in one variable with one solution. Write the solution set.
26. Revise one expression from the equation you created in problem 25 so the solution set of the new equation is all real numbers.
27. Revise one expression from the equation you created in problem 25 so that the new equation has no solution.
For problems 28 and 29, solve the equation.
30. A theater charges $8 for an adult ticket and $6 for a senior citizen ticket. The theater sells a total of 150 tickets. Write an expression that represents the total amount of money the theater makes when n adult tickets are sold.
For problems 31 and 32, solve the inequality.
Student Edition: Math 1, Module 1, Topic B, Lesson 77
Name Date
For problems 1 and 2, identify the solution set of the equation. Check your solution and describe your solution path.
1. 5(v − 4) = 100
Solution set: Check:
Solution path:
2. 3z + 1.6 = 2z
Solution set: Check:
Solution path:
For problems 3–5, without solving, write the property that justifies why the two equations must have the same solution set.
3. 5(v − 4) = 100 and (v − 4)5 = 100
4. 5(v − 4) = 100 and 5v − 20 = 100
5. 2[5(v − 4)] = 2(100) and (2 ⋅ 5)(v − 4) = 2(100)
Addition property of equality: For expressions a, b, and c, if a = b, then a + c = b + c
Multiplication property of equality: For expressions a, b, and c, if a = b, then ac = bc.
6. Complete the table by performing the indicated operation on both sides of the given equation to write a new equation. Then write the solution set of the new equation.
7. Tiah says 11 − 9q = −9 has the same solution set as 1 − 9q = −19 and shows the following work:
11 − 9q = −9
11 − 9q − 10 = −9 − 10
11 − 10 − 9q = −9 − 10
1 − 9q = −19
Do you agree with Tiah? Explain.
For problems 8–10, find the solution set of the equation. Choose the appropriate reason from the answer choices to justify each step. Write the solution set by using set notation.
Answer Choices
Commutative property of addition
Associative property of addition
Distributive property
Addition property of equality
8. gg 3 + = 2 7 14
Solution set:
Commutative property of multiplication
Associative property of multiplication
Addition of like terms
Multiplication property of equality
9. 3x + 7 = 3 + 8x − 16
Solution set:
10. 6(2 + x) + 4 x − 19 = −18 x − 3
Solution set:
Name Date
Solve the equation 2 x − 3(x − 2) = 4 x + 34. Choose the appropriate reason from the answer choices to justify each step, and write the solution set by using set notation.
Answer Choices
Commutative property of addition
Associative property of addition
Distributive property
Addition property of equality
Commutative property of multiplication
Associative property of multiplication
Addition of like terms
Multiplication property of equality
Name Date
In this lesson, we
• solved linear equations.
• verified that applying the properties of arithmetic preserves the solution set of an equation.
• observed that adding the same expression to both sides of an equation or multiplying each side of an equation by the same nonzero number preserves its solution set.
• justified each step in solving an equation by applying properties and operations.
1. Explain why the equations −3(m − 5) = 8(m + 3) and −6(m − 5) = 48 + 16m have the same solution set.
I can multiply both sides of the first equation by 2. This preserves the solution set because I multiplied by a nonzero number.
2(−3(m − 5)) = 2(8(m + 3))
I can use the associative property of multiplication to regroup the factors. This preserves the solution set.
(2(−3))(m − 5) = (2 ⋅ 8)(m + 3)
−6(m − 5) = 16(m + 3)
The associative property of multiplication states that you can regroup the factors to multiply 2 and −3 first.
I can use the distributive property to rewrite 16(m + 3) as 16m + 48. This preserves the solution set.
−6(m − 5) = 16m + 48
I can use the commutative property of addition to rewrite 16m + 48 as 48 + 16m. This preserves the solution set.
−6(m − 5) = 48 + 16m
The original equation is −3(m − 5) = 8(m + 3).
The equations −3(m − 5) = 8(m + 3) and −6(m − 5) = 48 + 16m have the same solution set because each step I used preserved the original equation’s solution set.
For problems 2–4, find the solution set. Write the property or operation used in each step.
2. 9x − 5 = 10x − 5 9x − 5 = 10x − 5
−5 = x − 5 0 = x
The solution set is {0}.
Addition property of equality
Addition property of equality
The solution set {0} means that the equation is true only when x equals 0. The solution set {0} is not the same as { }.
Distributive property
Commutative property of addition
Addition of like terms
The solution set is ℝ.
The resulting expressions are identical. Therefore, the expressions evaluate to the same number for all values of x
8(x − 2) = 4(5x −1)
8x − 16 = 20x − 4
−16 = 12 x − 4
−12 = 12 x
−1 = x
The solution set is {−1}.
Multiplication property of equality
Multiplication
Distributive property
Addition property of equality
Addition property of equality
Multiplication property of equality
For problems 1–4, without solving, write all properties that justify why the two equations must have the same solution set.
1. x 4 = 10 and 4 + x = 10
2. 6(5x) = 90 and (6 ⋅ 5)x = 90
3. 2 x + 10 = 40 and 2(x + 5) = 40
x = 10
For problems 5 and 6, without solving, explain why the two equations have the same solution set. Include references to properties in your answer.
5. 3(a + 5) = −4a + 8 and 9(a + 5) = −12(a − 2)
6. 3w + (8 + 6w) + 2w = 180 and 11w = 172
7. For each step, write the property or operation that was used.
9x − 3 + 2 x + 4 = 8(x − 3) + 4
9x − 3 + 2 x + 4 = 8 x − 24 + 4
9x + 2 x − 3 + 4 = 8 x − 24 + 4
11x + 1 = 8 x − 20
3x + 1 = −20
3 x = − 21
x = − 7
For problems 8–13, find the solution set of the equation.
For problems 14 and 15, solve the equation. Write the property or operation used in each step. Write the solution set by using set notation.
14. 5x + 7 = 4x + 7
16. Nina and Angel both solved an equation. They compared their solution paths. The beginning steps of each path are shown.
Nina’s Work 1 (x + 3 ) = 4 3 x + 555 + x 1 _ x + 3 _ = 4 _ 555 x + 3 _ 5 + x
a. Complete Nina’s work and Angel’s work. Write each solution set by using set notation.
b. Explain why Nina and Angel will both arrive at the same solution set. Use properties or operations to justify your response.
For problems 17 and 18, solve the equation.
19. Mr. Wu’s age is 7 years more than twice Riku’s age. The sum of their ages is 58. How old is Riku?
For problems 20 and 21, solve the inequality.
Student Edition: Math 1, Module 1, Topic B, Lesson 8 LESSON
Name Date
1. Consider the equations x + 1 = 4 and (x + 1)2 = 16.
a. What is the solution set of x + 1 = 4?
b. Verify that both 3 and −5 are solutions to (x + 1)2 = 16.
2. Consider the equations x − 2 = 0 and (x − 2)2 = 0
a. What is the solution set of x − 2 = 0?
b. Verify that 2 is a solution to (x − 2)2 = 0.
c. Are there any other solutions to (x − 2)2 = 0? How do you know?
3. Based on your results from problems 1 and 2, do you think squaring both sides of an equation preserves the solution set of the original equation? Explain.
4. Consider the equation x − 3 = 5.
a. Multiply both sides of the equation by a nonzero constant, and verify that the solution set of the new equation is the same as the original equation.
b. Based on your results, does multiplying both sides of an equation by a nonzero constant preserve the solution set of the original equation? Explain.
5. Consider again the equation x − 3 = 5.
a. Multiply both sides of the equation by x, and verify that 8 is a solution to the new equation.
b. Verify that 0 is also a solution to the equation from part (a).
c. Based on your results from problems 4 and 5, does multiplying both sides of an equation by an algebraic expression always preserve the solution set of the original equation? Explain.
For problems 6 and 7, solve for x and then check the solution.
8. The following problem was written by Muhammad ibn Mūsā al-Khwārizmī, known as the father of algebra:
You have separated ten into two parts, and you have divided one by the other; the obtained quotient is four. Find the two parts.
a. Write an equation that represents the problem.
b. Solve the equation to answer the problem.
Name Date
Consider the equation x + 3 = 10, which has a solution set of {7}
a. Add x to both sides of x + 3 = 10, and verify that the solution set of the new equation is {7}.
b. Multiply both sides of x + 3 = 10 by x and verify that 7 is a solution to the new equation.
c. Verify that 0 is also a solution to the equation from part (b).
Name Date
In this lesson, we
• discovered that not all steps taken when solving an equation preserve the solution set of the original equation.
• explored steps that are not guaranteed to preserve the solution set, such as squaring both sides of an equation and multiplying both sides of an equation by a variable expression.
1. Consider the equation 4 x − 3 = x + 9
a. Find the solution set of 4 x − 3 = x + 9.
The solution set is {4}.
b. Verify that adding x + 5 to both sides of 4x − 3 = x + 9 preserves the solution set.
The solution set is {4}
Adding an expression to both sides of an equation preserves the solution set.
c. Verify that multiplying both sides of 4 x − 3 = x + 9 by x + 5 results in a new equation with a different solution set that includes −5
(4 x − 3)(x + 5) = (x + 9)(x + 5)
Substitute −5 for x to verify that −5 is also a solution to the new equation.
Left side: (4(−5) − 3)(−5 + 5) = −23(0) = 0
Right side: (−5 + 9)(−5 + 5) = 4(0) = 0
2. Consider the equation 3 x = x − 4.
a. Find the solution set of 3 x = x − 4
The solution set of the new equation is {−5, 4}. So multiplying both sides of this equation by an algebraic expression resulted in a new equation with a different solution set.
3 x = x − 4
2 x = −4
x = −2
The solution set is {−2}
b. Square both sides of 3 x = x − 4. Verify that −2 is a solution to the resulting equation.
(3 x)2 = (x − 4)2
Substitute −2 for x to verify that −2 is a solution.
Left side: (3(−2))2 = (−6)2 = 36
Right side: (−2 − 4)2 = (−6)2 = 36
c. Verify that 1 is also a solution to the resulting equation.
(3 x)2 = (x − 4)2
Substitute 1 for x to verify that 1 is also a solution.
Left side: (3(1))2 = (3)2 = 9
Right side: (1 − 4)2 = (−3)2 = 9
The solution set of the resulting equation is {−2, 1}. So squaring both sides of this equation resulted in a new equation with a different solution set.
Name
Date
1. Consider the equation a = 3. Create a new equation by performing the step described. Then write the solution set of the new equation.
a. Square both sides of a = 3.
b. Cube both sides of a = 3.
2. Consider the equation x + 4 = 3x + 2.
a. Find the solution set of x + 4 = 3x + 2.
b. Verify that adding x − 4 to both sides of x + 4 = 3x + 2 creates a new equation that has the same solution set.
c. Verify that multiplying both sides of x + 4 = 3 x + 2 by x − 4 creates a new equation that has a different solution set that includes 4
3. Consider the equation x + 2 = 2 x.
a. Find the solution set of x + 2 = 2 x.
b. Square both sides of x + 2 = 2 x, and verify that your solution satisfies this new equation.
c. Verify that 2 3 is also a solution to the new equation.
For problems 4–7, solve the equation for x.
4. x 4 = 1 12
For problems 8 and 9, solve the equation.
10. Solve the equation. Write the solution set by using set notation, and graph the solution set on the number line.
For problems 11 and 12, solve the inequality.
Student Edition: Math 1, Module 1, Topic B, Lesson 9
Name Date
Writing and Solving Equations in One Variable
Polyomino Squares
LESSON 9
Creating and Solving Equations
Solve each problem by writing and solving an equation.
1. Angel has $5.45 in quarters and dimes. He has 5 fewer dimes than quarters. How many of each coin does Angel have?
2. Fifteen years from now, Tiah’s age will be twice her age 12 years ago. What is Tiah’s current age?
3. Bahar and Huan filled bags of popcorn to sell at a baseball game.
• Huan filled 25% more bags of popcorn than Bahar.
• After the game, 15% of the total number of their bags was not sold.
• The bags sold for $0.75 each.
• Bahar and Huan made a total of $114.75 selling bags of popcorn.
How many bags of popcorn did each person fill?
Name Date
Nina sells tickets to the school play. Adult tickets are $8 each, and student tickets are $5 each. She sells 15 fewer student tickets than adult tickets. If the total amount of Nina’s ticket sales are $315, how many student tickets does she sell?
In this lesson, we
• wrote equations in one variable.
• used equations in one variable to solve problems.
1. A bowling alley offers two options for the cost of bowling:
• $5.75 per game plus a fee of $3.50 for each player’s shoe rental or
• $32.25 per hour with no fee for shoe rental.
How many games must one player bowl in one hour for the costs of the two options to be the same?
Let g represent the number of games.
5.75 g + 3.50 = 32.25
5.75 g = 28.75
g = 5
A player must bowl 5 games in one hour for the costs of the two options to be the same.
2. The sum of Angel’s age now and his sister’s age now is 25. Three years ago, Angel’s age was 1 less than 3 times his sister’s age at that time. How old are Angel and his sister now?
Let a represent Angel’s age now. Then 25 − a represents his sister’s age now.
Also, a − 3 represents Angel’s age 3 years ago, and 22 − a represents his sister’s age 3 years ago.
a − 3 = 3(22 − a) − 1
a − 3 = 66 − 3 a − 1
a − 3 = 65 − 3 a
Three years ago, Angel’s sister was (25 − a) − 3, or 22 − a
One less than 3 times his sister’s age 3 years ago
Angel’s age
3 years ago
Angel is 17 years old now.
4 a − 3 = 65
4 a = 68
a = 17
Substitute 17 for a in 25 − a to find his sister’s age now.
25 − (17) = 8
Angel’s sister is 8 years old now.
Name
1. The pentomino can be placed on the grid to cover a set of numbers.
a. Where should the center of the pentomino be placed so that the sum of the five covered numbers is 55? Write a number sentence that verifies your placement of the pentomino.
b. Write an expression to represent the sum of any five numbers covered by the pentomino on the grid. Let n represent the number covered by the center of the pentomino.
c. Use your expression from part (b) to find n, the number covered by the center of the pentomino when the sum of the five covered numbers is 75. Write an equation that verifies your placement.
d. Use your expression from part (b) to find n, the number covered by the center of the pentomino when the sum of the five covered numbers is 118. Write an equation that verifies your placement.
2. Consider two integers. The first integer is 3 more than twice the second integer. Adding 21 to 5 times the second integer will give us the first integer. Find the two integers.
3. When the measures of the interior angles of a pentagon are listed in order from least to greatest, each successive angle measure increases by 20°. Write the measures of the angles.
4. Ana sells T-shirts and sweatshirts for the soccer team. The price of one sweatshirt is $10 more than the price of one T-shirt. She sells 50 T-shirts and 40 sweatshirts for a total of $1480. What is the price of one T-shirt? What is the price of one sweatshirt?
5. In a triangle, the measure of the first angle is half the measure of the second angle, and the measure of the third angle is 6° more than the measure of the first angle. Find the measures of the angles of the triangle.
6. A pet rescue center is creating a monthly food budget. The center currently has two-thirds as many dogs as cats. Each animal is fed 2 cans of food a day. Dog food costs $0.68 per can, while cat food costs $0.65 per can. The rescue center has budgeted a total of $2581.80 for food for this 30-day month. How many dogs does the rescue center have?
For problems 7 and 8, solve the equation.
7. −6r + 8 = −28
8. 32 = 4 − 9r + 6r
9. Solve the inequality. Write the solution set by using set notation, and graph the solution set on the number line.
10. Which equation correctly models the statement that −30 is 30 units from 0 on a number line?
A. (−30) = 30
B. −30 = 30
C. |30| = −30
D. |−30| = 30
Student Edition: Math 1, Module 1, Topic B, Lesson 10 LESSON
Name Date
1. A rectangular portion of a park will be fenced off to create a playground. A construction company donated a total of 117.5 feet of fencing. Based on the space provided to create the playground, the length of the playground must be 35.5 feet. Use the formula for the perimeter of a rectangle to determine what the width of the playground must be to use all the fencing.
2. Rearrange the perimeter formula P = 2(l + w) to isolate w.
3. The formula for the area of a rectangle is A = lw, where l represents the length and w represents the width.
a. Rearrange the formula to isolate l
b. Rearrange the formula to isolate w
4. To find the volume of a cylinder with radius r and height h, we use the formula V = πr 2h Rearrange the formula to isolate h
5. Angel decided to memorize three formulas that relate the volume V, area of the base B, and the height h of a right rectangular prism.
B = V h h = V B
V = Bh
Does he need to memorize all three formulas, or can he memorize just one? Explain your reasoning.
6. The formula for the equation of a line in standard form is A x + By = C, where A, B, and C are constants. Rearrange the formula to isolate y. Assume B ≠ 0
7. The formula for the surface area of a rectangular prism with a square base is SA = 2w2 + 4hw, where h represents the height of the prism and w represents the side length of the square base, with w ≠ 0. Rearrange the formula to isolate h
8. If F represents temperature in degrees Fahrenheit and C represents the same temperature in degrees Celsius, then the formula relating F and C is 5F − 9C = 160
a. Rearrange the formula so it is more convenient for the following situations.
Situation 1: A traveler to the United States from a country that measures temperature in degrees Celsius
Situation 2: A traveler from the United States to a country that measures temperature in degrees Celsius
b. Why would the two travelers prefer different formulas?
For each pair of equations in problems 9 and 10, first solve the equation that contains one variable. Then solve the equation that contains more than one variable.
Name Date
The kinetic energy K of an object depends on its mass m and its velocity v. The formula for kinetic energy is K = 1 2 mv 2, where v ≠ 0. Rearrange the formula to isolate m
Name Date
In this lesson, we
• compared solving equations with more than one variable to solving equations with one variable.
• rearranged formulas to solve for a specific quantity.
1. One formula for the surface area of a rectangular prism with length l, width w, and height h is SA = 2lw + 2(l + w)h. Suppose the surface area is measured in square inches and the length and width are each measured in inches.
a. Find the height of a rectangular prism when SA = 108, l = 6, and w = 4.
SA = 2lw + 2(l + w)h
108 = 2 ( 6 ) ( 4 ) + 2 ( 6 + 4 ) h
108 = 48 + 20 h
60 = 20 h
3 = h
The height of the rectangular prism is 3 inches.
Substitute the known values into the formula. Then solve the equation.
b. Using the formula SA = 2lw + 2(l + w)h, rearrange the variables to isolate h. Recall that SA = 108, l = 6, and w = 4
SA = 2lw + 2( l + w ) h
SA − 2lw = 2( l + w ) h
SA − 2lw = h 2(l + w)
Generally assume that shapes like rectangular prisms have positive side lengths. So the possibility of dividing by 0 is not a concern in the rearranged formula.
The rearranged formula is equivalent to the given formula. 108
The height of the rectangular prism is 3 inches. We get the same answer regardless of which arrangement of the formula we choose.
2. Solve each equation for n.
Equation Containing One Variable
n − 6 10 = 4
n − 6 10 = 4
n − 6 = 40
n = 46
Related Equation Containing More Than One Variable n
Apply the same properties of equality to solve for n
3. Rewrite the equation in slope-intercept form, y = mx + b.
Name
Date
1. The formula for the perimeter of a rectangle with length l and width w is P = 2(l + w)
a. Find the width of a rectangle when P = 92 and l = 13. The measurements are in centimeters.
b. Using the formula P = 2(l + w), isolate w first. Then find the width of the rectangle when P = 92 and l = 13.
2. The formula for the volume of a cylinder with radius r and height h is V = πr 2h. Suppose the volume is measured in cubic inches and the radius and height are each measured in inches.
a. Find the height of a cylinder when r = 4 and V = 112π.
b. Using the formula V = πr 2h, isolate h first. Then find the height of the cylinder when r = 4 and V = 112π.
For problems 3 and 4, solve the equation for the given variable.
Equation Containing One Variable
3. Solve 3 = m + 2 5 for m
4. Solve 13
5
3 for x.
Related Equation Containing More Than One Variable
for
where s ≠ 0.
5. Use problems 3 and 4 to compare each equation containing one variable to its related equation containing more than one variable. Explain how they are similar and how they are different.
For problems 6–11, rearrange the formula by isolating the given variable.
6. The formula for the perimeter of a square is P = 4s, where s is the side length.
Rearrange the formula to isolate s.
7. The formula for the circumference of a circle with radius r is C = 2πr.
Rearrange the formula to isolate r
8. The formula for the force on an object with mass m and acceleration a is F = ma.
Rearrange the formula to isolate m.
9. The formula for the perimeter of a triangle with side lengths a, b, and c is P = a + b + c
Rearrange the formula to isolate b.
10. The formula for the surface area of a prism is SA = 2B + ph, where B represents the area of the base, p represents the perimeter of the base, and h represents the height of the prism.
Rearrange the formula to isolate h.
11. The formula for the area of a trapezoid is A = ( a + b 2 )h. Rearrange the formula to isolate b.
For problems 12–15, rewrite the equation in slope-intercept form, y = mx + b.
+ 4y = 8
16. A snow cone consists of flavored ice that fills a right circular paper cone and sits on top of the cone in the shape of a hemisphere. The volume of a snow cone is estimated by the formula
V = 1 3 ��r 2h + 2 3 ��r 3
a. Rearrange the formula to isolate h h
b. Use the formula you wrote in part (a) to estimate the height of the paper cone of a snow cone that has an estimated volume of 17.08 cubic inches and a diameter of 3 inches.
17. When is it useful to rearrange a formula?
For problems 18 and 19, solve the equation.
18. 9 − 1.6t = −11
20. Write the property or operation used for each step in solving the equation
5(x + 4) + 6x = 11 − 3x.
5(x + 4) + 6x = 11 − 3x
5x + 20 + 6x = 11 − 3x
5x + 6x + 20 = 11 − 3x
11x + 20 = 11 − 3x
14 x + 20 = 11
14 x = − 9
x = − 9 14
21. Use the number line to answer each question.
a. Which points, if any, correspond to a number with an absolute value of 3? Explain.
b. Which points, if any, correspond to a number with an absolute value that is greater than 3? Explain.
c. Which points, if any, correspond to a number with an absolute value of −7? Explain.
Student Edition: Math 1, Module 1, Topic B, Lesson 11
For problems 1–4, let x be a real number. Determine whether the statement is always, sometimes, or never true.
Complete the statements in the tree map, and provide examples of each property.
Properties of Inequality
Multiplication
For expressions a and b and real number c : If a > b and c > 0 , then
For expressions a and b and real number c : If a > b and c < 0 , then Addition
For expressions a , b , and c : If a > b , then
Example
Example
Example
For problems 5–9, find the solution set of the inequality. Write the solution set by using set-builder notation, and then graph the solution set on the number line.
Solution set:
Solution set:
Solution set:
9. 2(x − 3) + x < 3(x + 4)
Solution set:
10. Fin and Bahar each solved the inequality 8 − 5x > −10 in class today. They found different solution sets.
a. Whose solution set is correct?
b. Explain the mistake.
11. Every student in Zara’s science class will have 5 test scores by the end of the grading period. Zara sets a goal to have at least a 90 average for the grading period. Her first four test scores are 97, 85, 96, and 89.
Write and solve an inequality to find the lowest score Zara must earn on the fifth test to meet her goal.
Find the solution set of each inequality. Write the solution set by using set-builder notation, and then graph the solution set on the number line.
Name Date
In this lesson, we
• formalized the addition and multiplication properties of inequality.
• solved inequalities and graphed the solution sets on the number line.
1. Find the solution set of the inequality 10 − 9w ≥ 28. Write the solution set by using set-builder notation, and then graph the solution set on the number line.
Method 1:
10 − 9 w ≥ 28
− 9 w ≥ 18
w ≤ − 2
Reverse the inequality symbol when applying the multiplication property of inequality with a negative value.
Method 2:
10 − 9 w ≥ 28
10 ≥ 9 w + 28
− 18 ≥ 9 w
− 2 ≥ w
Apply the addition property of inequality so that the coefficient of the variable term is positive.
{w | w ≤ −2}
2. One number is 5 less than half another number. The numbers have a sum of at most −68. What are the largest numbers that satisfy these conditions?
Let x represent the first number. Then 1 2 x − 5 represents the second number.
The phrase at most −68 indicates that the sum of the numbers must be less than or equal to −68
The largest number less than or equal to −42 is −42
The largest numbers that satisfy the given conditions are −42 and −26.
Name
For problems 1 and 2, graph the solution set on the number line.
1. {g | g > 4}
Date
2. {m | 3 ≤ m}
For problems 3–5, write the solution set that represents the graph shown on the number line.
6. Why is graphing solution sets of one-variable inequalities on number lines more helpful than graphing solution sets of one-variable equations on number lines?
For problems 7–10, place the correct inequality symbol in the box. Write the property used in each case.
For problems 11–14, find the solution set of the inequality. Write the solution set by using set-builder notation, and then graph the solution set on the number line.
11. 2c > −9
Solution set:
12. h − 7 < 3
Solution set:
13. 54 ≥ −6v
Solution set:
14. −9 ≤ 3 4 f
Solution set:
15. Write and solve an inequality that represents the statement that a number increased by 4 is greater than 16
For problems 16–18, find the solution set of the inequality. Write the solution set by using set-builder notation, and then graph the solution set on the number line.
16. −6b + 4 < 10
Solution set:
17. 2 5 u − 1 > 2 4
Solution set:
18. 2(g − 8) > 2g − 16
Solution set:
19. Evan buys 3 yards of fabric that is the same price per yard. He needs to have at least $5 left after making his purchase. He has a $50 bill. What’s the greatest price per yard Evan can pay for the fabric?
For problems 20–22, find the solution set of the inequality. Write the solution set by using set-builder notation, and then graph the solution set on the number line.
20. 2g + (g + 5) ≥ 6g − 10
Solution set:
21. 3 5 ( 10 b − 6 ) ≥ 16 b
Solution set:
22. 2 q + 4 < 5 2 q − 9 3
Solution set:
23. One number is 8 more than twice the other number. If the numbers have a sum of at least −22, what are the smallest numbers that satisfy these conditions?
24. Twelve more than four times a number is at most 42 more than twice the number. Find the solution set.
For problems 25 and 26, solve the equation.
27. In △ ABC, the measure of ∠B is twice the measure of ∠A, and the measure of ∠C is 40° less than the measure of ∠A. What are the measures of the three angles?
28. Order the following values from least to greatest.

What do algebraic solutions look like?

Well, first, do they even look like anything? In a sense, no. They’re not animals or planets or pieces of fruit. They’re numbers: colorless, furless, and faceless. They are not inherently visual. Yet, mathematicians love visualizing them. One way they do this is with a number line, which is a kind of mathematical viewing screen. On the number line, numbers appear as points. You might say that arithmetic enters our eyes as geometry.


Some solution sets (say, of |x| = 2) form isolated points, like stars in the night sky.

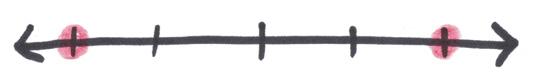
-2-1012
Other solution sets (say, of |x| ≤ 2) fill whole regions, somewhat like the stars of the Milky Way, which are so numerous that they form a bright smear across the sky.
-2-1012
What if there are more variables: y, z, and beyond? Then things get tricky, and mathematicians get excited. This is the idea behind algebraic geometry, a branch of advanced mathematics. It has birthed some stunning images: distant cousins of what we see on our number lines, showing what complicated solution sets look like. These are the quasars and nebulae and black holes of mathematics—strange cosmic wonders only state-of-the-art telescopes can view.
Now, here’s the real question: What do algebraic solutions taste like?


Student Edition: Math 1, Module 1, Topic C, Lesson 12 LESSON
Name Date
For problems 1–4, use one or more inequalities to represent the height requirements of a rider for the rides at Epic Park.
Let h represent the height of a rider in inches.
For problems 5–13, determine whether the statement is true or false.
5. Right now, I am in math class, and I am in English class.
6. Right now, I am in math class, or I am in English class.
7. Ice is cold, and fire is hot.
8. Ice is cold, or fire is hot.
A statement is a sentence that is either true or false, but not both.
A compound statement consists of two or more statements connected by logical modifiers, like and or or.
For problems 14–16, solve each compound statement. Write the solution set by using set notation. Then graph the solution set on the given number line.
14. y + 8 = 3 or y 6 = 2
15. d 6 = 1 and d + 2 = 9
16. 2w 8 = 10 and w > 9
17. x < 3 and x > −1
a. Using a colored pencil, graph the inequality x < 3.
b. Using a different colored pencil, graph the inequality x > −1.
c. Using a third colored pencil, darken the section of the number line where x < 3 and x > −1.
d. Write the solution set by using set-builder notation.
e. How many solutions to this compound inequality are there? Explain.
f. Write the given compound inequality in a more efficient way.
18. x < −1 or x > 3
a. Using a colored pencil, graph the inequality x < −1
b. Using a different colored pencil, graph the inequality x > 3.
c. Write the solution set by using set-builder notation.
For problems 19–22, write the solution set of the compound statement by using set-builder notation. Then graph the solution set on the number line.
23. Each student has to present a speech in English class. The guidelines state that the speech must be at least 7 minutes, but it must not exceed 12 minutes. Write a compound inequality for the possible lengths of the speech.
24. The element mercury has a freezing point of −37.9°F and a boiling point of 673.9°F. Mercury is liquid between these temperatures. Write a compound inequality for the temperatures at which mercury is a liquid.
25. The internal temperature of a cooked steak must be at least 145°F when warm or below 40°F when refrigerated. At any other temperature, bacteria can grow and make the steak unsafe to eat. Write a compound inequality for the internal temperature of a cooked steak that is safe to eat.
Name Date
1. Match each compound statement to the graph of its solution set on the number line.
A. x = 5 or x = −10
B. x < 5 and x > −10
C. x > 5 or x < −10
D. x ≥ 5 or x ≤ −10 E.
2. The acceptable range of chlorine levels in swimming pools is at least 1 part per million and no more than 3 parts per million. Write a compound inequality for the acceptable range of chlorine levels in a swimming pool.
Name Date
In this lesson, we
• described solution sets of two equations or two inequalities joined by and or or.
• graphed solution sets of two equations or two inequalities joined by and or or on a number line.
• wrote compound statements to describe contexts.
For problems 1–3, graph the solution set of the compound statement.
A statement is a sentence that is either true or false, but not both.
A compound statement consists of two or more statements connected by logical modifiers, like and or or.
The connecting word is or. Solutions must make at least one part of the compound statement true.
The graph of the solution set consists of both regions.
3. c ≥ −7 and c ≤ 2
The connecting word is and. Solutions must make both parts of the compound statement true.
The graph of the solution set is the region where the graphs of c ≥ 7 and c ≤ 2 overlap.
4. Write a compound inequality for the graph.
−4 ≤ m ≤ 6
Another way to write this compound inequality is m ≥ 4 and m ≤ 6.
5. Consider the compound inequality −5 < x ≤ 5
a. Rewrite as a compound statement separated by and or or.
x > −5 and x ≤ 5
b. Graph the compound inequality.
c. How many solutions are there to the compound inequality?
There are infinitely many solutions to the compound inequality.
6. Write a compound inequality to represent the situation.
The car repair is expected to cost at least $100 but no more than $150.
Let r represent the cost for the car repair in dollars. 100 ≤ r ≤ 150
The phrases at least and no more than indicate that the inequality should include the values 100 and 150.
Name Date
For problems 1–6, write whether the compound statement is true or false.
1. 6 + 1 = 7 and 8 − 6 = 2
2. 5 > 3 or 7 < 1
3. 3 · 4 = 12 and 1 2 · 7 = 4
4. 9 · 1 < 22 or 21 3 > 6
For problems 7–16, graph the solution set of the statement on the given number line.
7. x = −2 or x = 8
12. d < 9 and d > 7
13. v > −3 and v < 5
14. 3 c ≤ 4 or 1 c > 2
15. 1 q ≤ − 2 4 or 1 q ≥ 2 4
16. x = −2 and x = 8
For problems 17 and 18, write a compound inequality for each graph.
17.
19. Consider the compound inequality 0 < x < 3.
a. Rewrite the compound inequality as a compound statement connected by and or or
b. Graph the compound inequality on a number line.
c. How many solutions to the compound inequality are there?
20. Consider the compound inequality −1.75 ≤ u < 4.
a. Rewrite the compound inequality as a compound statement connected by and or or.
b. Graph the compound inequality on a number line.
21. Consider the inequality n ≤ 6.
a. Rewrite the inequality as a compound statement connected by and or or.
b. Graph the inequality on a number line.
For problems 22–26, write a single or compound inequality for the situation.
22. The scores on the last test ranged from 65% to 100%
23. To ride the roller coaster, a person must be at least 48 inches tall.
24. Unsafe body temperatures are those lower than 96°F or above 104°F.
25. For a shark to survive in an aquarium, the water in its tank must be at least 18°C and no more than 22°C.
26. Children and senior citizens receive a discount on tickets at the movie theater. The discount applies to children who are 2 to 12 years of age as well as adults who are 60 years of age or older.
27. Consider the following compound statements.
> −1
Does changing the word and to or change the solution set? Explain and graph the solution sets of both statements.
For problems 28 and 29, solve the equation.
30
30. Without solving, explain why the equations 5x + 6 = 3 − 4 x and 18 + 15x = 9 − 12 x have the same solution set. Include properties in your answer.
31. A soccer team’s coach made a dot plot showing the number of goals scored in each game this season.
Goals Scored in Games This Season
0123456
Number of Goals
a. How many games did the soccer team play this season?
b. In how many games this season did the soccer team score at least 2 goals?
c. What is the total number of goals the team scored this season?
Student Edition: Math 1, Module 1, Topic C, Lesson 13
Name Date
Solving and Graphing Compound Inequalities
Solving Compound Inequalities
LESSON
For each clue, complete the following steps to determine the mystery integer.
• Find the solution set of the compound inequality.
• Write the solution set in set-builder notation.
• Graph the solution set by using the tools on the corresponding slide.
• Guess what the mystery integer is. Write your guess in the table and enter it in the box on the corresponding slide.
A. When I double the mystery integer and then add 1, the result is less than or equal to − 3 or greater than or equal to 9.
B. When I subtract 2 from the mystery integer and then triple that difference, the result is strictly between − 21 and 12
< 3(x − 2) < 12
C. Half the sum of the opposite of the mystery integer and 5 is less than 3 or greater than 4.
What is the mystery integer?
and
most
D. The difference between the mystery integer and 1 _ 3 of the integer is at least
They Look the Same
Name Date
Solve each compound inequality. Write the solution set by using set-builder notation. Then graph the solution set on the number line.
1. 9 + 2x > 15 or 7 + 4x < −9
Name
In this lesson, we
• found solution sets of compound inequalities.
• graphed solution sets of compound inequalities.
For problems 1 and 2, find the solution set of the compound inequality. Write the solution set in set-builder notation. Then graph the solution set on the number line.
Name
Date
For problems 1–4, write and or or to complete the compound inequality so that the solution set is neither the empty set nor the set of all real numbers.
1. x > −2 x < 12
2. x > 4 x < −1
3. x + 1 > 3 x + 1 < −3
4. 1 3 1 x > 0 3 x < 4
For problems 5–7, write each compound inequality as one statement without the word and. Then write a sentence describing all possible values of x that satisfy the compound inequality.
5. x > −6 and x < −1
6. x ≤ 5 and x > 0
7. 1 x ≥ 2 and x < 1
For problems 8–10, find the solution set of each compound inequality. Write the solution set by using set-builder notation. Then graph the solution set on the number line.
8. x − 2 < 6 or x 3 > 4
9. 5y + 2 ≥ 27 and 3y − 1 < 29
10. 2w > 8 or −2w < 4
11. Consider the compound inequality 4p + 8 > 2p − 10 or 1 3 p − 3 < 2.
a. Find the solution set. Then graph the solution set on the number line.
b. If the inequalities are joined by and instead of or, what is the solution set? Graph the solution set on the number line.
4p + 8 > 2p − 10 and 1 3 p − 3 < 2
12. Consider the compound inequality 7 − 3x < 16 and x + 12 < −8.
a. Find the solution set. Then graph the solution set on the number line.
b. If the inequalities are joined by or instead of and, what is the solution set? Graph the solution set on the number line.
7 − 3x < 16 or x + 12 < −8
13. Consider the compound inequality −1 < g − 6 < 1.
a. Rewrite the compound inequality as a compound statement with the word and or or.
b. Solve each inequality from part (a) for g.
c. Write the solution set by using set-builder notation.
d. Graph the solution set on the number line.
14. Consider the compound inequality − 1 < h 2 ≤ 3.
a. Rewrite the compound inequality as a compound statement with the word and or or.
b. Solve each inequality from part (a).
c. Write the solution set by using set-builder notation.
d. Graph the solution set on the number line.
For problems 15–17, solve the compound inequality. Then graph the solution set on the number line. 15.
For problems 18 and 19, solve the equation.
18. 3(x + 5) = −18 19. 7 = − 4(2 x − 1)
20. The formula for the volume V of a right cone is V = 1 3 πr 2h, where r represents the radius of the base of the cone and h represents the height of the cone. Rearrange the formula to isolate h
21. These data represent the heights of the vertical jumps in inches of 18 players on a youth basketball team.
Make
Vertical Jump Heights
101112131415161718
Vertical Jump (inches)
1920
Student Edition: Math 1, Module 1, Topic C, Lesson 14
Name Date
For problems 1–5, write the equation as a compound statement, if applicable. Use the compound statement to find the solution set of the equation. Check your solutions in the original equation. Then graph the solution set on the given number line.
1. |x| = 5
2.
An equation that can be written in the form |bx c| = d, where b, c, and d are real numbers, is an example of an absolute value equation. Solutions to the equation |bx c| = d are values of x that make the value of bx c a distance of d units from 0. The equation has the same solution set as the compound statement bx c = d or −(bx − c) = d
For problems 6–10, solve the equation. Write the solution set by using set notation.
6. |b − 5| + 2 = 10
Name Date
Consider the equation |2x + 5| = 3
a. Rewrite the equation as a compound statement.
b. Use the compound statement you wrote in part (a) to find the solution set of the original equation.
c. Use the original equation to check the solutions you found in part (b).
d. How many solutions does the equation |2x + 5| = −3 have? Explain.
Name Date
In this lesson, we
• wrote absolute value equations as compound statements.
• solved absolute value equations.
• graphed solution sets of absolute value equations on the number line.
An equation that can be written in the form |bx − c| = d, where b, c, and d are real numbers, is an example of an absolute value equation. Solutions to the equation |bx − c| = d are values of x that make the value of bx c a distance of d units from 0 on the number line. The equation has the same solution set as the compound statement bx − c = d or −(bx − c) = d
For problems 1 and 2, write the equation as a compound statement, if applicable. Then write the solution set in set notation.
The compound statement means that x is 7 or the opposite of x is 7. If the opposite of x is 7, then x is −7
3. Consider the absolute value equation |z − 6| = 2.
Absolute value represents distance from 0 on the number line, and distance is never negative. This equation is not true for any value of m
a. Rewrite the absolute value equation as a compound statement. z − 6 = 2 or −(z − 6) = 2
b. Solve each linear equation.
z − 6 = 2
= 8
c. Write the solution set in set notation.
d. Graph the solution set on the number line.
the absolute value
Name Date
For problems 1–4, write the equation as a compound statement, if applicable. Then graph the solution set of the equation on the number line.
5. Consider the absolute value equation |x + 7| = 3.
a. Rewrite the absolute value equation as a compound statement.
b. Solve the compound statement. Write the solution set by using set notation.
c. Graph the solution set on the given number line.
6. Consider the absolute value equation | d − 4 2 | = 1
a. Rewrite the absolute value equation as a compound statement.
b. Solve the compound statement. Write the solution set by using set notation.
c. Graph the solution set on the given number line.
For problems 7–11, solve the absolute value equation. Write the solution set by using set notation.
12. Why do we rewrite an absolute value equation as a compound statement?
13. Why is there no solution to an absolute value equation when the absolute value expression is equal to a negative number?
For problems 14 and 15, solve the equation.
16. Find the solution set of the inequality. Write the solution set by using set-builder notation, and graph the solution set on the number line.
17. Emma surveyed her friends and recorded the number of states each friend has visited. The numbers of states each friend visited are 3, 8, 7, 6, 5, 4, 4, 5, 6, 4, and 5
a. Find the mean number of states visited by Emma’s friends. Round to the nearest tenth.
b. Find the median number of states visited by Emma’s friends.
Student Edition: Math 1, Module 1, Topic C, Lesson 15 LESSON
Write the letter of the equation or inequality next to the graph of its solution set.
Explain how you matched each equation or inequality to the graph of its solution set.
For problems 1–4, write the inequality as a compound statement. Find the solution set and write it by using set-builder notation. Then graph the solution set on the given number line.
A statement that compares the expressions |bx − c| and d, where b, c, and d are real numbers, using one of the four inequality symbols is an example of an absolute value inequality
Complete each statement with either more or less based on the absolute value inequality.
The inequality |bx − c| > d means that the value of the expression bx − c is than d units from 0.
The inequality |bx − c| < d means that the value of the expression bx − c is than d units from 0.
For problems 5 and 6, write the inequality as a compound statement. Find the solution set and write it by using set-builder notation. Then graph the solution set on the given number line.
5. |6y − 2| ≥ 5
For problems 7–10, find the solution set. Write a brief justification for your answer. 7.
For problems 11 and 12, solve the inequality. Write the solution set by using set notation.
Name Date
Consider the inequality |2x + 5| ≤ 3
a. Rewrite the inequality as a compound statement.
b. Find the solution set.
c. Graph the solution set on a number line.
In this lesson, we
• wrote absolute value inequalities as compound inequalities.
• solved absolute value inequalities.
• graphed solution sets of absolute value inequalities on the number line.
1. Consider the absolute value inequality |4r + 3| < 7
a. Rewrite the inequality as a compound statement.
r + 3 < 7 and −(4r + 3) < 7
b. Solve each inequality.
r + 3 < 7
1
c. Write the solution set by using set-builder notation.
r | 5 2 < r < 1}
d. Graph the solution set on the number line.
A statement that compares the expressions |bx − c| and d, where b, c, and d are real numbers, using one of the four inequality symbols is an example of an absolute value inequality
If 4r + 3 and its opposite are each less than 7 units from 0 on the number line, then the value of 4r + 3 must be between −7 and 7. Use and.
2. Consider the absolute value inequality 2|6a − 10| ≥ 4.
a. Isolate the absolute value expression.
2|6a − 10| ≥ 4 |6a − 10| ≥ 2
b. Rewrite the absolute value inequality as a compound statement.
6a − 10 ≥ 2 or −(6a − 10) ≥ 2
c. Solve each inequality.
6a − 10 ≥ 2
6a ≥ 12 a ≥ 2
If 6a − 10 and its opposite are at least 2 units from 0, then the value of 6a − 10 must be less than or equal to −2 or greater than or equal to 2. Use or
or − (6a − 10) ≥ 2
6a − 10 ≤ − 2
6a ≤ 8 a 4 ≤ 3
d. Write the solution set by using set-builder notation.
a | a 4 ≤ 3 or a ≥ 2
e. Graph the solution set on the number line. a –4–3–2–101234
1. Consider the inequality |x + 1| < 2
a. Rewrite the inequality as a compound statement.
b. Solve the compound statement. Write the solution set by using set-builder notation.
c. Graph the solution set on the number line provided.
2. Consider the inequality |2b − 1| ≥ 6.
a. Rewrite the inequality as a compound statement.
b. Solve the compound statement. Write the solution set by using set-builder notation.
c. Graph the solution set on the number line provided.
For problems 3–9, find the solution set of the inequality. Write the solution set by using set-builder notation. Then graph the solution set on the given number line.
10. Compare and contrast the solution set of
with the solution set of
For problems 11–14, create an equation or inequality for the situation.
11. An absolute value equation that has two solutions
12. An absolute value equation that has one solution
13. An absolute value inequality that has a solution of all real numbers
14. An absolute value inequality that has no solution
For problems 15 and 16, solve the equation.
15. 0 = − 4(−6t + 3) 16.
17. Match each compound statement to the graph of its solution set on the number line.
18. A lifeguard counted and recorded the number of children using the splash pool at each half hour. The data are listed in ascending order.
Make a box plot of the data set.
Student Edition: Math 1, Module 1, Topic C, Lesson 16 LESSON 16
Name Date
1. Record important information from the video. Then draw and label a sketch of the road.
2. Mrs. Allen takes a road trip. She sets her trip odometer to 0 as she starts her trip.
• Mrs. Allen plans to stop at Mystery Dino Land, which is 84 miles from her starting location.
• She then plans to continue driving in the same direction and stop for lunch at Crystal Trees Park, which is 142 miles from her starting location.
• After lunch, Mrs. Allen plans to continue driving in the same direction.
a. How far has Mrs. Allen driven from her starting location when she is 20 miles from Mystery Dino Land?
b. Write two or more expressions that each represent the distance between Mrs. Allen on her drive and Mystery Dino Land. Let x represent the number of miles Mrs. Allen has driven from her starting location.
c. Write and solve an absolute value equation that models the situation from part (a). Let x represent the number of miles Mrs. Allen has driven.
a. Write and solve an absolute value equation to find the number of miles Mrs. Allen has driven.
b. How far is Mrs. Allen from Mystery Dino Land?
4. Suppose Mrs. Allen drives at a constant rate of 50 mph. After how many hours is Mrs. Allen 80 miles from Crystal Trees Park?
5. A machine weighs bags of flour. The weight of a filled bag of flour should be no more than 0.04 pounds from the target weight of 5 pounds. Write and solve an absolute value inequality to find the range of acceptable weights of a bag of flour.
6. An engineer designs a sensor for an airplane. The sensor’s height can be no more than 0.001 inches from the desired height of 6 inches. Write and solve an absolute value inequality to determine the range of acceptable heights for a sensor.
Name Date
A team uses volleyballs that have certain weights for games. Each volleyball must not be more than 10 grams from the desired weight of 270 grams. Let w represent the weight of each volleyball in grams. Write and solve an absolute value inequality to find the range of acceptable weights of a volleyball.
Name
In this lesson, we • wrote and solved absolute value equations and absolute value inequalities that represent real-world situations.
1. The thickness of a steel pipe can be up to 0.01 inches greater than or less than the desired thickness of 3.5 inches when it is manufactured. Let x represent the thickness of a steel pipe in inches. Match each situation to the equation or inequality that represents it.
All thicknesses that indicate the steel pipe is not manufactured within the acceptable limits
All thicknesses that indicate the steel pipe is manufactured within the acceptable limits
All thicknesses that indicate the steel pipe is manufactured at the acceptable limits
The situation is modeled by an absolute value equation because the unknown values are the same distance from 3.5 on the number line.
2. Professional baseball players typically use a bat that weighs up to 2 ounces greater than or less than 34 ounces.
a. Write an absolute value inequality that represents the typical range of weights of a bat that professional baseball players use.
Let w represent the weight of a bat in ounces.
|w − 34| ≤ 2
This situation is modeled with an inequality because there is a range of values that make sense in context.
b. Solve the absolute value inequality you wrote in part (a) to find the typical range of weights of a bat that professional baseball players use.
|w − 34| ≤ 2
w − 34 ≤ 2
w ≤ 36 and −(w − 34) ≤ 2
w − 34 ≥ −2
w ≥ 32
The typical range of weights of a bat that professional baseball players use is 32 ounces to 36 ounces.
Name
1. For each situation, the temperature of the water inside a water heater x in degrees Fahrenheit can be up to 5°F greater than or less than the 120°F setting. Match each situation to the equation or inequality that represents it. Situation
All temperatures of the water x that indicate that the water heater is functioning properly
All temperatures of the water x that indicate that the water heater needs repairs
All temperatures of the water x that indicate that the water heater is functioning at its limits
2. A decorator wants to hang a shelf in the center of a wall. She wants to mark the wall for placement of the anchors that will support the weight of the shelf. The decorator has the following information:
• The center of the wall is 25 5 8 inches from the left edge.
• The anchors should be placed exactly 3 inches from the center of the wall.
a. Write an absolute value equation to find where the anchors should be placed on the wall.
b. Solve the absolute value equation you wrote in part (a) to find where the anchors should be placed on the wall.
3. A candy manufacturer typically fills each bag with 362 pieces of candy. The number of pieces of candy in a bag can be up to 12 pieces greater than or less than 362
a. Write an absolute value inequality that represents the acceptable range of the number of pieces of candy in a bag.
b. Solve the absolute value inequality you wrote in part (a) to find the acceptable range of the number of pieces of candy in a bag.
4. A typical body temperature of an adult is 98.6°F, but adult body temperatures can vary by up to 1°F and still be considered normal.
a. Write an absolute value inequality that represents the range of normal body temperatures of an adult in degrees Fahrenheit.
b. Solve the absolute value inequality you wrote in part (a) to find the range of normal body temperatures of an adult in degrees Fahrenheit.
c. Write an absolute value inequality that represents the range of abnormal body temperatures of an adult in degrees Fahrenheit.
d. Solve the absolute value inequality you wrote in part (c) to find the abnormal body temperatures of an adult in degrees Fahrenheit.
Remember
For problems 5 and 6, solve the equation. 5. −2(d − 6) + 5d = 12
7. The acceptable temperature of a freshwater aquarium is at least 72°F and no more than 82°F. Write a compound inequality for the acceptable range of temperatures for a freshwater aquarium.
8. During one day, managers of two grocery stores tracked how long each of their customers spent shopping. One random sample was taken from all shoppers at store A, and another random sample was taken from all shoppers at store B. The box plots show the distributions of the lengths of time in minutes shoppers spent at each store. Which statements must be true based on the data distributions shown in the box plots? Choose all that apply.
Store B
6121824303642485460667278
A. The ranges of the two data sets are the same.
B. The median for store A is less than the median for store B.
C. The interquartile range for store B is greater than the interquartile range for store A.
D. The difference in the medians of the two data sets is _ 1 2 of the interquartile range for store A.
E. The difference in the medians of the two data sets is 2 times the interquartile range for store B.
Count out one second. It’s about the length of a typical sneeze. Now, in that second, here is a rough summary of what happened on the internet:
5000
1000
posts made on Instagram hours of video uploaded to YouTube
tg k
5 twets sent on Twiter things “liked” on Facebok

70,000
Lok at that data!So big!
To be clear, there was nothing special about the second you counted. All of these events, give or take, are happening every single second, all day long. For each post, companies log the time, the device, the account posting it, the hashtags, the reactions to it—and much more.
This is too much data for one person to examine. It needs to be summarized, with the important features picked out.
That’s where statistics come in. A statistic is a brief summary, a quick fact about a data set.
What do statistics reveal? What do they not reveal? Who should have access to this data, and for what purposes? These questions are not only mathematical, but moral and social too. And, to answer them wisely, we’ll need to know how the statistics work.
Student Edition: Math 1, Module 1, Topic D, Lesson 17
Name Date
Distributions and Their Shapes
Comparing Dot Plots
Typical Values
Putting It All Together
LESSON 17
Graphical Displays
Measures of CenterMeasures of Spread
Univariate Quantitative Data
Shapes of Data Distributions
The dot plot shows the delay times rounded to the nearest five minutes for 60 Big Air flights in 2019.
mes of Big Air Flights from 2019
a. What shape is the distribution?
b. Was 70 minutes a typical delay time for these Big Air flights? Justify your answer.
Name Date
In this lesson, we
• described shapes of data distributions displayed in dot plots by using the terms symmetric, right-skewed, left-skewed, and mound-shaped.
• compared data distributions displayed in dot plots.
• estimated typical values for data distributions.
The numbers of grams of protein per serving in 20 different varieties of breakfast cereals are listed.
Univariate quantitative data means there is one variable, and the data values are numerical.
A mound-shaped distribution is a symmetric distribution that looks like a smooth, round hill. A mound-shaped distribution has exactly one peak.
A data distribution is approximately uniform when most of the values have about the same frequency.
a. Create a dot plot showing the distribution of the number of grams of protein per serving in the 20 breakfast cereals.
Each dot represents one value in the data set.
Protein per Serving of Cereal
0123456789
Protein (grams)
A skewed distribution has a tail on one side. This distribution has a tail on the right side.
b. Describe the shape of the distribution. The distribution is right-skewed.
c. Use the dot plot to estimate the typical number of grams of protein per serving of one of these cereals.
The typical number of grams of protein per serving is about 3 grams.
The data value 3 grams falls in the middle of the data set, so it is a good estimate of a typical data value.
1. Match each dot plot to the description of its shape.
2. Ana recorded the daily high temperature in degrees Fahrenheit at her house for 10 days.
77, 85, 77, 79, 82, 84, 79, 78, 79, 80
a. Create a dot plot showing the distribution of high temperatures in degrees Fahrenheit for the 10-day period.
75767880828486777981838587
b. What is the shape of the distribution?
3. There are 25 people attending an event. The ages of the people attending are listed.
a. Create a dot plot showing the distribution of the ages in years of the people in attendance.
b. What is the shape of the distribution?
c. What is the typical age of a person attending the event?
d. What might the event be?
4. A random sample of 80 viewers of a television show was selected. The dot plot shows the distribution of the ages of the viewers in years.
a. What shape is the distribution?
b. Based on the dot plot, what is the typical age of a viewer?
c. Would you say that this television show appeals to a wide age range of viewers? Explain.
5. When is it not efficient to represent a data set by using a dot plot?
6. A doctor measured the resting heart rates in beats per minute of a large group of middle-aged adults. From the group, the doctor randomly selected 20 adults who are right-handed and 20 adults who are left-handed. The distributions are shown in the dot plots.
a. In 2 or 3 sentences, compare the distribution for the resting heart rates of right-handed adults with the distribution for the resting heart rates of left-handed adults.
b. Based on the data, can the fact that an adult is left-handed or right-handed influence that adult’s resting heart rate? Explain your reasoning.
For problems 7 and 8, solve the equation.
7. 16 = 7 − 2x − 5x
9. Which of the following expressions are equivalent to 4x − 2(3x + 1)? Choose all that apply.
A. 4x − 6x + 2
B. 4x − 6x − 2
C. − 2x + 2
D. − 2x − 2
E. − 2(x + 1)
F. − 2(x − 1)
10. Danna earns $114 for 8 hours of work. She earns the same amount of money each hour. Write an equation that represents the relationship between Danna’s earnings y in dollars and the number of hours she works x
Student Edition: Math 1, Module 1, Topic D, Lesson 18
Name Date
Describing the Center of a Distribution
Test Your Memory Revisited
LESSON 18
Draw a sample dot plot for each case, and summarize the information about the mean and median.
1. The table shows estimates of the population size in thousands of 16 penguin species.
a. Complete the dot plot.
b. What is the median population size?
c. Without computing the mean, determine whether the mean or median population size is greater. Explain your answer.
d. To estimate a typical penguin population size of these species, is it appropriate to use the mean, the median, or both? Why?
e. The population size of the macaroni penguin species is approximately 18,000,000. If we included the population size for the macaroni penguins in the data set, how would that affect the mean and the median? Which measure would be more affected and why?
2. The histogram summarizes the average number of clear days in one year for 48 of the largest cities in the United States. A clear day is defined as one in which clouds cover at most 30% of the sky during daylight hours.
a. Estimate the median and the mean of the distribution from the histogram.
b. What is a typical number of clear days in a year for one of these cities? Explain your answer.
c. Use the histogram for the average number of clear days to construct a relative frequency histogram.
d. Estimate the median and the mean of the distribution from the histogram.
A random sample of 10 ninth grade students was asked for the number of text messages they sent last Tuesday.
Consider the dot plot showing the number of text messages these students sent.
Text Messages Sent by Ninth Graders Last Tuesday
050100150200250300
Number of Text Messages Sent
a. Calculate the mean and median of the data set.
b. To describe a typical number of text messages these students sent last Tuesday, would you use the mean, median, or both? Explain your answer.
Name Date
In this lesson, we
• determined the mean and median of a distribution from a dot plot.
• estimated the mean and median of a distribution from a histogram.
• determined which measures of center are most appropriate to describe a distribution.
1. The dot plot shows the number of grams of protein per serving in 20 different varieties of breakfast cereal.
0123456789
Protein (grams)
a. Find the mean and median of the data set.
5(1) + 4(2) + 3(3) + 2(4) + 2(5) + 2(6) + 7 + 8 20 = 67 20 = 3.35
The mean of the data set is 3.35 grams. The median of the data set is 3 grams.
b. Determine whether the mean, median, or both would be appropriate to use to describe the typical number of grams of protein per serving of one of these cereals. Explain.
The median would be appropriate to use to describe the typical number of grams of protein per serving of one of these cereals because the distribution is right-skewed.
Because there are an even number of data values, the median is the mean of the two middle values.
3 + 3 2 = 3
In a right-skewed distribution, the mean is usually greater than the median.
2. The histogram shows the distribution of audience ratings for a sample of 100 movies.
The left half of the distribution almost mirrors the right half of the distribution.
a. Describe the shape of the distribution. The distribution is approximately symmetric.
b. Use the histogram to estimate the mean and median of the distribution. The mean movie rating is about 65. The median movie rating is between 60 and 70.
The balance point is near the center because the distribution is approximately symmetric.
A histogram does not provide exact data values. The best estimate of the median is within an interval.
c. Determine whether the mean, median, or both would be appropriate to use to describe a typical audience rating for a movie in this sample. Explain.
Both the mean and the median are appropriate to use to describe a typical audience rating in this sample because the distribution is approximately symmetric.
In an approximately symmetric distribution, the mean and the median are about the same value.
Name Date
1. Draw a dot plot of a data distribution representing the ages of 20 people for which the median and the mean are approximately the same value. Explain your reasoning.
2. Draw a dot plot of a data distribution representing the ages of 20 people for which the median is less than the mean. Explain your reasoning.
For problems 3 and 4, determine whether it is appropriate to use the mean, median, or both to describe a typical value. Explain.
3. A random sample of 70 employees of several different companies was asked how much money they spent on lunch last week.
4. Another random sample of 70 employees, this time from the same workplace, was asked how much money they spent on lunch last week.
5. The dot plot shows the movie lengths in minutes of the 8 Best Picture nominees for the 2019 Oscars.
The median movie length for the movies is 133.5 minutes. Determine by inspection whether the mean movie length is greater than, less than, or the same as the median movie length. Explain your reasoning.
6. An event has 40 people attending it. The ages of the people are as follows:
a. Create a histogram of the ages by using the provided axes. Use intervals of 10 years.
b. Would you describe the histogram as symmetric or skewed? Explain your choice.
c. Using the histogram, estimate the mean and median.
d. Would the mean, median, or both appropriately describe the typical age of a person attending this event? Explain.
7. The relative frequency histogram shows the distribution of heights for a sample of 25 players in the Women’s National Basketball Association (WNBA).
a. Estimate the mean and median of the distribution from the histogram.
b. To describe the typical height of these basketball players, is it appropriate to use the mean, median, or both? Explain.
For problems 8 and 9, solve the inequality for p.
8. 5p + 8 > 28 9. 3(p − 5) ≤ −18
10. The drama club sells bouquets of flowers at the spring musical performances. Each small bouquet sells for $12, and each large bouquet sells for $20. The drama club sells 14 more small bouquets than large bouquets. If the drama club makes $552 in total sales, how many small bouquets do they sell?
11. The soccer coach purchased headbands for the team. The graph shows the relationship between the number of headbands purchased and the total cost. What is the cost per headband? 032145678910
Student Edition: Math 1, Module 1, Topic D, Lesson 19 LESSON
Name Date
1. A restaurant owner invited 100 people to try a new sandwich and to provide feedback by completing a survey. The survey included the question, What price would you be willing to pay for the sandwich, rounded to the nearest dollar? The results are shown in the relative frequency histogram.
Write two or three sentences that describe a typical value for the data set and interpret that value context.
2. Find each value and create a box plot that shows the distribution from problem 1.
Minimum:
3. The box plots summarize the life expectancy at birth in countries in Asia and Europe in 2017.
a. What is the lowest life expectancy in any country in Europe?
b. What is the highest life expectancy in any country in Asia?
c. Is it true that there are more countries in Europe where people have a life expectancy between 76 and 80.5 years than between 80.5 and 82 years? Explain.
d. Mason says that the number of countries in Asia where people have a life expectancy between 75 and 78 years is the same as the number of countries in Europe where people have a life expectancy between 80.5 and 82 years. Do you agree with Mason? Explain.
e. How does a typical life expectancy for people in a country in Asia compare with a typical life expectancy for people in a country in Europe?
f. Write a few sentences comparing the life expectancy for people in an Asian country and the life expectancy for people in a European country.
4. The box plots summarize the average points per game for two sets of NBA players.
• The first box plot shows the distribution of the average points per game of 21 of the leading scorers in NBA history.
• The second box plot shows the distribution of the average points per game of the 21 leading scorers among NBA players who were active through June 2019.
NBA Leading Scorers
Active Players
1618202224 26 28 3032
Average Points per Game
a. Complete each sentence.
% of the leading scorers in NBA history had a higher average than the bottom 75% of the leading scorers who were active through June 2019.
Approximately % of the leading scorers in NBA history had a higher average than 100% of the leading scorers who were active through June 2019.
b. Describe the shape of each data distribution.
c. Compare a typical value for the average points per game for 21 of the leading scorers in NBA history with a typical value for the average points per game for the leading scorers who were active through June 2019.
Name Date
A forest is divided into equal sections, and 100 of these sections are randomly selected. A scientist asks volunteers to record the number of squirrels and birds seen in each section. The box plots show the distributions of the number of squirrels and birds observed in each section.
Animal Sightings in 100 Sections of the Forest
Squirrels
Birds
0567894321101112
Number of Squirrels and Birds Seen
Is the typical number of squirrels seen in each section of the forest greater than the typical number of birds seen in each section of the forest? Justify your answer.
Name Date
In this lesson we
• interpreted information about a distribution from a box plot.
• compared distributions displayed in box plots.
Twelve swimmers each swam 1500 meters two times: once wearing a wetsuit and once not wearing a wetsuit. The box plots show the distributions of the swimmers’ maximum speeds in meters per second.
a. Determine whether each statement is true or false.
Most of the swimmers’ maximum speeds when not wearing a wetsuit are less than 1.4 meters per second.
False
Only about 25% of the speeds fall into this category.
About 50% of the swimmers’ maximum speeds when wearing a wetsuit are between 1.2 meters per second and 1.5 meters per second.
True
The range of the swimmers’ maximum speeds when not wearing a wetsuit is less than the range of the swimmers’ maximum speeds when wearing a wetsuit.
True
The typical maximum speed for a swimmer when wearing a wetsuit is less than the typical maximum speed for a swimmer when not wearing a wetsuit.
False
The median speed for swimmers when wearing a wetsuit is about 1.5 meters per second. The median speed for swimmers when not wearing a wetsuit is about 1.45 meters per second.
b. Did a greater percentage of swimmers reach a maximum speed of at least 1.45 meters per second when wearing a wetsuit or when not wearing a wetsuit? Explain.
A greater percentage, about 75%, of swimmers reached maximum speeds of at least 1.45 meters per second when wearing a wetsuit. This is a greater percentage than the approximately 50% of swimmers who reached this maximum speed when not wearing a wetsuit.
1. Ana recorded the daily high temperature in degrees Fahrenheit at her house for 10 days.
Find each value and create a box plot that shows the distribution of the daily high temperatures.
2. The box plot displays the distribution of heights for a sample of 25 players in the Women’s National Basketball Association (WNBA). Determine whether each statement is true or false and justify your choice.
616263646566687072747678806769717375777981
Height (inches)
a. The minimum height of these basketball players is 66 inches.
b. Most of these basketball players have a height of 73 inches or less.
c. More of these basketball players are between 69 inches and 73 inches tall than between 73 inches and 76 inches tall.
d. Approximately 25% of these basketball players are between 76 inches and 78 inches tall.
3. A timed quiz was given to 20 students. The same 20 students were given the same quiz the next day, but it was untimed. The distributions of the scores for the quizzes are shown in the box plots.
Timed Untimed
0123456789 10111213
a. Which distribution had a greater percentage of scores that are at least 7 points? Explain.
b. Describe a typical score on the timed quiz and a typical score on the untimed quiz.
c. Based on the box plots, the teacher concludes that these students did significantly better on the untimed quiz than on the timed quiz. Give three pieces of evidence that support this conclusion.
d. Can the teacher conclude that students had better scores on the second quiz because it was untimed? Explain.
4. Why are box plots useful to compare two univariate data sets?
5. The box plot displays the distribution of ages for 200 randomly selected residents from Kenya. The relative frequency histogram displays the distribution of ages for 200 randomly selected residents from the United States.
a. Which country’s distribution has a greater percentage of people who are at least 20 years old? Explain.
b. Estimate the percentage of the people in each distribution who are at least 50 years old.
Remember
For problems 6 and 7, solve the inequality for c.
6. −34c + 18c ≤ 8
7. −4(2c − 8) < −24
8. Consider the equation |3x − 5| = 4.
a. Rewrite the equation as a compound statement.
b. Use the compound statement you wrote in part (a) to find the solution set of the original equation.
9. Suppose Nina and Zara each walk at a constant rate. The equation d = 16 5 t represents Nina’s distance d in miles for t hours of walking. The graph represents Zara’s distance y in miles for x hours of walking.
Who walks at a faster rate? Explain.
Student Edition: Math 1, Module 1, Topic D, Lesson 20
Name
1. A principal wants to know how much sleep students get each night. She randomly selects 8 students from ninth grade and 8 students from sixth grade and asks them to report the number of hours they slept the night before to the nearest hour. The dot plots display the results.
Based on the distributions, compare the typical number of hours of sleep for the ninth grade students with the typical number of hours of sleep for the sixth grade students.
Sum of deviations: Sum of squared deviations:
Mean:
Estimate the typical deviation from the mean of the data set for ninth grade students.
Variance: a measure of spread for a data distribution. To calculate variance, first sum the squares of all the differences between the data values and the mean of the data set. Then divide the sum by one less than the size of the data set.
Mean absolute deviation: a measure of spread for a data distribution. It is the average distance between a data value and the mean of a data distribution.
Standard deviation: the square root of the variance. It can be used to measure the typical distance from the mean.
Variance:
Standard deviation:
What does the standard deviation represent in this context?
Sum of deviations: Sum of squared deviations:
Mean:
Variance: Standard deviation: Interpret the standard deviation in this context.
4. The following dot plots show larger random samples of ninth grade students and sixth grade students. Use technology to find the standard deviation of the distribution of each data set. Round each standard deviation to the nearest tenth. Number
a. Calculate the standard deviation of the distribution of the data for ninth grade students.
b. Calculate the standard deviation of the distribution of the data for sixth grade students.
c. Compare the standard deviations of the distributions.
For problems 5–7, determine whether each statement is always, sometimes, or never true. Explain your reasoning.
5. Decreasing a data value will decrease the standard deviation of a distribution.
6. Increasing a data value will increase the standard deviation of a distribution.
7. Inserting an outlier into a distribution will increase the standard deviation.
Name Date
1. The dot plot for data set A shows scores on a math quiz that had 4 questions worth 2 points each. The dot plot for data set B shows scores on a math quiz that had 8 questions worth 1 point each.
Which statement correctly compares the mean and the standard deviation of data set A and data set B?
A. Data set A and data set B have the same mean and standard deviation.
B. Data set A has a greater mean and a larger standard deviation than data set B.
C. Data set A has a greater mean than data set B, but data set A and data set B have the same standard deviation.
D. Data set A and data set B have the same mean, but data set A has a greater standard deviation than data set B.
2. The following data set lists the fuel economy of 5 cars in miles per gallon.
23.4, 24.7, 24.7, 24.9, 27.9
The mean of the data set is approximately 25.1 miles per gallon, and the standard deviation is approximately 1.7 miles per gallon.
A different data set lists the fuel economy of 6 other cars in miles per gallon.
22.9, 23.7, 23.7, 25.9, 26.5, 50.0
Without calculating the standard deviations, explain why the standard deviation of the second data set is greater than the standard deviation of the first data set.
Name Date
In this lesson, we
• calculated the variance and standard deviation of a distribution, by hand and with technology.
• used standard deviation to compare two distributions.
• explored the effects of changing data values on the standard deviation of a distribution.
The list shows the ages in years of 5 children on the swings at a playground.
6, 8, 8, 11, 12
a. What is the range of the distribution?
12 − 6 = 6
The range of the distribution is 6 years.
The variance is a measure of spread for a data distribution. To calculate variance, first sum the squares of all of the differences between the data values and the mean of the data set. Then divide the sum by one less than the size of the data set.
The standard deviation is a measure of variability appropriate for data distributions that are approximately symmetric. Standard deviation is often used to describe the typical distance from the mean. It is calculated by taking the square root of the variance of a data set.
b. What is the mean of the distribution?
6 + 8 + 8 + 11 + 12 5 = 9
The mean of the distribution is 9 years.
c. Record deviations from the mean and the squared deviations from the mean in the table. Subtract the mean from each data value.
The deviation from the mean is negative when the data value is less than the mean. The squared deviation is always positive.
d. What is the variance of the distribution?
To calculate variance, divide by 1 less than the sample size. The sample size is 5, so divide by 4 The variance of the distribution is 6.
e. What is the standard deviation of the distribution? Round to the nearest tenth.
√6 ≈ 2.449
The standard deviation of the distribution is approximately 2.4 years.
The standard deviation is the square root of the variance.
f. Interpret the standard deviation in this context.
The difference between the typical age and the mean age of a child at the playground is about 2.4 years.
Name
Date
1. At a high school, ninth grade students are required to run a timed mile as part of a yearly physical fitness test. Each data set shows the times it took 5 randomly selected ninth grade students to run one mile, rounded to the nearest minute.
Data Set A: 9, 9, 9, 9, 9
Data Set B: 7, 8, 9, 10, 11
a. Write a sentence that compares the centers and spreads of the data sets.
b. Interpret what the centers and spreads represent in this situation.
2. A manager of a trampoline park recorded attendance at the park each day over several months. The mean of the data set is 85 people, and the standard deviation is 6 people.
a. Explain what the mean of this data set tells you about the number of people who attended the trampoline park during this time.
b. Explain what the standard deviation of this data set tells you about the number of people who attended the trampoline park during this time.
3. The following list shows the quiz scores for 5 students selected at random.
6, 7, 9, 9, 9
a. What is the range of the data distribution?
b. What is the mean of the data distribution?
c. Record the deviations from the mean and the squared deviations from the mean in the table.
d. What is the variance for the data distribution?
e. What is the standard deviation for the data distribution? Round to the nearest tenth.
f. Interpret the standard deviation in this context.
4. At a track meet, there are three men’s 100-meter races. The times in which the runners completed each race are recorded to the nearest 0.1 second and are shown in the dot plots.
Race 1 Race 2
Race 3
a. Without calculating, rank the races in order from least standard deviation to greatest standard deviation.
b. Explain how you were able to rank the standard deviations of the distributions without calculating.
c. Which estimate is closest to the standard deviation for the data from race 1?
A. 0.1 second
B. 0.75 seconds
C. 1.15 seconds
D. 1.30 seconds
d. Use your calculator to find the mean and standard deviation for race 1. Round each value to the nearest hundredth. How close was your estimate of standard deviation to the actual value?
Race 1 mean:
Race 1 standard deviation:
5. A grocery store manager wondered whether there was a consistent number of apples in the bags of apples sold at the store. The manager randomly selected 20 bags of apples and recorded the number of apples in each bag. The mean number of apples in each bag was 8, and the standard deviation was approximately 2 apples.
456789101113 12
a. How could the manager redistribute the apples into bags so that the mean of the distribution is unchanged but the standard deviation is 0?
b. How could the manager redistribute the apples into bags so that the mean and range of the distribution are unchanged but the standard deviation is made as great as possible?
c. Suppose another bag of apples is added to the original sample. Describe what would happen to the standard deviation if the bag contains the following numbers of apples:
i. 9 apples
ii. 11 apples
iii. 3 apples
For problems 6 and 7, solve the inequality.
6. 54 5 m ≤ -31
7. -0.5(-4m - 6) > 4
8. Which equations or inequalities have no solution? Choose all that apply.
A. |x + 2| = -5
B. -|x + 2| = 5
C. -|x + 2| = -5
D. |x + 2| < -5
E. |x + 2| ≥ -5
9. Find the slope of the line.
Student Edition: Math 1, Module 1, Topic D , Lesson 21
Name Date
1. As part of a project, Mrs. Allen’s Mathematics I class collected data to determine whether the amount of homework increased as grade level increased. One group surveyed a random sample of 50 ninth grade students and 50 eleventh grade students and asked them how many hours each week they spent on homework. The dot plots show the results of the survey.
2. A product review team is conducting a study of various brands of batteries. The team measures the battery life of a random sample of 100 batteries from brand D and the battery life of a random sample of 100 batteries from brand E.
a. Estimate the mean of the battery life distribution for brand D.
b. Circle the best estimate of the standard deviation of the battery life distribution for brand D.
3 hours
10 hours
30 hours
c. Estimate the mean of the battery life distribution for brand E.
d. Is the standard deviation for this distribution greater than, about the same as, or less than the standard deviation for the brand D battery life distribution? Explain your reasoning.
e. Compare the distribution of brand D battery life with the distribution of brand E battery life. Interpret the comparison in context.
3. A company that owns amusement parks was studying wooden and steel roller coasters of their competitors. A researcher selected a random sample of 75 wooden roller coasters and 75 steel roller coasters and recorded their maximum speeds. The distribution of the data is shown in the box plots.
a. How many outliers does each distribution have? Estimate their values.
b. What is the approximate difference in the medians of the distributions?
c. What is the approximate difference in the ranges of the distributions?
d. What is the approximate difference in the interquartile ranges of the distributions?
e. Which measure more accurately compares the variation in the distributions? Justify your reasoning.
f. Compare the distributions of the maximum speeds of the wooden and steel roller coasters. Interpret your findings in context.
1. The histogram shows the distribution of the weights in pounds of 50 dogs at a dog show.
Which value is the best estimate of the standard deviation of the distribution?
A. 15 pounds
B. 30 pounds
C. 37.5 pounds
D. 75 pounds
2. Two different locations have a speed limit of 70 kilometers per hour. Ana uses a speed detector to collect random samples of the speeds in kilometers per hour of cars traveling past the two locations in one day. The box plots display the distributions of those random samples.
Speeds of Cars at Two Locations
Location 1
Location 2
5060708090100
Speed (kilometers per hour)
Suppose Ana claims that the amount of variation in the driving speeds at location 1 is greater than the amount of variation in the driving speeds at location 2.
a. Provide one form of evidence from the data that supports Ana’s claim.
b. Provide one form of evidence from the data that refutes Ana’s claim.
Name Date
In this lesson, we
• estimated the mean and standard deviation of a distribution from a histogram.
• compared spreads of distributions in box plots and dot plots.
1. The histogram shows the ages of a random sample of 100 subscribers of one streaming video service.
The distribution is mound-shaped. About two-thirds of the data values lie within one standard deviation of the mean of the distribution.
Ages of Subscribers of One Streaming Video Service
The mean is located at approximately the center of the distribution.
a. Estimate the mean age of a subscriber to the streaming video service. Mark it on the histogram with a vertical line. About 40 years
b. Circle the best estimate of the standard deviation of the age distribution.
8 years
16 years
24 years
c. On the histogram, mark the locations that are approximately one standard deviation greater than the mean and one standard deviation less than the mean.
2. The box plot summarizes the numbers of videos that the random sample of video streaming service subscribers streamed over the last month.
A data point separated from the rest of the plot in a box plot is an outlier.
Videos Streamed Last Month Number of Videos
a. Identify any outliers in the distribution.
0 videos
b. What is the range of the distribution?
30 videos
c. What is the interquartile range (IQR) of the distribution?
8 videos
Include outliers when calculating measures of center and spread. The minimum value in this distribution is 0 videos, not 13 videos. 30 − 0 = 30
IQR is the difference between Q3 and Q1. 24 − 16 = 8
d. Is the range or IQR a better measure of the spread for this distribution? Explain.
The IQR is a better measure of spread for this distribution. The outlier increases the range of the distribution significantly, but it has little to no effect on the IQR. So the IQR better represents the overall spread of the data.
1. All the members of a high school swim team were asked how many hours they studied last week, estimated to the nearest half hour. The histogram summarizes the results.
a. Which value best estimates the mean study time?
A. 5 hours
B. 10 hours
C. 20 hours
b. Which value best estimates the standard deviation of the study time?
A. 2.5 hours
B. 5 hours
C. 10 hours
D. 20 hours
2. Suppose all the members of a different high school swim team were asked how many hours they studied last week, estimated to the nearest half hour. The box plot shows the data distribution.
a. What is the range of the distribution?
b. Interpret the range in this context.
c. Identify any outliers in the distribution.
d. What is the interquartile range (IQR) of the distribution?
e. Interpret the IQR in this context.
3. Now, suppose all the members of a high school track team were asked how many hours they studied last week. The box plot shows the data distribution.
a. Identify any outliers in the distribution.
b. What is the range of the distribution?
c. What is the IQR of the distribution?
d. Is the range or IQR a better measure of the spread in the distribution? Explain your reasoning.
4. City A hosts a marathon. The ages of the runners in the marathon are summarized in the histogram. Ages
a. Estimate the mean age of runners in the city A marathon. Mark this value on the histogram with a vertical line. Interpret the mean in this context.
b. Circle the best estimate of the standard deviation of the ages of runners in the city A marathon.
5 years
10 years
15 years
c. On the histogram, mark with vertical lines the locations that are approximately one standard deviation greater than the mean and less than the mean.
d. Approximately what fraction of the runners’ ages lies between one standard deviation less than the mean and one standard deviation greater than the mean?
e. City B also hosted a marathon. The ages of the runners in the marathon are summarized in the histogram.
Estimate the mean of the age of the runners in the city B marathon.
f. Circle the best estimate for the standard deviation of the runners’ ages in the city B marathon.
5 years
10 years 15 years
g. For which distribution is the standard deviation of the ages of the runners greater? Why is it greater?
5. Consider the box plots of the distributions of delay times in minutes of 60 randomly selected Big Air flights in November 2019 and December 2019.
Delay Times for Big Air Flights
November
December
0102030405060708090100110120
Delay Time (minutes)
Compare the distributions of delay times in context by using measures of shape, center, and spread.
6. Nina selected 10 students at random from her English class and 10 students at random from her math class. She asked each student how many movies they had watched in the previous month. The students’ responses are included in the lists shown.
a. Calculate the mean and median for the data from each class.
b. Calculate the standard deviation and IQR for the data from each class. Round to the nearest tenth.
c. Identify the outliers in either data set.
d. Which measure of spread is more affected by the outlier? Explain your reasoning.
e. Is the typical number of movies watched last month by students in Nina’s English class different from the typical number of movies watched last month by students in Nina’s math class? Explain your reasoning.
7. Three data sets are shown in the dot plots.
Data Set A
Data Set B
Data Set C
20 21 22 23 24 25 26 27 28 29 30
a. Compare the distributions by using measures of shape, center, and variation.
b. Which measures of center and variation did you choose to compare the data sets? Why?
c. How do these data sets illustrate the importance of measuring variation to describe a data distribution?
For problems 8 and 9, solve the inequality.
8. 25 > 8( t 3 3)
10. The dot plot shows the distribution of the time spent at the gym on Tuesday for a random sample of 40 gym members. Times are rounded to the nearest 5 minutes.
a. What is the shape of the distribution of time spent at the gym for this sample of gym members?
b. Is 30 minutes a typical amount of time spent at the gym for this sample of gym members? Justify your answer.
Student Edition: Grade 7-8, Module 1, Topic A, Lesson 3
11. Write the equation of the line in slope-intercept form.
Student Edition: Math 1, Module 1, Topic D, Lesson 22
Name Date
Data sets you were assigned:
In one sentence, describe the context for the data sets you will compare.
LESSON
Compare the data sets assigned to your group by completing the following tasks:
• Use the given data displays to determine which measures of center and spread are appropriate to use to compare the distributions.
• Compare the shapes, centers, and spreads of the data distributions. Interpret any differences in context.
Name Date
The dot plot displays the distribution of the number of push-ups done in a row by a random sample of 20 people.
02468 101214161820
Number of Push-ups
The box plot displays the distribution of the number of push-ups done in a row by a random sample of 200 people.
02468
101214161820
Number of Push-ups
a. Compare the shapes of the data distributions.
b. Compare the centers of the data distributions in this context.
c. Compare the variation of the data distributions in this context.
In this lesson, we
• compared distributions by using shape, center, and variability.
• interpreted differences in distributions in context.
The data displays show the distributions of flight times for a random sample of flights from Boston to San Francisco and a random sample of flights from San Francisco to Boston.
Compare the distributions of flight times in context by using shape and measures of center and spread.
Shape:
The distribution of flight times from Boston to San Francisco appears approximately symmetric, while the distribution of the flight times from San Francisco to Boston appears right-skewed.
Center:
The median flight time from Boston to San Francisco is about 356 minutes. The median flight time from San Francisco to Boston is between 295 minutes and 300 minutes. The typical flight time for a flight from Boston to San Francisco is about 55 to 60 minutes longer than the typical flight time from San Francisco to Boston.
Spread:
The IQR for the distribution of flight times from Boston to San Francisco is about 28 minutes. The IQR for the distribution of flight times from San Francisco to Boston is between 10 and 20 minutes. The typical variation in flight times from Boston to San Francisco is about 10 to 20 minutes more than the typical variation in flight times from San Francisco to Boston.
1. The following dot plot represents the ages of 60 randomly selected people from Japan in 2018.
Ages of People from Japan
a. What is the shape of the distribution?
b. How does the shape of a distribution help us decide which measures of center and spread to use?
c. What is the typical age of a person in the sample?
d. What measure of center did you use to calculate a typical age in part (c)? Justify your choice.
e. What is an estimate of the range for the distribution?
2. The relative frequency histogram summarizes the ages of a random sample of people in Bangladesh in 2018.
a. Compare the shapes of the distributions of the ages in the sample from Japan in problem 1 and the sample from Bangladesh.
b. Which measures of center and spread would you use to compare the distributions? Justify your reasoning.
c. Compare the distributions by using appropriate measures of center and spread.
3. A principal selected 100 eighth grade students at random to participate in a reading fluency test. Teachers recorded the number of words students read accurately in one minute. Students were tested in the fall and then again in the spring. The results of each test are summarized in the box plots.
Write two or three sentences about the eighth grade reading fluency test results.
4. The following graphs show the distributions of the number of runs scored per game for a random sample of 30 games for the Blue Socks baseball team and a random sample of 31 games for the Black Socks baseball team.
Runs Scored by Blue Socks Baseball Team
Runs Scored by Black Socks Baseball Team
012345678 10 9
Number of Runs Scored
0123456789101112131415
Number of Runs Scored
Compare the distributions in context by using shape and measures of center and spread.
5. The box plots summarize the distributions of weekly sales of chocolate chip cookies from three bakeries.
Compare the distributions in this context by using measures of shape, center, and spread.
remember
For problems 6 and 7, solve the equation.
6. 6a − 4a − 3(4a + 1) = 47
−8a + 2(−3a + 3) − a = 1
8. A random sample of ninth grade students and tenth grade students at one school was asked how many hours they volunteered last month. The box plots show the distributions of time spent volunteering.
Volunteer Hours
Tenth Grade
Ninth Grade
012345678
Time (hours)
Is the typical number of volunteer hours for ninth grade students in the sample greater than, less than, or equal to the typical number of volunteer hours for tenth grade students in the survey? Justify your answer.
9. Graph y = 2 3 x − 5.
Name
1. Evaluate 4( 1 2 x − 1) for x = − 1 2
2. Solve 6 + 7 8 x = 4 + 3 8 x + 8 for x.
3. Write the number that completes the equation so it has infinitely many solutions.
4(2x + ) = 8x + 12
4. Which point represents the solution to the system of linear equations shown in the graph?
A.Point F
B.Point G
C. Point J
D. Points F, G, and J
5. Solve the system of linear equations algebraically.
6. Match each scatter plot to its description.
The scatter plot shows an outlier.
The scatter plot shows a negative, nonlinear association.
The scatter plot shows clustering.
The scatter plot shows a positive, linear association.
7. Each student at Sparks Middle School takes one elective class. A random sample of students was asked which elective class they currently take. The two-way table shows the number of students in the sample by grade level who take each elective class. Use the data in the table to calculate each proportion in parts (a) and (b).
a. What proportion of students from the sample take art class? If necessary, round the answer to the nearest hundredth.
A. 0.27
B. 0.31
C. 0.36
D. 0.42
b. What proportion of seventh grade students from the sample take yearbook class? If necessary, round the answer to the nearest hundredth.
A. 0.21
B. 0.27
C. 0.30
D. 0.38
8. Over a period of several years, Tiah recorded the number of fish she caught each time she went fishing. She plans to go fishing again today. The table shows the number of fish Tiah caught on previous trips and the probability that she catches that number of fish today.
a. What is the probability that Tiah will catch exactly 4 fish today?
b. What is the probability that Tiah will catch at least 3 fish today?
Name Date
1. Which expressions are equivalent to 43 ⋅ 4−8? Choose all that apply.
A. 4−24
B. 4−5
C. 411
D. 43 4−8
E. 43 48
F. 1 45
2. Which expressions are equivalent to 1.2 × 10⁵? Choose all that apply.
A. 120,000
B. (1.0 × 10⁶) + (2.0 × 10⁵)
C. (2.0 × 10³) (6.0 × 10²)
D. 4 . 8 × 10⁷ 4 0 × 102
E. (2.0 × 10⁵) − (8.0 × 10⁴)
3. Match each statement to the inequality that models it. An inequality may be matched to more than one statement.
Five less than 7 times a number is at least 21
Five less than 7 times a number is less than 21.
Five less than 7 times a number is at most 21
Five less than 7 times a number is no more than 21.
Five less than 7 times a number is greater than 21
7x - 5 < 21
7x - 5 ≤ 21
7x - 5 > 21
7x - 5 ≥ 21
4. Water flows from a hose at a constant rate of 14 gallons per minute.
a. Write an equation to represent the number of gallons g that flows from the hose in t minutes.
b. Complete the table.
c. Graph the relationship between time and gallons of water.
5. Calculate the slope of the line twice by using two different pairs of points.
6. The table represents a function. Which ordered pairs can be input-ouput pairs of the function? Choose all that apply.
7. A right triangle has one leg with a length of 12 cm and a hypotenuse with a length of 20 cm. What is the length of the other leg?
8. Ji-won says that a translation is the only transformation of ABthat will result in an image with the same length as AB. Do you agree with Ji-won? Explain.
Number Correct:
Number Correct: Improvement:
Evaluate the expression.
1. |−7|
2. |7(3)|
ANumber Correct: Evaluate
Number Correct:
BImprovement: Evaluate
Number Correct:
Number Correct:
Improvement:
Number Correct:
Evaluate.
1. −1 + 1
2. 1 + (−1)
3. −1 + (−1)
4. −1 − 1
5. 1 − (−1)
6. −1 − (−1)
7. −1 ⋅ 1
8. 1 (−1) 9. −1 ⋅ (−1) 10. −1 ÷ 1 11. −1 ÷ (−1)
−
⋅
Number Correct:
Improvement:
Evaluate.
1. −2 + 2
2. 2 + (−2)
3. −2 + (−2)
4. −2 − 2
5. 2 − (−2)
6. −2 − (−2)
7. −2 ⋅ 2 8. 2 (−2) 9. −2 ⋅ (−2) 10. −2 ÷ 2
−2 ÷ (−2)
⋅
Solve each equation.
1. x + 4 = 7
2. 3x = 12
Number Correct:
Solve each equation.
1. x + 2 = 6
2. x + 4 = 6
3. x + 6 = 6
4. x − 3 = 12
5. x − 5 = 12
6. x − 7 = 12
Number Correct:
Improvement:
Solve each equation.
1. x + 3 = 7
2. x + 5 = 7
3. x + 7 = 7
4. x − 2 = 10
5. x − 4 = 10
6. x − 6 = 10
7. 9x = 18
Solve each inequality for x.
1. x + 4 > 9
2. 6x < 12
Number Correct:
Solve each inequality for x.
1. x + 2 > 10
2. x + 4 > 10
3. x + 6 > 10
4. x − 3 < 9
Number Correct:
Improvement:
Solve each inequality for x.
1. x + 3 > 12
2. x + 5 > 12
3. x + 7 > 12
4. x − 2 < 8
Solve each equation.
1. 3x + 1 = 10
2. 3x − 4 = 8
Number Correct:
Solve each equation.
1. 2x + 4 = 14
2. 2x + 5 = 15
3. 2x + 6 = 16
4. 2x + 7 = 17
5. 2x + 8 = 18
x −
Solve each equation.
1. 3x + 4 = 10
2. 3x + 5 = 11
3. 3x + 6 = 12
4. 3x + 7 = 13
5. 3x + 8 = 14
6. 3x − 3 = 6
7. 3x − 6 = 6
8. 3x − 9 = 6 9. 3x − 12 = 6 10. 3x − 6 = 18
3x − 6 = 15
3x + 9 = 21
3x + 9 = 18
3(x + 3) = 18
x −
Number Correct:
Improvement:
Rewrite each expression as an equivalent expression in standard form.
1. 1 + (1 + 1)
2. x + (x + x)
Rewrite each expression as an equivalent expression in standard form.
1. 1 + 1
2. 1 + 1 + 1
3. (1 + 1) + 1
4. (1 + 1) + (1 + 1)
5. (1 + 1) + (1 + 1 + 1)
6. x + x
7. x + x + x
8. (x + x) + x
9. (x + x) + (x + x)
10. (x + x) + (x + x + x)
11. (x + x) + (x + x + x + x)
12. 2x + x
13. 3x + x
14. x + 4x
15. x + 7x
16. 2x + 7x
17. 7x + 3x
18. 10x − x
19. 10x − 5x
20. 10x − 10x 21. 10x − 11x 22. 10x − 12x
394
Number Correct:
23. 4x + 6x − 12x
24. 4x + 6x − 4x
25. 4x + 6x + 4
26. (4x + 3) + x
27. (4x + 3) + 2x
28. 3x + (4x + 3)
29. 6x + (4x + 3)
30. 6x + (4 + 3x)
31. 6x + (4 − 3x)
32. 4x + (4 − 3x)
33. 2x + (4 − 3x)
34. (3x + 9) + (3x + 9)
35. (3x − 9) + (3x − 9)
36. (3x − 9) + (3x + 9)
37. (3x − 9) − (3x + 9)
38. (11 − 5x) + (4x + 2)
39. (5x + 11) + (2 − 4x)
40. (11 − 5x) − (2 − 4x)
41. (2x + 3y) + (4x + y)
42. (2x − 3y) + (4x − y)
43. (2x − 3y) + (3y − 4x)
44. (2x + 3y) − (2x − 3y)
Rewrite each expression as an equivalent expression in standard form.
1. 1 + 1 + 1
2. 1 + 1 + 1 + 1
3. (1 + 1) + (1 + 1)
4. (1 + 1 + 1) + (1 + 1)
5. (1 + 1 + 1) + (1 + 1 + 1)
6. x + x + x
7. x + x + x + x
8. (x + x) + (x + x)
9. (x + x + x) + (x + x)
10. (x + x + x) + (x + x + x)
11. (x + x) + (x + x) + (x + x)
12. 4x + x
13. 5x + x
14. x + 8x
15. x + 11x
16. 3x + 11x
17. 11x + 5x
18. 9x − x
19. 9x − 5x 20. 9x − 9x 21. 9x − 10x
22. 9x − 11x
Number Correct:
Improvement:
23. 3x + 5x − 10x
24. 3x + 5x − 3x
25. 3x + 5x + 3
26. (3x + 4) + x
27. (3x + 4) + 2x
28. 3x + (3x + 4)
29. 7x + (3x + 4)
30. 7x + (3 + 4x)
31. 7x + (3 − 4x)
32. 5x + (3 − 4x)
33. 3x + (3 − 4x)
34. (5x + 7) + (5x + 7)
35. (5x − 7) + (5x − 7)
36. (5x + 7) + (5x − 7)
37. (5x − 7) − (5x + 7)
38. (6 − 13x) + (8x + 3)
39. (13x + 6) + (3 − 8x)
40. (6 − 13x) − (3 − 8x)
41. (4x + 9y) + (8x + 3y)
42. (4x − 9y) + (8x − 3y)
43. (4x − 9y) + (9y − 8x)
44. (4x + 9y) − (4x − 9y)
Student Edition: Math 1, Module 1, Bibliography
National Governors Association Center for Best Practices, Council of Chief State School Officers (NGA Center and CCSSO). Common Core State Standards for Mathematics. Washington, DC: National Governors Association Center for Best Practices, Council of Chief State School Officers, 2010.
O’Connor, John J. and Edmund F. Robertson. “Abu Ja’far Muhammad ibn Musa Al-Khwarizmi.” St. Andrews, Scotland: School of Mathematics and Statistics, University of St. Andrews. 2019. http://mathshistory.st-andrews.ac.uk/Biographies/Al-Khwarizmi.html.
O’Connor, John J. and Edmund F. Robertson. “Arabic Mathematics: Forgotten Brilliance?” St. Andrews, Scotland: School of Mathematics and Statistics, University of St. Andrews. 2019. http://mathshistory.st-andrews.ac.uk/HistTopics/Arabic_mathematics.html#13.
Rashed, Rashdi. Al-Khwarizmi: The Beginnings of Algebra. London: Saqi Books, 2010.
Student Edition: Math 1, Module 1, Credits
Great Minds® has made every effort to obtain permission for the reprinting of all copyrighted material. If any owner of copyrighted material is not acknowledged herein, please contact Great Minds for proper acknowledgment in all future editions and reprints of this presentation.
Common Core State Standards for Mathematics © Copyright 2010 National Governors Association Center for Best Practices and Council of Chief State School Officers. All Rights Reserved. For a complete list of credits, visit http://eurmath.link/media-credits.
Cover, Crockett Johnson, Logarithms, 1966, Masonite and wood, 56 cm x 66.3 cm x 3.8 cm; 22 1/16 in x 26 1/8 in x 1 1/2 in. Courtesy of Ruth Krauss in memory of Crockett Johnson, Smithsonian National Museum of American History.
Student Edition: Math 1, Module 1, Acknowledgments
Adriana Akers, Tiah Alphonso, Lisa Babcock, Chris Black, Joseph Phillip Brennan, Beth Brown, Amanda H. Carter, Leah Childers, Mary Christensen-Cooper, Monique Colbert, Jill Diniz, Karen Eckberg, Dane Ehlert, Samantha Falkner, David Gertler, Krysta Gibbs, Winnie Gilbert, Ryan Grover, Kimberly Hager, Robert Hollister, Alanna Jackson, Travis Jones, Emily Koesters, Robin Kubasiak, Sara Lack, Alonso Llerena, Gabrielle Mathiesen, Maureen McNamara Jones, Lauren Nelson, Ben Orlin, Selena Oswalt, Brian Petras, Lora Podgorny, Rebecca A. Ratti, Meri Robie-Craven, Bridget Soumeillan, Ashley Spencer, Danielle Stantoznik, Tara Stewart, Mike Street, Cathy Terwilliger, Carla Van Winkle, Cody Waters
Ana Alvarez, Lynne Askin-Roush, Trevor Barnes, Brianna Bemel, Carolyn Buck, Lisa Buckley, Adam Cardais, Christina Cooper, Kim Cotter, Lisa Crowe, Brandon Dawley, Cherry dela Victoria, Delsena Draper, Sandy Engelman, Tamara Estrada, Ubaldo Feliciano-Hernández, Soudea Forbes, Jen Forbus, Liz Gabbard, Diana Ghazzawi, Lisa Giddens-White, Laurie Gonsoulin, Adam Green, Dennis Hamel, Cassie Hart, Sagal Hassan, Kristen Hayes, Marcela Hernandez, Abbi Hoerst, Libby Howard, Elizabeth Jacobsen, Ashley Kelley, Lisa King, Sarah Kopec, Drew Krepp, Cindy Medici, Ivonne Mercado, Sandra Mercado, Brian Methe, Patricia Mickelberry, Mary-Lise Nazaire, Corinne Newbegin, Tara O’Hare, Max Oosterbaan, Tamara Otto, Christine Palmtag, Laura Parker, Katie Prince, Gilbert Rodriguez, Todd Rogers, Karen Rollhauser, Neela Roy, Gina Schenck, Amy Schoon, Aaron Shields, Leigh Sterten, Mary Sudul, Lisa Sweeney, Tracy Vigliotti, Dave White, Charmaine Whitman, Glenda Wisenburn-Burke, Howard Yaffe
I know . . . .
I did it this way because . . . .
The answer is because . . . .
My drawing shows . . . .
Agree or Disagree
I agree because . . . . That is true because . . . .
I disagree because . . . . That is not true because . . . .
Do you agree or disagree with ? Why?
Why did you . . . ?
Can you explain . . . ?
What can we do first?
How is related to ?
I heard you say . . . . said . . . .
Another way to say that is . . . .
What does that mean?
When I solve a problem or work on a task, I ask myself
Before Have I done something like this before? What strategy will I use? Do I need any tools?
During Is my strategy working?
Should I try something else? Does this make sense?
After
What worked well?
What will I do differently next time?
At the end of each class, I ask myself
What did I learn?
What do I have a question about?
Do you want to compare how fast you and your friends can run?
Or estimate how many bees are in a hive?
Or calculate your batting average?
Math lies behind so many of life’s wonders, puzzles, and plans. From ancient times to today, we have used math to construct pyramids, sail the seas, build skyscrapers—and even send spacecraft to Mars.
Fueled by your curiosity to understand the world, math will propel you down any path you choose.
Ready to get started?
ISBN 979-8-88588-168-5
Module 1
Equations, Inequalities, and Data in One Variable
Module 2
Equations, Inequalities, and Data in Two Variables
Module 3
Functions and Their Representations
Module 4
Transformations of the Plane and Constructions
Module 5
Linear and Exponential Functions
Module 6
Modeling with Data and for Contexts
What does this painting have to do with math?
Although he is best known as a cartoonist for his comic strip Barnaby and the book Harold and the Purple Crayon, the American artist Crockett Johnson also took a keen interest in mathematics, painting more than 100 pieces relating to mathematics and mathematical physics during his life. His painting Logarithms shows two sequences of rectangles. How do the lengths of the rectangles in the top row relate to those in the bottom row?
On the cover
Logarithms, 1966
Crockett Johnson, American, 1906–1975
Masonite and wood
Smithsonian National Museum of American History, Washington, DC, USA
Crockett Johnson, Logarithms, 1966, masonite and wood, 56 cm x 66.3 cm x 3.8 cm; 22 1/16 in x 26 1/8 in x 1 1/2 in.
Courtesy of Ruth Krauss in memory of Crockett Johnson, Smithsonian National Museum of American History