


2022 ANNUAL SUSTAINABILITY REPORT
Solutions for Sustainability

Our products are critical solutions to today’s most pressing sustainability challenges and are helping society reach its aspiration of carbon neutrality. Whether it is in our operations or our innovative technologies, Huntsman is committed to making a brighter world possible for future generations. In this report, we share how our solutions enable sustainability.


We continue to make progress against our near-term Horizon 2025 targets while looking further toward our long-term aspirations. In this report, we outline how our solutions enable a more sustainable world and how we are improving our operations to further drive meaningful progress.
50% Collective Progress on Near-term Horizon
2025 Targets
5% Emissions Footprint Continues to Decrease
20 Number of Product Safety Summaries Published
Reduction in Total Waste Intensity

Board of Directors authorized a doubling of its existing share repurchase program from $1 billion to $2 billion
Jury awards Huntsman $94 million in case against Praxair/Linde with total damages to exceed $125 million
May
Announced sustainabilityrelated features in its financing. Commitment fees and borrowing rates are adjusted based on Huntsman’s performance in intensity reductions for both greenhouse gas emissions and water consumption

Commercial operations underway at MDI splitter, known as Project Patriot, in Geismar, Louisiana
Announced agreement to sell Textile Effects business to Archroma in first half of 2023
Announced transformation of business offices and locations in Europe and plans to open new hub in Krakow, Poland

As we present our annual sustainability report, we take a moment to reflect on our journey in addressing the world’s most pressing challenges. Sustainability, at its core, is about finding innovative solutions to these challenges, and our company remains dedicated to creating a lasting, positive impact through the chemicals and materials we produce.

In the past five years, we have undergone a remarkable transformation. Our company was not previously involved in spray polyurethane foam or electric vehicle batteries. Through strategic decisions and collaborative efforts, however, we have repositioned ourselves to support society’s pursuit of sustainable solutions.
Today, a significant majority of our solutions can trace their roots to providing sustainable alternatives. Nearly all our products replace less efficient ways of meeting societal needs. We are proud to be part of an industry that plays a crucial role in tackling the world’s sustainability challenges. Through our work, we contribute to making homes and buildings more energy efficient, reducing fuel demand in transportation, enabling alternative energy solutions, and increasing the durability of materials to minimize waste.
Sustainability does not only mean providing chemical and material solutions. It also means remaining centered on the safety and well-being of our associates, the communities in which we operate, and our customers. We recognize the importance of
fostering a culture that prioritizes safety, and we are proud of the progress we have made in this regard. Additionally, we are committed to contributing positively to the communities alongside our operations, enhancing their prosperity and resilience.
Amid the challenges posed by global conflicts and threats to energy security, our resilience and adaptability have been integral to our success. In 2022, we took further steps to reinforce our global presence, striving to be more innovative, collaborative, and economically competitive. We have emerged stronger, more focused, and confident in our ability to continue help meet the world’s challenges.
We look forward to working toward an even more prosperous and more sustainable future.
Peter R. Huntsman Chairman, President, and Chief Executive OfficerA

As the Senior Vice President of Environmental, Health, Safety, and Manufacturing Excellence, and Corporate Sustainability Director, I am pleased to share our 2022 Sustainability Report with you. This year, our focus is on internal processes, the safety of our associates, protection of the environment, and taking steps to reduce our operational greenhouse gas and other emissions.

Sustainability is about making the essential things of life and making them in the right way. Sustainability and manufacturing excellence are deeply intertwined. High-quality operations enable us to keep our products under control, protect our workers and the communities where we operate, safeguard the environment, and reduce waste. At its core, sustainability is about people - protecting their health, well-being, and the communities in which they work and raise families. It is about being a good neighbor and contributing responsibly to our communities.
We take pride in the products we make, but it is not simply about producing essential items; it is also about making them the right way. As we strive for sustainability, we focus on the well-being of our associates, their families, and the environments they cherish. We understand that our actions today shape the world of tomorrow, and we are committed to building a brighter, more sustainable future for everyone.
In this report, we are excited to share our progress on our Horizon 2025 goals. Through 2022, we have achieved approximately 50% of these collective targets, a significant milestone on our path to a more sustainable future. Our aspirations of carbon
neutrality, full circularity, and continuing to provide safe and sustainable solutions guide our long-term plans.
For the first time, we are also providing estimates of our Scope 3 emissions, a key step toward greater transparency and accountability in our sustainability efforts. As we advance on our journey, we will continue to refine our processes, improve our metrics, and seek innovative ways to reduce our impact on the planet.
We are proud of the progress we have made thus far and we remain dedicated to furthering our sustainability initiatives in the years to come. We are grateful for your support and partnership as we work together to create a more sustainable, inclusive, and prosperous future for all.
Brittany Benko Corporate Sustainability Officer Senior Vice President, Environmental, Health and Safety, and Manufacturing ExcellenceAs the Chair of the Huntsman Board of Directors’ Sustainability Committee, I am pleased to introduce Huntsman’s 2022 Sustainability Report. Through our people, processes, and products, Huntsman continues to chart the course to a more sustainable future for our society. The chemical industry is a crucial player in achieving sustainable solutions. As a member of the industry, Huntsman continues to strive for more sustainable alternatives not only in our own operations, but in all aspects of the value chains that depend upon us or our products.
Reflecting on the events of the past year, we recognize that our world has faced unprecedented challenges. The Russian-Ukrainian war has had a profound impact on the global community, exacerbating energy and food insecurity, and adding to the socio-economic pressures the world has been grappling with since the onset of the COVID-19 pandemic. These circumstances have highlighted environmental, social, and governance (ESG) issues in the public discourse. We have witnessed both the rise of ESG advocates and the amplification of anti-ESG voices. Despite the varied and often conflicting perspectives, Huntsman remains steadfast in our commitment to sustainability. In fact, supporting Huntsman associates in the creation of sustainable processes and products is quite simply a strategic business imperative.
Our 2022 report highlights our dedication to making our customers more sustainable by promoting energy conservation, alternative energy sources, and support for the cold-chain and food security. The report also highlights our progress in reducing our environmental footprint, investing in our associates, and contributing to the communities in which we operate.
As we navigate these turbulent times, we

prioritize collaboration with our partners and stakeholders, fostering open dialogue and mutual understanding. Our commitment to transparency and stakeholder engagement has never been more crucial, as it enables us to refine our strategies and adapt to the rapidly evolving landscape. By working together, we can develop innovative solutions to the pressing issues facing the global community.
I am proud of the progress Huntsman is making. We remain dedicated to continuous improvement, setting goals and measuring and communicating our progress towards those goals in a transparent manner. I look forward to working with our stakeholders in the years ahead to overcome the challenges before us and build a better tomorrow for future generations.
Jan E. Tighe Board Sustainability Committee Chair, Huntsman Board of Directors
Huntsman Corporation is a publicly-traded corporation, headquartered in The Woodlands, Texas, in the United States of America. Huntsman is a global, differentiated, and specialty chemicals company. For more than 50 years, we have been using science and ingenuity to innovate and create products that enable more sustainable and comfortable lives for millions of people around the world.
In 2022, Huntsman had nearly 9,000 associates working in 70 manufacturing, research and development (R&D), and operations facilities in nearly 30 countries. Through our four divisions, we produce more than 7,500 products to serve a broad and diverse range of consumer and industrial end markets, including:

• Aerospace
• Transportation
• Building and Construction
• Clothing and footwear
• Food preservation
• Energy and fuels
50 More than of innovation YEARS
9,000 Nearly ASSOCIATES working in more than 70 FACILITIES Operations facilities in nearly 30 COUNTRIES

7,500
Producing more than consumer and industrial PRODUCTS
This division is a leading global producer of MDI-based polyurethanes focused on formulating innovative, differentiated products for key downstream markets, including energy-saving insulation, light weighting and performance materials for automobiles, comfort foam for bedding and furniture, protective coatings, adhesives, and elastomers for footwear.
This division offers products that provide useful properties in everyday items people want and need. Our leading global positions in the manufacture and sale of amines, maleic anhydride, and carbonates enable us to serve diverse consumer and industrial end markets, including energy, automotive and transportation, coatings and adhesives, building and construction, electronics, and industrial manufacturing.

This division provides specialty epoxy, acrylic, and polyurethane-based polymer resin systems, as well as adhesive products, which are replacing traditional materials in aircraft, automobiles, and electrical power transmission. These products are also used in coatings, construction materials, circuit boards, and sports equipment.


This division is a major global solutions provider of textile dyes, textile chemicals, and digital inks. We work closely with mills, brands, and retailers to deliver sustainable solutions that meet the economic and environmental needs of the textile industry and the planet. Our range of innovative solutions includes intelligent effects such as durable water repellents, color fastness, sun protection, and state-of-the-art dyes that reduce water and energy consumption. 1
1 Huntsman entered into an agreement on Aug. 9, 2022, to sell the Textile Effects division. The sale closed on Feb. 28 2023. Sustainability and Human Resources metrics include Textile Effects, Financial metrics exclude TE as prescribed by GAAP (discontinued operations).

Huntsman Corporation’s global headquarters is in The Woodlands, Texas, in the United States. As a public company, we are listed on the New York Stock Exchange (NYSE: HUN). Countries/regions where we have manufacturing and R&D operations include:

Australia
Belgium
Brazil
Canada
China
Colombia
Czech Republic
Germany
Guatemala
Hungary
India
Indonesia
Italy
Malaysia
Mexico
New Zealand
Russia1
Saudi Arabia
Singapore
Spain
Switzerland
Taiwan
Thailand
The Netherlands
Turkey
United Arab Emirates
United Kingdom
United States
Vietnam
1 Huntsman has announced its intention to exit its operations in Russia.
Our overriding aim is to enrich lives through innovation, which includes helping the world become more sustainable. Our people, our operations, and our products work together to enable sustainability across the planet.
You may be surprised to learn that the chemical industry makes up approximately 3% to 5% of total greenhouse gas emissions around the world. For an industry that is frequently criticized for negatively impacting society, actual emissions in the chemical industry are lower than the greenhouse gases emitted by livestock. Even more interesting is that Huntsman products directly improve the performance of the industries that make up the bulk of the world’s emissions with our emissions-reducing innovations that include solutions for the building and construction, transportation, and industrial sectors. Huntsman solutions represent hundreds of millions of tons of lifetime emissions avoided each year by these innovative products.
Despite the small percentage of greenhouse gas emissions that the chemical industry contributes, Huntsman remains focused on further reducing its environmental footprint. As a result of our strategy to move further downstream and closer to the consumer, our Scope 1 and 2 greenhouse gas emissions and water consumption have dramatically decreased. By moving further downstream, Huntsman assets are not only less emission-intensive, but are also helping our customers make a bigger difference in their own environmental footprints.
Despite our reduction in Scope 1 and 2 greenhouse gas emissions and water consumption intensity, we remain focused on monitoring and improving our emissions and consumption performance. In May 2022, we announced the incorporation of greenhouse gas emissions and water consumption intensity into our corporate credit facility—one of a select number of companies who have done so. In 2022, we received limited assurance for these performance indicators.

Huntsman recognizes the important role we play in creating a more sustainable future. Our innovative solutions are the catalysts that enable 80% of the economy to reduce emissions. These contributions to a low-carbon economy can help make society’s goal of carbon neutrality a reality. The fact is, without solutions to improve the efficiency of buildings and homes, to enable the electrification and efficiency of the transportation sector, and to contribute to the advancement of alternative energy, the world will not be able to achieve this challenging goal. Huntsman products are enabling sustainability.
80%
40%
Improves Efficiency of Homes and Buildings
Our spray polyurethane insulation reduces air intrusion into homes and buildings, decreasing the amount of energy required for heating and cooling. One ton of our spray polyurethane insulation goes into solutions, resulting in:

• 10 tons of CO2e avoided
• 1.2 tons CO2e to build
• 8x return on invested carbon
Enables Electrification of the Transportation Sector
Our carbonates improve the efficiency of lithium-ion batteries. One ton of our Performance Products carbonates go into solutions, resulting in:

• 1.3K tons CO2e avoided
• 160 tons CO2e to build
• 8x return on invested carbon
Improves Energy Efficiency of the Aerospace Sector

Our resins and hardeners reduce the weight of an airplane by 20% and allow for blended winglets, further improving fuel efficiency. One ton of our Advanced Materials resins and hardeners go into solutions, resulting in:
• 14K tons CO2e avoided
• 350 tons CO2e to build
• 40x return on invested carbon
Enables Alternative Energy
Our specialty amines make the blades of a wind turbine longer, so their operation is more economic. One ton of our Performance Products polyetheramines go into solutions, resulting in:

• 30K tons of CO2e avoided
• 625 tons CO2e to build
• 48x return on invested carbon

Huntsman pursues continuous improvement in our operations. Our Horizon 2025 targets provide key focus areas across the company. These are challenging goals to set, and we hold our operations accountable to higher standards as we produce the solutions that lead to a more sustainable world.

We are targeting a 10% reduction in our energy consumption and Scope 1 and 2 greenhouse gas emissions intensity by 2025 from a 2019 baseline. In addition, we are targeting a 5% reduction in our water consumption in water-stressed areas, total waste production, and our hazardous waste production.
The table at left captures our progress against these targets. Our efficiency targets are measured against a baseline set in 2019. Our denominator for efficiency is sales volumes. Use of our sales volume in the denominator aligns with our peers’ efficiency metric and aligns to lifecycle
Huntsman is aspiring to achieve carbon neutrality by
In addition to our Horizon 2025 targets, Huntsman has announced its long-term aspirations, which include aiming toward carbon neutrality by 2050, becoming a fully circular company, and continuing our processes to assure the safety of our chemicals and materials.
Huntsman aspires to achieve carbon neutrality for its combined Scope 1 (direct) and Scope 2 (indirect, market-based) greenhouse gas emissions by 2050.

However, Huntsman cannot achieve this aspiration alone. Achievement of this aspiration will depend on a myriad of challenging external factors including, but not limited to:
• Pace of technology
• De-carbonization of electricity supply and transportation
• Carbon capture storage and use
• Public policies, regulations, and infrastructure development
We are in the process of developing low-carbon transition plan options and will evaluate those options in the context of these factors. Further details can be found in “Greenhouse Gas Management.”
In addition to our operational emissions, we aim to engage our top suppliers and service providers, including transportation-related providers, on efforts to reduce emissions through our value chain.
We have developed an initial estimate of our Scope 3 emissions. From this initial estimate, we are developing a supplier engagement plan to work toward the 2027 engagement target. Further details can be found in the Greenhouse Gas section.
Our aim is that our suppliers and service providers, who we estimate constitute two-thirds of our non-product use Scope 3 emissions, will establish their own carbon-neutral goal by
There are many efforts around circularity that contribute to reducing the need for new materials to enter the economy. For Huntsman, our Horizon 2025 targets are part of the picture.

Reducing our consumption of energy and water, along with reducing our waste generation, leads to less resource demand and contributes to circularity. Many of our solutions contribute to the durability of products, which extends the life of these products and reduces both the need for replacement and for waste. Our products also contribute to the efficiency of our customers, which is highlighted throughout this report.
While all these factors play a role in circularity, we recognize that stakeholders desire for our products in and of themselves to be more circular. To that end, we will begin in 2023 to measure the portion of our product portfolio that has one or more of the following qualities:
• Sourced from recycled materials

• Bio-sourced
• Recyclable
• Biodegradable
In the future, we will develop targets for increasing the proportion of our portfolio that contains one or more of these qualities. We have added “Circularity” to our material topics list in 2022 to signify this increase in importance, along with the impact of the role we play to contribute to society’s long-term aims (please see “Circularity” on page 73).
Chemical and material safety has long been a priority at Huntsman. The product safety of our solutions is considered on a case-by-case basis, including assessing the use of substances, existing and potential risk management options, ease of substitution, and solution benefits.

We work with regulators, customers, suppliers, and value-chain partners to make these assessments and develop suitable risk mitigation plans that could include phase-out initiatives, reformulation, or development of alternatives.
We evaluate new solution developments against defined substances of concern (SoC) lists at various stages in the development process, using an award-winning SoC risk-evaluation tool.
Our research and development teams look for SoC issues at all stages of the development process as part of the selection of the preferred technical solution and when screening new raw materials from suppliers.
A formal hazard assessment is completed by our Product Environmental, Health, and Safety teams during the new product introduction process.
Products with significant SoC impact may be eliminated, or new product development projects terminated, based on an SoC assessment or if the business case for further development is not viable.
Huntsman will continue to proactively screen for, and seek innovative alternatives to, substances of concern. For more details, please see “Product Stewardship” on page 88.
<4% of our product sales include materials containing substances of very high concern
The top honor for the 2022 CEO Award for Innovation in Sustainability came down to a photo finish. While it was a close and competitive race, the finalist team from Polyurethanes ultimately earned the win.
During the award ceremony, hosted in The Woodlands, Texas, on March 23, 2023, Chairman, President, and CEO Peter Huntsman reflected on the innovation that has defined this organization through the decades.
“We are here because we produce a product that is in continuous development and continuous improvement,” Peter said. “I hope that we’re looking at what we call innovations today, and ten years from now, this industry continues to innovate, create, bend molecules, and continues to do things that were the impossible.”
He commended all the finalists for their hard work and ongoing contributions—“the energy and creativity that we saw today as an officer’s team was phenomenal.”
The Polyurethanes team’s project was on Polyurethane-based Composite Spray Molding Process for Bath Fixtures. The presenting members included Sheila Patel, Dan Heberer, Justin Fogarty, and Kris Modrzynski.
Polyurethanes Division President Tony Hankins noted that the winning project will revolutionize the manufacturing of large bath fixture components. The product, he explained, is a multi-composite spray foam application, but possesses broader applications as well.
This solution uses 2.8 million recycled plastic bottles for every one million pounds of resin used. Annually, it is projected to eliminate 10 million pounds of carcinogenic emissions and 12 million pounds of manufacturing and landfill waste.
“This is such an impressive innovation we can apply across many different applications. The scalability is very significant … and there’s going to be a huge commitment here to make this the most successful innovation we’ve had
since composite wood products,” Tony said.
Kris Modrzynski, Market Manager - Consumer, Adhesives & Coatings, said this was the second year in a row he and his team had earned a finalist spot, but was very grateful they were able to earn the first-place award this year.
“I know everybody has worked really hard on this,” Kris said. “I’m really proud of what we’ve done and the entire team is excited to see what we can do with this in the future—we’re looking forward to doing big things.”
Coming in at a very close second place was the Advanced Materials team with their project on a Flame Retardant HP-RTM System for Power Battery Box. Presenting members included Hongyan Chen, Jason Zheng, Kevin Gui, and Golden Zhu.
Leading up to the first-place announcement, Peter emphasized just how close it was—noting that the judging process ended in a “one-point difference.” He even gave the Advanced Materials team a special tip of the hat by sharing that he’d personally scored them in first place.
Advanced Materials President Scott Wright, accepting on behalf of the team, said the ongoing innovations in EV battery boxes have been a tremendous success for the company and his people have continued to advance these solutions year after year.
“I’m really proud of the team. They deserve a lot of congratulations,” Scott said. “I’m really proud to accept this (award) on behalf of them. Well done team.”
The third-place honor went to the Performance Products team for their project on ULTRAPURE® Ethylene Carbonate (UPEC) Capacity Increase for Lithium-Ion Battery Electrolyte. The presenting members included Daichuan Chen, Daryll Go, Jay Henderson, and Mike McKinney.
This project is projecting that one ton of UPEC will remove 1,927 tons of CO2 lifetime emissions, while enabling growth in EV battery production and supporting EVs that are three times less expensive to operate.


“I know everybody has worked really hard on this. I’m really proud of what we’ve done and the entire team is excited to see what we can do with this in the future—we’re looking forward to doing big things.”
Kris Modrzynski , Polyurethanes’ presenting team member

Presenting Team Members:
Sheila Patel, Dan Heberer, Justin Fogarty, Kris Modrzynski


The Polyurethanes team created a polyurethane-based spray composite system—applied using automated robots—that improves sustainability and durability of bath fixtures for showers and bathtubs. The new formula removes carcinogenic materials (styrene) from the composite spray, which would otherwise be emitted into the atmosphere during manufacturing. Eliminating harmful materials from the formula also reduces the risk of chemical


exposure to manufacturing employees assembling the bathtub and shower units. Coupling the low-toxin spray with recycled materials also enhances the product’s overall durability and over time reduces the number of customer warranty claims filed and paid out. Other benefits include a reduction in customer and installer costs over the long term, with fewer harmful carcinogens emitted into the atmosphere during manufacturing.

Presenting Team Members:
Daichuan Chen, Daryll Go, Jay Henderson, Mike McKinney


Increase for Lithium-Ion Battery Electrolyte

Performance Products’ co-production of ULTRAPURE®

Ethylene Carbonate (UPEC) and regular grade (JSEC) with additional process technology yields a 2.5-times capacity improvement and triples the process catalyst life extension for lithium-ion batteries in electric vehicles. Improving the battery life significantly increases the consumer’s overall driving experience and longevity—and likelihood of purchasing an
Presenting Team Members:
Hongyan Chen, Jason Zheng, Kevin Gui, Golden Zhu
EV car—while eliminating tailpipe emissions and reducing greenhouse gases. The team’s project expands sustainable vehicle options beyond fossil fuel-powered engines and allows Huntsman to reduce its transportation global carbon footprint. As the only United States producer of UPEC for use in lithium-ion batteries, Huntsman Performance Products’ batteries are uniquely positioned to become a leader in the EV market.
Amid rising concerns about the global energy crisis and environmental pollution, the Advanced Materials team focused its project on lightweighting battery boxes in electric vehicles. Worldwide transportation accounts for 24% of greenhouse gas emissions, and many countries have projected they intend to exclusively sell electric vehicles within a decade. The transition from gasoline vehicles to EVs is expected to reduce greenhouse gas emissions by 60 million tons by 2030. At the
core of any EV is the battery, surrounded by a battery box. The team created its EV battery box to be mass produced, cost effective, light weight, strong, and flame resistant. The box is created using a fiber reinforced epoxy resin with an applied High Pressure Resin Transfer Molding (HP-RTM) technology process, which helps with the overall light-weighting mission. The technology also has a fast cure speed, reducing production time from 30 minutes to less than five minutes.

Huntsman is proud to be recognized amongst leaders in sustainability across the industry and the world for our responsible management of our business and resources. Our 2022 honors include:

Award of Achievement
Recognizing facilities with zero fatalities and zero days away from work for employees
• Arlington, TX
• Maple Shade, NJ
• Ringwood, IL
Award of Excellence
Recognizing facilities with zero fatalities, zero days away from work and zero job transfers/ restriction cases for employees and contractors
• Akron, OH
• Ashtabula, OH
• Auburn, MI
• Charlotte, NC
• Conroe, TX
• East Lansing, MI
• Los Angeles, CA
• McIntosh, AL
• Merrimack, NH
• Houston, TX
• Woodlands, TX


Inspired by our support of the United Nations Sustainable Development Goals (SDGs), Huntsman creates innovative products and participates in meaningful community projects to help solve some of the world’s most pressing challenges.
Zero Poverty
• Associates packed shoeboxes of necessities for the homeless community in Belgium
• Huntsman Building Solutions team donated materials and supplies, including its Heatlok® Soya HFO™ closed-cell spray foam insulation, to the Homes for Heroes Foundation to help ready small homes for homeless Canadian veterans
Zero Hunger

• MDI1-based polyurethane systems produce lightweight, insulated sandwich panels for cold chain food preservation
• Polyurethane-based controlled-release fertilizers increase crop yields for corn, rice, sugarcane, wheat, potato, and other specialty crops
Good Health and Well-Being

• Scavenger technology reduces emissions from automotive seating foams by a factor of 10 without compromising comfort
• Development of E-Grade® THEMAH and Choline OH replaces other toxic materials commonly used in cleaning formulations in microelectronics industries
• Donated furniture and proceeds from the sale of cell phones to healthcare institutions in Brazil
• Partnered with foundations in Colombia to support health and wellness
• Sponsored a medical-grade oxygen generation facility in Gujarat, India
• Donated 20,000 units of essential medical equipment to frontline workers in India
Quality Education
• Implemented Huntsman mentors and scholarship programs in communities near our operations
• Supported local science fair sponsorships and judging in support of STEM education
Gender Equality
• Dedicated multi-purpose medical facility focusing on providing health care for women and children in India
• Organized skill-building programs for women in India
Clean Water and Sanitation

• AVITERA® SE dyes reduce water consumption in textile manufacturing by up to 50%
• Digital inks reduce water consumption up to 60% in the production of printed textile fabrics
• Implemented operational projects in Panyu, China, to effectively route and treat wastewater and eliminate effluent from flowing into a nearby river
• Partnership with China Green River Environmental Protection Promotion Association to collect plastic waste from the Yangtze River in the Qinghai-Tibet Plateau
1 MDI: methylene diphenyl diisocyanate
Affordable and Clean Energy

• Epoxy curing agents, composite resin systems, and structural adhesives enable larger, stronger wind blades that can maximize energy and withstand weather
• Innovative solutions in high-performance insulating materials are extending the reliability and lifetime of electric vehicle motors
Decent Work and Economic Growth

• Established vegetable nurseries, fish and poultry farms, and livestock management programs for farmers, fishermen, and rural women in India
• Supported job training and job search programs in communities near our operations
Industry, Innovation, and Infrastructure

• Thermoset chemistries extend the lifetime of infrastructure and equipment through more durable coatings
• Led the industry’s transition away from PFC chemistries commonly found in durable water repellents in the textile industry through the development of new products and technologies
• Supported skill building and equipment purchases among fire brigades and departments in communities near our operations
Reduced Inequalities

• Supported Bright Life Program for individuals with special needs
• Provided free health care to 25,000 people in India through mobile medical vans
• Supported community clinics for underserved communities in the U.S.
Sustainable Cities and Communities

• District Central Heating (DCH) project in China reduces PM2.5 dust associated with coal-fired electricity generation and improves ambient air standards
• DaltoPIR® fire-rated panels deliver fire and smoke safety properties without compromising energy efficiency and cost
• Spray polyurethane foam (SPF) insulation is the highest-rated insulant available in the market today
• Huntsman innovations benefiting the electric vehicle market are reducing emissions and contributing to more sustainable communities
Responsible Consumption and Production

• DCH project in China utilizes waste heat to warm millions of homes
• Waste polyethylene terephthalate (PET) bottles are transformed into TEROL® polyols, a key ingredient in energy-saving SPF insulation
• 3D printing technology utilizing Huntsman’s thermoplastic polyurethane (TPU) materials in the footwear industry uses less material and eliminates waste
• Digital inks reduce water consumption, pollution, energy use, CO2 emissions, and waste
• MDI binders turn waste rice straw and rubber crumb into raw materials for new products
• Bio-based technologies enable automotive OEMs to achieve a 9%+ level of bio-based content
• Waste-reduction and energy-efficiency projects at manufacturing facilities around the world are reducing water usage, energy usage, and waste production
• “Bottle for Bottle” program in China to collect, recycle, and repurpose PET bottles to create winter school uniforms for children
Climate Action

• DCH project in China reduces coal-fired power consumption
• ARALDITE® adhesives and structural composite systems enable light weighting in automotive and aerospace applications to reduce fuel consumption, energy use, and CO2 emissions
• Carbonates create better lithium-ion battery technology to power electric vehicles
Life Below Water

• Huntsman’s polyurethane-based controlled-release fertilizers utilize technology that reduces nutrient leaching and volatilization losses up to 95%
Peace, Justice, and Strong Institutions
• Supported court-appointed special advocates for children in foster care in Texas

Huntsman’s Chakan site in Pune, Maharashtra, an area considered one of India’s most essential industrial and economic zones, has new reason to celebrate. The site’s installation of solar panels across more than 1,000 square meters of the plant’s rooftop—a project in the works for more than two years—culminated in March with the launch of its 180-kw solar model. The solar plant has been online since July 22.

“We’re making history for the Chakan site,” said Vishal R. Upadhye, head of operations and supply chain for Huntsman’s polyurethanes production site in Pune. “Everyone was happy, and it’s not only because of the project but because we’re excited about the sustainability, the use of natural resources.”
In addition to being a known industrial zone, Pune is noted for its kind weather, with more than eight months of sunlight and generally mild temperatures. It contributes to Pune’s ongoing recognition as one of India’s “Most Livable Cities.” In more recent years, the city has also gained attention for its burgeoning growth of rooftop solar energy installation. Quartz India reported in 2019 that Pune, the second largest city in Maharashtra, beat out Delhi and Chennai for solar power usage.
Pune’s eight or nine months of sun also lends itself to favorable conditions for the collection of sunrays into solar panels. Chakan’s site boasts commer cial grade panels generating up to 110 percent capacity that can service the entire plant’s electricity needs and feed any remaining energy back to the grid for later use, which it often does, Upadhye said.

“We want to show that not only do we want to do this for the future of ev eryone at Huntsman, but we want to do this for this for the future of our society, for the future of our kids,” he said.
The 30-meter-high panels, covering three different areas of the plant, were installed with all proper permissions from local authorities. Solar generation occurs daily, from morning until about 5 p.m. After sunset, the plant operates on grid power.
Upadhye said even though the solar panels can use up to 180-kw per day, the plant is using less energy on average per day, and any energy left over, is reimbursed to Huntsman.
“So let’s say we generate 100-kw one day and we have 80-kw leftover. The supply company will pay us for that,” Up adhye said, mentioning Huntsman opted for a 10-year lease-to-own program where it will own the entire solar plant asset and be at 100 percent energy profit in 10 years. “We’re already seeing about 15 percent savings each month. But if we generate less and use less, we can sell our additional leftover solar energy.”
The Chakan site’s contract also includes 10 years of free maintenance
through its partner company, Metcon. When the assets are paid off at the end of the 10-year term, however, maintenance will no longer be provided.
“From a site perspective, we’re all excited to be experimenting with a new thing. Nobody had seen this in their previous organizations, how these panels really can fulfill the day’s requirements,” said Pune’s site manager, Ashish Badhe. “And there’s the wow factor: ‘Wow, we’re entirely operating on solar and taking zero energy from the grid.’ This technology is impressive and we are one of the few using it.”
Continued efforts by large companies in the area to adopt solar is on the rise. Huntsman is not the first, or only organization using solar energy, but
oil and biomass generate the majority of energy, with coal making up about 75 percent of India’s total power generation. Hydropower systems are also prevalent, yet with a population of 1.38 billion, outages are common nationwide. In Pune however, power reliability is more common.
Earlier this year, Reuters reported a nationwide power crisis for the whole of India due to extreme heat, surges of air conditioning and electricity usage from at-home employees overwhelming the grid during afternoon hours. PreCOVID, peak energy usage occurred in the evening after traditional work hours, but now much of the nation’s power consumption is occurring during the day when temperatures are hottest.
of us other than the economic benefits of this plant going solar.”
Across India, too, solar and wind usage is becoming more popular, though not yet a primary energy source. Coal,
supported and encouraged us in our new endeavors,” Upadhye said. “We thank and extend our gratitude to all teams involved to make this project possible.”

In addition to creating and manufacturing products that make a sustainable impact, Huntsman is also committed to giving back to the communities where its employees live and work. Our corporate contributions take many forms as we invest our time, talents and resources with the aim of making the world a better place. Huntsman’s approach is simple: We assess the needs in the areas where we do business and plug in to opportunities that meet the needs of those communities, which tend to follow the U.N. Sustainable Development Goals.
More than 600 guests attended the Interfaith of The Woodlands’ 21st annual gala
“The Miracle of Interfaith,” where Huntsman was the presenting sponsor.
More than 600 guests attended the Interfaith of The Woodlands’ 21st annual gala, “The Miracle of Interfaith,” where Huntsman was the presenting sponsor. The gala, held at The Woodlands Waterway Marriott Hotel and Convention Center on April 7, honored local Hometown Heroes and raised more than $450,000 to fund crisis assistance programs in South Montgomery County, Texas. All proceeds from the evening went toward Interfaith’s outreach programs, such as its full-service food pantry, family programs and vouchers, senior services, resale shop, school supply drives, among many others. Since 1999, Interfaith has recognized more than 144 distinguished individuals,
businesses and organizations as Hometown Heroes.
Missy Herndon, President and CEO Interfaith of The Woodlands said, “This Gala is symbolic of The Woodlands representing neighbors helping neighbors in the name of service. Each year, our community comes together to celebrate the gift of generosity, the impact of supporting our neighbors and to honor our Hometown Heroes.”
Wade Rogers, Huntman’s Chief Compliance Officer and Sr. Vice President of Global Human Resources, also serves on Interfaith’s board of directors. Peter Huntsman, chairman, president, and CEO, and his wife, Brynn, both serve on Interfaith’ s board of advisors.


Huntsman served as the presenting sponsor of the 2022 Court Appointed Special Advocates (CASA) Speaks for Kids gala, “Escape to Paradise: A Night in the Tropics.” The annual CASA Child Advocates of Montgomery County fundraiser, held on March 5, 2022, at the Margaritaville Resort in Conroe, Texas, helped support the organization’s efforts to provide court-appointed advocates to abused and neglected children and families involved in the child welfare system. Since 2010, Huntsman has contributed more than $330,000 to CASA Child Advocates of Montgomery County, not including matching gifts and gala underwriting donations.
“Huntsman Corporation’s support of CASA Child Advocates through the years has been invaluable, both in leadership contributions to our board of directors, as well as funding to our organization,” said Ann Marie Ronsman, president and CEO of CASA Child Advocates of Montgomery County. “Thousands of children in Montgomery County have benefitted from Huntsman’s generosity to CASA over the past 13 years. We are so grateful for their longtime and continued partnership.”
The cost to provide a volunteer CASA advocate to a child in the county is $2,000. Each CASA is rigorously trained, then appointed
by a judge to remain with their assigned case until the abused or neglected child is placed in a permanent, safe home. For many of the children, the CASA representative is the only safe adult presence in their life. Huntsman employees are committed to the ongoing success of CASA, and many attend events throughout the year to support the cause. Brittany Benko, Huntsman Senior Vice President of Environmental Health and Safety, also serves on the Montgomery County CASA board.


“To be a part of an organization such as CASA that continues to make a real impact in the lives of some of our most vulnerable children is a gift I can never repay. I’m proud to work for a company that supports and believes in CASA’s mission.”
—Brittany Benko, Corporate Sustainability Officer, Senior Vice President of Environmental, Health and Safety, and Manufacturing Excellence
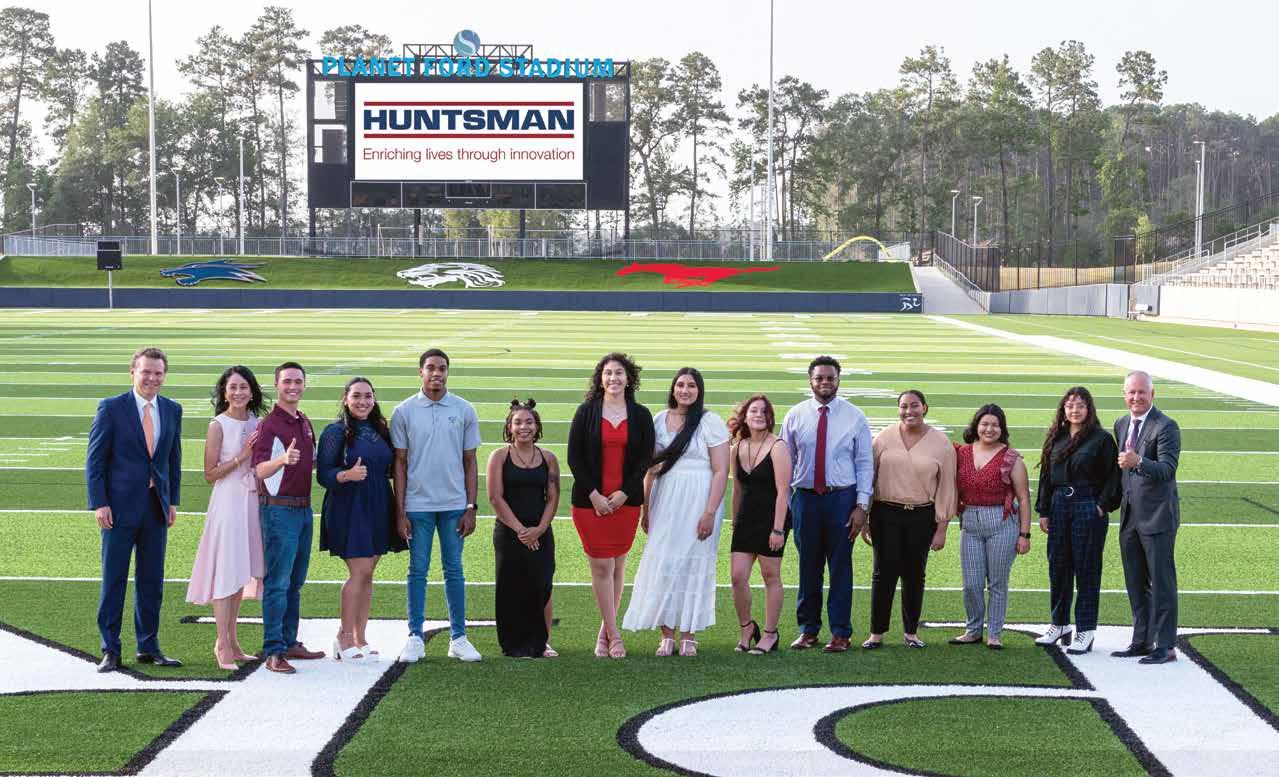
High school students from Spring Independent School District (ISD)—who attend school near Huntsman’s headquarters in The Woodlands, Texas—were honored on June 15 with university and vocational scholarships from the Huntsman Scholarship Program.

In its second year in 2022, the Huntsman Scholarship Program recognized the outstanding achievements of students from Spring ISD’s four high schools in the district. Sixteen students received scholarships of $5,000 per year, renewable for up to four years, for attending an accredited college or university and majoring in science, technology, engineering or mathematics (STEM) or business-related fields. Six additional students received
Career and Technical Education (CTE) scholarships, which awards $1,250 to pursue a certificate or associate degree in STEM; transportation, distribution, and logistics; manufacturing; or energy.
“From our inception as a company, a strong spirit of giving has always been a part of who we are,” said Peter Huntsman, chairman, president, and CEO. “While that has taken many different forms over the years, providing educational opportunities to students who have
demonstrated a desire to build a bright future is always a smart investment for generations to come.”
Huntsman’s scholarship program continues to expand and attract new students each year, who may otherwise not have financial opportunities to pursue higher education. While attending university, and shortly after graduation, scholarship students are also invited to apply for the Huntsman internship program.


“Providing educational opportunities to students who have demonstrated a desire to build a bright future is always a smart investment for generations to come.”
— Peter Huntsman , chairman, president, and CEO
The executive officer team is the primary committee responsible for decision making on economic, environmental, and social topics. The Board Sustainability Committee provides oversight of environmental, health, safety, and sustainability-related topics.
The following provides further details on the bodies involved in sustainability for Huntsman.


Huntsman’s highest governance body is our Board of Directors. Nine of the 10 members are independent or non-executive. Peter Huntsman serves as the Chairman of the Board, President, and Chief Executive Officer of the company. As of the issuance of this report, the Board was structured as follows:

In February 2021, the Board Sustainability Committee was formed, and is chaired by Jan E. Tighe, U.S. Navy Vice Admiral (Retired). More information regarding Board Sustainability Committee, and the Board’s management of


topics, can be found at Guidelines & Ethics :: Huntsman Corporation (HUN).

Led by Peter Huntsman, the committee comprises the executive team along with representatives from key functions.
The committee provides executive direction of the corporate sustainability program and submits regular updates to the board. As of the issuance of this report, the committee was structured as follows:
Peter R. Huntsman
Chairman, President, and Chief Executive Officer
Philip M. Lister
Executive Vice President and Chief Financial Officer
David Stryker
Executive Vice President, General Counsel, and Secretary
Anthony Hankins
Chief Executive Officer, Asia Pacific and Division President, Polyurethanes
Rohit Aggarwal
Division President, Textile Effects
Scott Wright
Division President, Advanced Materials
Chuck Hirsch
Division President, Performance Products
Brittany Benko
Corporate Sustainability Officer, and Senior Vice President, Environmental, Health and Safety, and Manufacturing Excellence
R. Wade Rogers
Senior Vice President, Global Human Resources and Chief Compliance Officer
Ivan M. Marcuse
Vice President, Investor Relations and Corporate Development
Gary Chapman
Vice President, Global Communications
Kevin Gundersen
Global Director, Government and Public Affairs
Jeff Morgheim
Global Sustainability Director
Led by Corporate Sustainability Officer
Brittany Benko, the council comprises senior representatives from the company’s divisions and key functions.
The council directs development of the corporate sustainability program and cultivates a common framework for sustainability, ensuring strategic alignment among the divisions, functions, and executive team.

Brittany Benko
Corporate Sustainability Officer, and Senior Vice President, Environmental, Health and Safety, and Manufacturing Excellence
Todd Bloomfield
Vice President, Purchasing
Gary Chapman
Vice President, Global Communications
Twila Day Vice President and Chief Information Officer
Ralph DiGuilio
Vice President, Global Research and Development, Performance Products
David Hatrick
Vice President, Innovation, Advanced Materials
Ivan M. Marcuse
Vice President, Investor Relations and Corporate Development
Bill McPherson
Global HR Director, Corporate Functions
Jeff Morgheim
Global Sustainability Director
Pavneet Mumick
Global Vice President, Technology and Innovation, Polyurethanes
Kevin Gundersen
Global Director, Government Affairs
Max van der Meer
Vice President Global Operations and Technology, Polyurethanes
| GRI 2-23 | GRI 2-24 |
At Huntsman, good governance and corporate responsibility are integral parts of our business strategy. The key focus areas of our corporate responsibility program include: our people; health, safety, and wellness programs, and our environmental stewardship, including our sustainability and product stewardship efforts.
To learn more about our policies, including how we embed our policy commitments, enable the reporting of potential violations of policies, and manage our commitment to compliance with the laws and regulations applicable to our activities, please see our governance disclosures at Governance :: Huntsman Corporation (HUN).

Huntsman works to ensure that our corporate policies, procedures, and guidance documents align with the Ten Principles of the United Nations Global Compact (UNGC). The table below identifies relevant Huntsman policies, procedures, systems, and actions that illustrate our progress.
1 Support for human rights
2 Elimination of human rights violations
Since 2012, our Business Conduct Guidelines make specific reference to the UNGC and our commitment to operating under its standards in all communities where we do business. In addition, Huntsman’s Vendor Code of Conduct applies to all vendors and their employees, agents, and subcontractors. See also: Huntsman Human Rights Policy.
3 Ensuring freedom of association
Associates are ensured freedom of association and are reminded of that right through visible postings at our facilities.
4 Abolition of all forms of forced labor 5 Abolition of child labor
In every region of the world, our Human Resources department is charged with ensuring that direct-hire Huntsman associates have necessary and legally required documentation to establish their identity, legal age, and work status. See also: Huntsman Human Rights Policy.
6 Elimination of discrimination
Huntsman upholds a policy against discrimination, including harassment and retaliation.
• The Corporate Ethics and Compliance (E&C) department reports any reported human rights violations to the Audit Committee, which includes members of the Board of Directors.
• “Speak Up” confidential reporting service for reporting concerns.
• International Trade Compliance risk assessments for at-risk countries.
• Prequalification due diligence of vendors with high-risk profiles.
• Periodic re-qualification due diligence review of highrisk vendors and all distributors.
• Global EHS standards and procedures.
• Of all Huntsman employees, 42% are covered under collective bargaining agreements, including both union and work councils.
• Huntsman engages in planning to ensure employees are treated with respect and dignity regarding operational changes that involve a change in staffing levels or otherwise affect employment.
• Standard contract clauses require each vendor to agree that no child or indentured labor is used by the vendor in the performance of its business.
• Periodic E&C combined policy audits conducted for selected sites that include audits on human rights, child labor, and forced labor.
• Ethics and compliance training.
• Online training regarding harassment in the workplace.
• U.S. Purchasing groups offer technical assistance in the preparation and submission of bids to Huntsman, which can include small or disadvantaged businesses.
Huntsman’s EHS Management System includes 7 Global EHS Standards and 70 Global EHS Procedures to ensure safe operation at all its facilities.
Our Product Stewardship Standard EHS-700 outlines global requirements to ensure responsible management of EHS issues relating to Huntsman products throughout their life cycle.
Huntsman’s Environmental Standard EHS-600 outlines global requirements to identify and minimize the environmental impact of our operations and to strive for continuous improvement.
We committed to publish 30+ product safety summaries as part of our Horizon 2025 targets to enhance transparency and provide stakeholders with helpful information.
Huntsman’s Process Safety Standard EHS-400 outlines global requirements to identify and manage risk associated with process safety incidents and their impacts on the environment.
Initiatives to promote greater environmental responsibility
Huntsman has published our EHS Policy and Commitment on our website, which includes a commitment to the Responsible Care® program and placing care for human health, safety, and the environment at the forefront of everything we do.
Huntsman has developed and published our Horizon 2025 global strategic targets in areas of personal and process safety and environmental performance, including production intensity targets in greenhouse gas emissions, energy consumption, hazardous waste disposal, and net water usage.
We completed a comprehensive water stress study in 2020, covering all our manufacturing sites. This study not only informs which sites will be in scope for our Horizon 2025 reduction target, but also helps us understand how we can better address water risks in our portfolio.
• Our Product EHS Group actively manages product and raw material risk, including hazard communication (such as safety data sheets), compliance, customer risk evaluation, and distribution risk management.
• All Huntsman facilities are required to identify, quantify, and minimize energy use, as well as air, water, and waste releases from routine operations.
• Management of Change (MOC) procedures at all facilities require consideration of environmental impacts for new projects and changes in processes.
• Process Hazard Analysis (PHA) procedures identify process safety hazards and the appropriate safeguards to prevent or mitigate impacts to the environment from loss-of-containment events.
• In 2022, we updated 39 REACH dossiers for substances— including 886 voluntary submissions beyond those required by the European Chemicals Agency (ECHA).
• As of the end of 2022, we published 20 product safety summaries that are available on our website, toward our goal of publishing 30 or more by 2025.
• We publish our annual Sustainability Report in accordance with the latest GRI Standards (2021) and provide both an SASB index and Task Force on Climate-Related Financial Disclosures (TCFD) indices to meet growing stakeholder interests and support our ongoing commitment to transparency.
• Developed a predictive chemical risk tool to identify and evaluate substances of concern
• Huntsman is a founding Bluesign® system partner to promote responsibility throughout the textiles value chain.
• Contributor to the Zero Discharge of Hazardous Chemicals (ZDHC) Program since September 2019, a foundation that works on several programs aimed at improving sustainability across the textile value chain
• Of our manufacturing sites, 24 (34%) are ISO 14001 certified.
• In 2022, we completed eight corporate EHS audits and eight corporate process safety management (PSM) audits.
• We have Community Advisory Panels (CAPs) at major facilities.
• We presented a CEO Award for Innovation in Sustainability and encouraged a wide field of entries from our associates globally. See 2022 finalists under the Who We Are section.
Development and diffusion of environmentally friendly technology

In our EHS Policy and Commitment, our policy is to place care for human health, safety, and the environment at the forefront of everything we do, and our mission is to provide products and solutions through the applications of science that enrich lives and help create a sustainable future, while doing no harm to people or the environment.
As a member of the American Chemistry Council (ACC), we support ACC’s sustainability principles that commit to achieving measurable reductions in emissions and creating innovative products for a sustainable future and societal benefits.

Our Corporate Ethics and Compliance department oversees and supports our compliance with relevant laws, regulations, and related Huntsman policies worldwide. See also: Huntsman Business Conduct Guidelines, Vendor Code of Conduct.
• Many of our products contribute to the UN Sustainable Development Goals (SDGs).
• We use waste PET in our polyols as raw material to produce polyurethane insulation. We have expanded our TEROL® polyols manufacturing to Taiwan—enabling us to meet increasing market demand for recycled content.
• We upcycle the equivalent of over 1.5 billion PET bottles annually, with the equivalent of over 10,000 recycled bottles used in each home, by utilizing our spray foam from the newly created Huntsman Building Solutions (HBS) business.
• Our R&D initiatives reduce volatile organic compounds (VOCs), enable lightweight materials for the automotive and aerospace sectors, increase bio-based content, and improve energy-saving insulation for buildings and refrigerated transport that reduces food waste through the cold chain.
• AVITERA® SE dyes reduce water consumption in textile manufacturing by up to 50%—in 2022, our dyes helped save roughly 1.5 billion liters of water for customers.
• We have an array of tools for reporting (third-party-run hotline and website for confidential “whistleblower” reporting, dedicated mailbox, monthly communications to all employees, quarterly poster campaigns), investigating, tracking, and correcting ethics, compliance, and corruption allegations.
• We report statistics to the Officers and Senior Leaders monthly, and present detailed overviews to the Board quarterly.

• We conduct third-party due diligence when adding new vendors to confirm that vendors and representatives comply with all applicable laws and regulations, and with our policies. This due diligence is re-done periodically based on a risk matrix evaluation.
• Periodic audits are conducted at Huntsman sites.
Huntsman is a member of the following associations:
We engage with our stakeholders to identify actual and potential impacts of our operations, and to determine prevention and mitigation responses to potential negative impacts. The following table outlines our stakeholder categories, how we assess their concerns, communicate with stakeholders, and measure engagement effectiveness.
Stakeholder Category Methods to Assess Concerns
Employees
• Human Resources Department
• Employee Helpline
• Division EHS Business Partners
• Site EHS Leadership
Contractors
• Site EHS Leadership
• Division EHS Business Partners
• Purchasing/ Contracts
Huntsman
Board of Directors
• Quarterly Meetings/ Reviews
Investment Community
• Direct Engagement with Investors
Customers
• Customer Surveys/ Audits
• Customer Service
• Product Safety Hotline
Communications Channels Methods to Measure Effectiveness
• EHS Scorecards
• Sustainability Report
• Training
• EHS Conferences
• CEO Awards
• Huntsman Intranet
• Global Emails
• Site EHS Leadership
• Division EHS Business Partners
• Purchasing/ Contracts
• EHS Scorecards
• Sustainability Report
• Quarterly Meetings/Reviews
• Investor analytics reporting (e.g., MCSI, Sustainalytics, ISS)
• Sustainability Report
• Disclosures on Climate (CDP)
• Horizon 2025 Targets
• Product Information (Material Safety Data Sheets, Labeling)
• Product Safety Summaries
• Sustainability Report
• Sales Contact
• Management Review
• Employee Surveys
• EHS Scorecards/Targets
• Horizon 2025 Progress Review
• Site EHS Performance Review
• EHS Scorecards/Targets
• Horizon 2025 Progress Review
• Management Review
• EHS Scorecards/Targets
• Horizon 2025 Progress Review
• Investor Ratings
• Management Review
• Horizon 2025 Progress
• TCFD Disclosure
• Customer Surveys (Division Communication Teams)
| GRI 2-29 | CDP C.12 | TCFD Metrics and Targets C |Stakeholder Category
Suppliers
Methods to Assess Concerns
Communications Channels
• Vendor Code of Conduct
• Ethics Screening
• Vendor Code of Conduct
• Ethics Screening
• Purchasing/ Contracts
Community (at Large)
• Huntsman Website Contact Link
Community (Near Neighbors)
• Community Advisory Panels (CAPs)
• Chambers of Commerce
• Fire Department Tours
• Local Memberships, such as Local Emergency Planning Committees (LEPCs)
Regulatory Agencies
Government Officials
Chemical Industry Affiliates
• Direct Engagement with Regulators
• Government Affairs Team
• Memberships with National Organizations and Trade Associations (such as ACC)
• ACC Committee Involvement
• Product EHS Supplier Questionnaire
• Vendor Safety Data Sheet (SDS) system
• Huntsman Website
• Social Media
• Sustainability Report
• Horizon 2025 Targets
• Corporate Crisis Plan
• Site Emergency Response Plans
• Community Advisory Panels
• Chambers of Commerce
• Fire Department Tours
• Local Emergency Planning Committees
• Phone Contact
• Social Media
• Huntsman Website
• Direct Engagement with Regulators

• Sustainability Report
• Government Affairs Team
Methods to Measure Effectiveness
• Supplier ESG-CSR Management System (Under Development)
• Polyurethanes Industrial Hygiene Assessments
• Huntsman Website Analytics
• Huntsman Website Feedback Survey
• Feedback During Outreach Activities
• Charitable Activities
• Huntsman Website Analytics
• Sustainability Report
• Membership Reporting (ACC)
• ACC Committee Involvement
• Direct Feedback
• Direct Feedback
• Trade Shows
• Industry Benchmarking (ACC)

Huntsman conducted a materiality review in 2022 and updated our disclosure accordingly. We apply the 2021 Global Reporting Initiative (GRI) standard, using the single dimension of the potential impact of a material topic to our stakeholders in the context of our activities, business relationships (including but not limited to suppliers and customers), and the sustainability context of our business.
In assessing materiality of topics, we considered not only the near-term and long-term potential impacts, but also the potential severity and potential likelihood of the impacts. We considered both direct and indirect roles that Huntsman could play in these potential impacts.
The material topics are reviewed and approved by the Sustainability Council and Executive Sustainability Committee and are reviewed by the Board Sustainability Committee.

This sustainability context includes our potential impacts to the planet, people (including human rights), and prosperity of our stakeholders.
Our review included discussions and consultations with stakeholders and experts (such as our customers, internal experts, and management) through our internal risk assessment process, employees, and investors. We took further input from the Sustainability Accounting Standards Board (SASB) materiality map for the chemical sector, and from external sustainability rating organizations, benchmarking with our peers, and macro trends, both for our industry and more broadly.
We apply GRI Disclosure 3-3 to report how we manage each material topic.
• Energy Management
• Water Management
• Air Quality
• Waste Management
• Circularity
• Workforce Health and Safety
• Process Safety
• Community Relations
• Product Stewardship
• Employee Engagement and Development
• Diversity, Equity, and Inclusion
• Reliability
• Cybersecurity
• Product Innovation
|
GRI 3-2
Please note that “Principles of Governance” is covered both in our discussion of governance for sustainabilityrelated topics (please refer to “Sustainability Governance”) and our corporate governance disclosures (please refer to the GRI Index).
There were no changes in material issues from our last Sustainability Report.
Huntsman | 47 2022 Annual Sustainability Report

Our solutions enable sustainability. However, it is important that we are as efficient as possible, and that we work to protect the environment as we make those solutions possible.
The following section describes how we manage the material environment aspects of our business, along with our progress to improve our operations.


Huntsman has pursued a transformation strategy to deliver sustainable solutions to the world. We have targeted our efforts to address our customers’ needs for innovation, sustainability, and reduced carbon footprints. As highlighted in our Who We Are section, Huntsman’s products enable a lower greenhouse gas emissions future.
Our manufacturing operations require large amounts of energy to power processing units, machinery, and non-manufacturing facilities. Given that a substantial portion of our energy supply comes from non-renewable sources, our energy consumption generates greenhouse gas emissions both at our sites and those who provide steam and electricity to our sites. We also emit greenhouse gases from our processes. We do not sell greenhouse gases.
It is important to note that the greenhouse gases required to produce Huntsman’s products is dwarfed by the carbon savings our products generate. However, Huntsman understands the need for sensible reductions of all sources of greenhouse gases and we are committed to reducing our operational greenhouse emissions. Our Horizon 2025 goals include a target to reduce Scope 1 and 2 greenhouse gas intensity by 10% from our 2019 baseline by 2025. Working toward this goal also supports our energy and water reduction targets. We continually identify opportunities to reduce our greenhouse gas emissions, either through the reduction of energy demand (please see Energy) or procuring renewable energy when it makes economic sense to do so.
Longer term, Huntsman aspires to achieve carbon neutrality for its combined Scope 1 (direct) and Scope 2 (indirect, market-based) greenhouse gas emissions by 2050.
In addition to our operational emissions, we aim to engage our top suppliers and service providers, including transportation-related providers, on efforts to reduce emissions through our value chain. Our aim is that our suppliers and service providers, whom we estimate constitute two-thirds of our non-product use Scope 3 emissions, will establish their own carbon-neutral goals by 2027. We have
now begun to estimate and disclose our Scope 3 emissions. Our sites measure and report energy consumption, including the type of energy consumed for on-site operations, as well as purchased electricity, heating, cooling and steam, energy generated but not consumed, and energy sold. We apply local factors to energy consumed to determine greenhouse gas emissions from our energy use. We also estimate our process-related emissions using sound engineering methods.
All forms of greenhouse gases are converted to carbon dioxide equivalent (CO2e) emissions using the standard Intergovernmental Panel on Climate Change (IPCC) Assessment Report (AR) 5 (or IPPC AR5) for the 100-year time horizon global warming potentials (GWPs) relative to carbon dioxide (where CO2 = 1). We divide total CO2e emissions by sold production to determine intensity.
In 2022, our Scope 1 and 2 greenhouse intensity was 0.414 metric tons of CO2e per ton of sold product, or
5%
lower than our 2019 baseline.
Our emission intensity target is based on Scope 1 emissions and market-based Scope 2 emissions. All greenhouse gases are included for Scope 1 and carbon dioxide, methane and nitrous oxide for Scope 2 emissions. This methodology applies to our absolute emissions as well.
Our base year is 2019 per our Horizon 2025 targets. The intensity for our base year was 0.436 metric tons of CO2e per metric ton of sold products.
The following table shows the percentage of Scope 1 and location-based Scope 2 emissions that are regulated.
In 2022, our Scope 1 plus Scope 2 (market-based) greenhouse gas emissions intensity was higher by 0.021 metric tons of CO2 e per metric ton of sold product as compared to 2021. Despite our absolute quantity of operational emissions dropping by over 100,000 metric tons of CO2 e, or 10%
of 2021 emissions, our sales of product dropped by more than 10% year-on-year, resulting in an overall increase in our emissions intensity. This is primarily due to baseload energy demand that does not fluctuate with lower production.

| GRI 305-1 | SASB RT-CH-110a.1 |
The following tables show gross direct (Scope 1) greenhouse gas emissions in metric tons of CO2 equivalent within Huntsman. These include emissions from all sources where Huntsman exercised operational control. All the emissions apply to the Chemical Sector. None of these emissions are the result of biogenic sources. The tables break down emissions by type, region, and division.

The following tables show both gross location-based and gross market-based energy indirect (Scope 2) GHG emissions in metric tons of CO2 equivalent within Huntsman. These include emissions from sources where Huntsman exercised operational control. All emissions apply to the Chemical Sector. The tables breakdown emissions by type, as well as by region and division.
The sites update the factors for other fuels, non-combustion process emissions, purchased electricity, and purchased steam. We then apply these factors to both annual and monthly metrics to calculate energy consumption and greenhouse gas emissions. Whenever possible, local
parameters were used for the most accurate reporting. For some sites, this was only possible at the national level.
“Location-based” and “market-based” parameters were collected for imported grid electricity. Location-based is the location where the electricity is physically generated. Market-based parameters account for agreements the company may enter with an electricity provider to purchase more renewable energy as a portion of the supplied electricity. Sites that entered into an agreement with an electricity provider to purchase a larger share of electricity from renewable sources obtained a certification from the electricity provider attesting to the validity of the supplied renewable energy.
Scope 1 emissions decreased by 31,434
metric tons as compared to 2021.
In 2022, our Scope 1 emissions decreased by 31,434 metric tons as compared to 2021. This change was driven primarily by improvements in process emissions as well as production
Scope 2 (market-based) emissions decreased 70,942
metric tons as compared to 2021.
reductions. Our Texas sites, impacted by 2021’s Winter Storm Uri, required less energy in 2022.
In 2022, our Scope 2 (marketbased) emissions decreased by 70,942
metric tons as compared to 2021. This change was driven primarily by a reduction in production and the procurement of renewable energy by some of our sites in China.
In addition to our operational emissions, we aim to engage our top suppliers and service providers, including transportation-related providers, on efforts to reduce emissions through our value chain. Our aim is that our suppliers and service providers, whom we estimate constitute two-thirds of our non-product use Scope 3 emissions, will establish their own carbon-neutral aspiration by 2027.
We have performed a preliminary estimate of our Scope 3 emissions. Due to our portfolio moves to become an increasingly downstream and differentiated chemical enterprise, Scope 3 emissions constitute a significant portion of our lifecycle greenhouse gas emissions. The graphic below highlights the significance of both our upstream and downstream Scope 3 emissions relative to our Scope 1 and Scope 2 operations emissions.
Our Scope 3 emissions for 2022 are estimated to be approximately 7 million metric tons of CO2e, with a P90 to P10 distribution of 6.35 million to 7.80 million metric tons, respectively.
This figure was determined based on an analysis of nearly 90% of our top raw material purchases and extrapolated to our entire portfolio for Category 1 of our Scope 3 inventory. For the remaining Scope 3 categories, we performed a statistical analysis using various estimation methods applied to the Chemical Sector and scaled those methods to our 2022 levels of capital investment, operational energy demands, and employee data. This approach accounts for uncertainties in various estimation methodologies and emissions factor assumptions.
The graphic below shows the results of this analysis across all Scope 3 categories.
The table above shows the P90, Mean, and P10 for each of the estimated Scope 3 categories based on our stochastic analysis. The graph below illustrates the largest components of our Scope 3 estimate and where the potential areas are for further investigation and narrowing
of uncertainties, namely Category 1 (Purchased Goods and Services), Category 12 (Disposal of Products), and Category 4 (Upstream Transportation). Categories 10 and 13 thru 15 are not relevant to our business and have not been calculated.
Our Rotterdam site has extended its electricity contract to buy certified green electricity for Huntsman and third parties at the site. The total savings per year is approximately 95,000 tons CO2 e, of which 80%, or approximately 75,000 tons is attributable to Huntsman. These reductions are Scope 2, primarily CO2
A few of our sites located in China entered into purchase agreements for hydroelectric power, further reducing our operational emissions. We also lowered our emissions by continuing to improve our process emission losses.
We are in the process of developing options for our low-carbon transition plan and will evaluate those options based on a myriad of factors including, but not limited to:

• Pace of technology
• De-carbonization of electricity supply and transportation
• Carbon capture storage and use
• Public policies, regulations, and infrastructure development
Projects for the transition plan can include but are not limited to:
• Electrification of equipment (e.g., boilers)
• Steam recycling for energy
• Replacing fuel oil use with natural gas as infrastructure becomes available
• Working with steam suppliers on plans to reduce or eliminate carbon from steam generation
• Procuring renewable electricity
Our initial broad plan is informed by our operational greenhouse footprint as illustrated in the graphic at top right.
More than 70% of our operational emissions are the result of purchases of third-party steam and electricity. Nearly all our top third-party energy suppliers have decarbonization goals and net-zero aspirations. In the near-term, we will engage our third-party energy suppliers to better understand how their decarbonization goals and aspirations relate to the specific assets supplying energy to our operations.
We plan to continue to explore options to procure renewable electricity, as we have done in Rotterdam, some of our other European sites, and in China. We will continue to see improvements in energy efficiency in both our Scope 1 and Scope 2 emissions with continued renewal of our assets.
Longer-term, we plan to explore options for electrification of our Scope 1 emissions combined with sources from either renewable energy or carbon capture and storage.
Our plan is further informed by how our operational footprint is distributed across our global sites as illustrated in the graphic at lower right.
Ten of our sites constitute more than 80% of our operational emissions. Therefore, we expect our plans to focus on these sites in the near-term.
Scope 1 - Process
Scope 1 - Fuel
Scope 2 - Electricity
Scope 2 - Steam
The Task Force on Climate-related Financial Disclosures (TCFD) helps companies understand what financial markets want from disclosure to measure and respond to the effects of climate change.
Huntsman committed to adopt and disclose according to the TCFD framework in our 2020 Sustainability Report. For the first time, we are providing an index which provides the location of Huntsman’s information related to the TCFD framework, categorized by Governance, Strategy, Risk Management, and Metrics and Targets.

Our manufacturing operations require large amounts of energy to power processing units, machinery, and nonmanufacturing facilities. Our primary energy sources are purchased natural gas for non-feedstock fuel to power on-site processing units and generate steam, purchased steam generated offsite, and purchased electricity generated offsite. Our energy comes from both non-renewable and renewable sources. Energy consumption can contribute to water demand and air emissions. Reduction in energy demand results in financial savings and fewer environmental impacts.
Huntsman is committed to energy efficiency, and our Horizon 2025 goals include a target to reduce energy intensity by 10% from 2019 by 2025. Working toward this goal also supports our greenhouse gas and water reduction targets.
We continually evaluate energy usage at our sites, including identifying opportunities to improve the efficiency of steam and electricity generation, heat requirements, and production processes. Improvements can come in the form of renewal of our equipment at its end of life with higher energy efficiency replacements and targeted investments to reduce energy consumption. We have also engaged electricity providers regarding the procurement of renewable electricity to lower the carbon footprint of our operational emissions.
Our sites measure and report energy consumption, including the type of energy consumed for on-site operations, as well as purchased electricity, heating, cooling and steam, energy generated but not consumed, and energy sold.
All forms of energy are converted to gigajoules (GJ) by using standard conversion factors and applying

Our calculation for energy consumed is as follows:
assumptions to the energy content of purchased fuels if not provided by the energy supplier. In calculating energy consumption from fuels and biofuels, we use higher heating values (HHVs), also known as gross calorific values (GCVs), which are directly measured (when available), or we apply heat values from the Greenhouse Gas (GHG) Emissions Calculation Tool provided by the Greenhouse Gas Protocol and WRI. We use well-established conversion factors to convert both heating values and watts to joules. Energy consumed is divided by sold production to determine intensity.
We determine our energy intensity, using sales of production in metric tons as our denominator. Our energy intensity measure includes all types of energy for our operational emissions (Scope 1 and Scope 2).
In 2022, our energy consumption intensity increased by 0.73 gigajoules per metric ton of sold products as compared to 2021. Despite a reduction of in absolute energy demand, our sales of product dropped by a larger percentage,
resulting in an overall increase in our emissions intensity. This is primarily due to baseload energy demand that does not fluctuate with lower production.
We continually aim to reduce the energy required for our operations. Examples of reductions achieved in 2022 include:
• Process and catalyst improvements to reduce the energy required for carbonates production
• Use of incinerator waste heat to provide heating for offices and labs in Petfurdo, Hungary
• A series of optimization projects to reduce energy and waste at our Shanghai MDI facilities
• Optimization of compressor operating pressures at Azeglio to improve energy efficiency
Reductions in energy requirements of our products and services are not applicable to Huntsman, as we are a provider of chemicals used in products.
The following tables show energy consumption within Huntsman.

Beginning in this year’s report, Huntsman has begun estimating Scope 3 emissions, including emissions related to energy consumption along our value chain. Our preliminary estimate of energy consumption along the value chain is 109 million GJ for Category 1, Purchased Goods and Services. With Category 1 likely representing 85%
of all Scope 3 energy demand, by extrapolation, Scope 3 energy demand may be around 128 million GJ with P90 to P10 confidence range of 115 to 141 million GJ based on the distribution seen in our Scope 3 emissions modeling. Over time, we will refine this estimate and provide further details by Scope 3 categories.
Water quality is an important issue for Huntsman as a responsible member of the communities in which we operate. We recognize that water is a shared resource. Plans for water usage, including consideration of broader community and industrial water needs, are developed at the site level in line with regulatory permit conditions and local regulations.
Our Horizon 2025 targets include a 5% reduction in net water usage intensity at facilities in water-stressed regions of the world, per unit of production. Working with a leading international consulting firm, we completed an updated global water study, following our previous study commissioned in 2014. Utilizing two leading water risk models (World Wildlife Fund’s Water Risk Filter, and World Resources Institute’s Aqueduct model), we evaluated multiple drivers of water stress, including baseline water stress, scarcity, flooding, drought, quality, ecosystem services, seasonal variability, biodiversity importance, groundwater table decline, and governance.
Focusing on three drivers—baseline water stress, drought risk, and overall basin risk—and considering trends in average annual net water usage, we identified sites considered to be operating in water-stressed regions.
We calculate water consumption as:
In
4.3% 1.23
cubic meters (m3) per ton of sold product, or
higher than our 2019 baseline.
All facilities are encouraged to incorporate the results of the study and to assess their site-specific profile as they consider potential water risks relative to their location with the intent to increase resilience and improve long-term planning.
Water can be withdrawn from multiple sources. Most of the water that we use is withdrawn from surface water sources, including lakes and rivers.
We recognize that withdrawal and discharge sources typically differ, and that consumption is more precisely tracked by considering withdrawals and discharges for individual aquifers. We do not currently track data at this level of detail.
Our water withdrawal includes water purchased from third parties. We do not include water use at smaller facilities, such as leased offices, due to materiality.

2022, our water consumption in regions of water-stress intensity was
Our EHS Management System includes standards and procedures for the management of effluent water quality at our sites.
All manufacturing sites are required to report multiple effluent water quality metrics, including organics, inorganics, solids, and others. We are complying with—and, in many cases, exceeding—increasingly strict water quality standards. We understand the connection between water quality and water scarcity. Keeping water clean goes together with the efficient use of water.
In the accompanying tables, our chemical oxygen demand (COD) indirectly measures the quantity of organic compounds in water. COD is a laboratory test to determine whether a specific wastewater will have a significant adverse effect on fish or aquatic plant life. We use COD as a broad measure of the effects that our effluent will have on a receiving water body. COD accounts for the highest proportion of our water loads. We consider COD our primary measure for substance of concern from our effluents.1
In 2022, our water discharge intensity was higher by 9.7% as compared to 2021. Despite absolute COD amounts declining by 230 metric tons, intensity increased because of a combination of a change in custody transfer upstream of
effluent treatment at our Rotterdam facility and a decrease in production as an enterprise.
Our effluent standards are determined on a site-by-site basis based on local permits or regulations. Noncompliance is deemed to occur if a site has exceeded permit or regulatory limits. In 2022, we had 4 incidents of non-compliance involving water discharges exceeding COD limits of a discharge permit.1
In 2022, our water discharge intensity increased by 9.7%
as compared to 2021.
The following is a list of our sites operating in regions that we have determined to be water stressed.
The following table shows water withdrawal, discharge, and consumption for Huntsman in total and for those regions of water stress in which we operate.
1 The 2021 report figures were in cubic meters. This caused the amounts of megaliters to be overstated by a factor of one thousand. The prior year amounts have been correct to megaliters.
In 2022, our total water consumption decreased by 466 ML and our total water consumption intensity was higher by 0.11 m 3 per metric ton of product sold as compared to 2021. The decrease in absolute water consumption was driven primarily by a change in custody transfer point upstream of effluent treatment at our Rotterdam facility. Despite the reduction of water consumption, the percentage decrease was less than our change in enterprise production, resulting in an increase in water consumption intensity.
In 2022, our water consumption in regions of water stress increased by 114 ML, and the intensity of water consumption
in regions of water stress increased by 0.37 m 3 per metric ton of product sold as compared to 2021. These changes were driven by lower production at our Wilton site which produces aniline (a net contributor of freshwater outflows), higher production at our Freeport, Texas site, and partially offset by the installation of new and improved water valves at our Conroe, Texas site to better manage water intake. Water storage has not been identified as having a significant water-related impact. In last year’s report, water figures were reported in cubic meters. They are now reported in megaliters.
1 “Freshwater” is defined as water with less than or equal to 1,000 mg/L of total dissolved solids (TDS).
2 “Other Water” is defined as water with greater than 1,000 mg/L TDS.
3 “Not measured” is defined as water whose TDS was not measured.
4 The 2021 report figures were in cubic meters. This caused the amounts of megaliters to be overstated by a
factor of one thousand. The prior year amounts have been corrected to megaliters.
“na” = not applicable
In addition to greenhouse gases, our manufacturing operations may produce air emissions, including volatile organic compounds (VOCs), hazardous air pollutants (HAPs), particulate matter (PM), persistent organic pollutants (POPs), nitrogen oxides (NOx), and sulfur dioxides (SOx). As with greenhouse gases, these emissions typically stem from the combustion of fuels and the processing of feedstocks.
Huntsman faces operating costs, regulatory compliance costs, regulatory penalties in the event of non-compliance, and capital expenditures related to emissions management. Our related financial impacts will vary depending on the magnitude of emissions and the prevailing regulations. We
The following table shows the total non-greenhouse gas emissions to air for 2021. VOCs and HAPs are based on the U.S. Environmental Protection Agency (EPA) data. Certain VOCs are classified as HAPs. “Particulate Matter Other” was not measured and could potentially be categorized as either Particulate Matter < 10 or Particulate Matter < 2.5.
actively manage air emissions to mitigate their impacts and to improve our environmental and financial performance.

Huntsman monitors, tracks, and reports chemical emissions to the atmosphere—whether specifically permitted, part of routine operations, or the result of accidental releases. Quantification methodologies include either direct measurement or estimation. Our estimations may be based on emission factors, models, material balance, engineering judgment, or other appropriate methods. We follow local government calculation methodologies, where available, when the data is already calculated for submittal to local government.
We do not emit ozone-depleting substances (ODS).
| 305-7 | SASB RT-CH-120a.1 |In volumes and intensity, as measured by emissions per metric ton of sold production
In 2022, our non-GHG emissions increased by 303 metric tons as compared to 2021.
Non-GHG emissions intensity increased by 36% as compared to 2021.
In 2022, our non-GHG emissions increased by 303 metric tons and non-GHG emissions intensity increased by 36% as compared to 2021. Absolute increases in non-GHG emissions were driven by increased releases at Geismar offset by decreases in nitrogen oxide emissions at Wilton. Intensity increased due to both the increase in absolute emissions and lower enterprise production.
In 2022, our NOx emissions decreased by 83 metric tons as compared to 2021.
NOx emissions intensity increased by 2% as compared to 2021.
In 2022, our NOx emissions decreased by 83 metric tons and NOx emissions intensity increased by 2% as compared to 2021. NOx emissions decreases were driven primarily by lower production at both our Geismar, Texas and Wilton, UK sites. Despite the lower absolute volumes of NOx emissions, production was lower across the enterprise resulting in an increase in NOx emissions intensity.
Nitrogen Oxides (NOx) Emissions & Intensity
|
|
In 2022, our SOx emissions increased by 3 metric tons as compared to 2021.
In 2022, our SOx emissions increased by 3 metric tons and SOx emissions intensity increased by 56% as compared to 2021. Our Sox emissions have decreased by a factor of ten times because of switching from distillate fuel oil to natural gas consumption at a few of our sites. The increase from 2021 to 2022 was driven entirely by an increase at our Baroda, India site, which was divested in 1Q23 as part of our Textile Effects sale.
RT-CH-120a.1 |
Our manufacturing operations generate both non-hazardous and hazardous waste. These wastes include but are not limited to heavy metals, process wastewater, residual gas and liquids from processes, and wastewater sludge. Our management of waste must consider regulations that govern the generation, transport, treatment, storage, and disposal of waste materials. Reducing waste generation delivers financial savings and also decreases environmental impacts, risk from remediation liabilities, and the potential of regulatory penalties.
Huntsman’s waste management strategy includes, in preferred order: elimination and minimization of waste generation through process design, plant operations and maintenance; recycling and reuse of usable materials to eliminate or reduce waste hazards and volumes. Incineration or disposal of wastes in landfills is considered only after all other options have been exhausted.
In addition to managing our operational wastes, Huntsman strives to improve resource efficiency throughout the value chain. For example, our TEROL® polyols use PET waste to create MDI. Downstream, our solutions make products more durable, and by extending the life of our products, they contribute to waste reduction.
Huntsman is committed to resource efficiency in our operations, including preventing and reducing both hazardous and non-hazardous waste. Our Horizon 2025 goals include a target to reduce both our 2019 total waste and hazardous waste intensity by 5% by 2025.
Working to achieve this goal supports our longer-term
aspirations toward circularity. We continually look for ways to reduce waste and improve operational performance. We regularly complete audits to inspect external waste management plans and ensure that our waste is disposed of in accordance with contractual or regulatory obligations.
Examples of waste reduction activities include our Huntsman Textile Effects plant in Mexico where a wastewater improvement project enabled a 50% reduction in our solid waste disposal. Another example is our Huntsman Performance Products site in Llanelli, where the installation of new aeration in a reed bed system allowed for passive treatment of effluent in an environmentally friendly manner and reduced the amount of waste incinerated.
Our sites measure, confirm, and report hazardous and nonhazardous waste volumes generated, volumes and types of recovery operations used for waste diverted from disposal, and volumes and types of disposal operations for wastes directed to disposal for on-site operations. Some waste diverted from disposal is incinerated in an energy recovery process that provides heat for other processes, reduces additional fuel required, and lowers impacts to the environment. All forms of waste are converted to metric tons, using standard conversion factors. Waste volumes generated are divided by sold production to determine intensity.
In 2022, our total waste intensity was 0.1277 tons per ton of sold product, or 52% lower than our 2019 baseline. In 2022, our hazardous waste intensity was 0.0306 tons per ton of sold product, or 3% higher than our 2019 baseline.
The following tables show the diversion of waste from disposal and waste directed to disposal, along with the percentage of hazardous waste recovered. All figures exclude effluent, unless required by national legislation to be reported under total waste. Waste is categorized as hazardous waste, non-recycled hazardous waste, or recycled hazardous waste in accordance with local regulations.
Sites using on-site deep well injection, incineration, or composting are cases where waste is disposed of directly by the organization. In most other cases, waste disposal is provided by third-party vendors. Disposal methods are known from the disposal sites used or from methods listed on manifest documentation.
The large increase in non-hazardous waste and total waste from 2018 to 2019 was driven by a change in the classification of water discharge to a new, on-site deep injection well at our Freeport, Texas, site. Based on U.S. regulations and permits, underground injection volumes are considered waste. Previously, these volumes had been sent to a third-party wastewater treatment facility and reported as water discharges.
In 2022, our non-hazardous waste was 228,133 metric tons, 45,974 metric tons lower than 2021. This change was
In 2022, our non-hazardous waste was
driven by the end of a major project and lower production at our Geismar, Louisiana site, along with closure of our Ternate, Italy site, offset by higher volumes of non-hazardous recycling at both our Modena, Italy and Obninsk, Russian Federation sites.
In 2022, our hazardous waste was 71,967 metric tons, 9,771 metric tons lower than 2021. This change was driven by an increase in hazardous waste sent to recycling in our Turkish operations.
In 2022, our hazardous waste was
metric tons, a decrease of
45,974
228,133 metric tons compared to 2021.
We measure our waste intensity by using sales of production in metric tons as our denominator. Our energy intensity measures include all waste recovery operations and disposal methods.
In 2022, our total waste intensity decreased by
0.002
metric tons of total waste per ton of sold product as compared to 2021.
71,967 metric tons compared to 2021.
metric tons, a decrease of
9,771
In 2022, our total hazardous waste intensity increased by 0.001
as compared to 2021.
Products and solutions from the chemical industry are in 95% of all goods manufactured and sold in our economy. Because of the enormous role chemicals play in the materials used in the global economy, the chemical industry has a huge role to play in circularity.
Huntsman can impact circularity across the entire value chain. As mentioned previously in this report, our TEROL® polyols use polyethylene terephthalate (PET) waste. We are also moving into new areas of circularity, including our recent purchase of bio-based benzene for MDI production. Downstream, our solutions make products more durable, and contribute to waste reduction by extending the life of products.
Huntsman is committed to managing and improving our resource efficiency, and to stimulating the circular economy by improving the recyclability and durability of our products and driving innovation based on sustainability criteria.

We use recycled or bio-sourced packaging materials when it makes technical and economic sense to do so.
Additionally, our customers have signaled increased
interest in how Huntsman products can assist them in making their products more circular. As mentioned in our Long-Term Goals, Huntsman has set an aspiration to become a circular company. As a first step toward that aspiration, Huntsman will begin to capture measures of circularity for our solutions, including:
Our Horizon 2025 goals for improving energy efficiency, reducing water intensity, and decreasing waste intensity are part of our strategy to become more circular.
• Recycled content
• Bio-sourced content
• Recyclable content
• Biodegradable content
• Resilience (e.g., durability) content

Maintaining a safe and ethical work environment for our people and for the communities where we live and work is paramount to our business. Our talented and diverse teams around the world are our greatest strength. Our energized and passionate professionals bring fresh perspectives and create new solutions to enable Huntsman to continue enriching lives through innovation.

Management of the Topic | GRI 3-3 |
Work-related hazards that pose a potential risk of highconsequence injury include hazards inherent to nearly all companies across the chemical industry, and they range from major events (such as exposure to toxic releases, fires, and explosions) to routine activities (such as confined space entries, working from heights, or lifting heavy objects). When the combination of associates and contractors is considered, the most common types of work-related injuries are abrasions, lacerations, sprains, and strains.
We aim to continually improve our safety performance for all associates and contractors, and are committed to eliminating life-impacting injuries and fatalities.
We track our performance, using the U.S. Occupational Safety and Health Administration (OSHA) Total Recordable Incident Rate (TRIR), for both injuries and illnesses,

inclusive of our contractors. Additionally, we track Life-Impacting or Fatal Event (LIFE) occurrences, and we are committed to eliminating these incidents and to continuously reducing our Total Recordable Incident Rate as part of our Horizon 2025 targets. Our systems to manage workforce health and safety are described in further detail in the following sections.
Our Environmental, Health, and Safety (EHS) Policy and Commitment encapsulate our vision to prevent all harm through achieving excellence in EHS performance in all aspects of our business.
(No. of injuries and illnesses x 200,000)
Total hours worked
OSHA TRIR
Huntsman has implemented an Environmental, Health, and Safety (EHS) Management System to support implementation of the requirements, consisting of:
7 standards 70 procedures
105 guidance documents
This management system is based on principles of various recognized management system standards, such as Responsible Care®, ANSI/ASSP Z10.0-2019, and CFR 1910.119 Our standards and procedures apply to all Huntsman-owned-and-operated facilities and corporate functions. They do not apply to joint ventures (JVs) in which Huntsman is a minority owner or to third-party warehouses and tollers, unless requested by a member of the EHS leadership team.
For Huntsman facilities located in the United States, Huntsman has implemented its Responsible Care® program to supplement existing EHS management systems to enhance performance and improve the safety and health of our employees, the communities in which we operate, and the environment.
The EHS Management System outlines the methods used to identify work-related hazards and assess risks. Guidance documents and procedural requirements outline the Hierarchy of Controls. These methods include pre-job safety inspections, job safety analyses, and work permits (including permitting for hot work, confined space entry, and work at height).
All manufacturing sites conduct Process Hazard Analysis (PHA) and Fire Risk Analysis (FRA) of their facilities to identify process and fire-related hazards and determine where additional layers of protection are needed to ensure the health and safety of people and protection of the environment.
The process for a work-related incident investigation is outlined in our EHS Management System—specifically, EHS-106: Incident Investigation. Based on the severity and likelihood of the outcome, a 5-why methodology may be used for “lower-severity” incidents, while those of a higher consequence require the use of Apollo root cause analysis.
Our industrial hygiene (IH) teams continuously identify potential health hazards, assess risks, and implement controls—as outlined in our EHS Management System. All sites complete IH risk assessments, and, in 2018, Huntsman standardized how sites conduct risk assessments that are used to develop annual sampling plans to quantify exposures. Exposure monitoring results are compared to published occupational exposure limits to confirm that existing controls are adequate.
To reduce potential exposure to both acute and chronic health hazards, our sites incorporate the Hierarchy of Controls, starting with elimination (if possible), substitution, engineering controls (enclosing, containing, isolating, automating, and minimizing dispersion or tools to avoid direct contact), administrative controls, and, lastly, personal protective equipment. As new controls are implemented, exposures are reassessed to keep workers safe.
The organization assesses the quality of the processes and the competency of the persons carrying out the tasks through site self-audits, corporate EHS and process safety audits, and competent person assessments (for activities related to Process Safety Management). Additional requirements for training and competency are described in the EHS Management System—specifically, EHS-113: Training and Competency.
Sites use the results of self-audits to make site-based improvements. The results of the corporate EHS and process safety audits are used to make both site-based and company-wide improvements. Competent person assessments are used to identify additional training and skill improvement opportunities.
Associates are encouraged to report work-related hazards through incident reports, near-miss reports, and 60-second checks, as well as any additional methods that individual sites have implemented.
All Huntsman associates have stop-work authority for situations when they feel there is a danger to themselves, their co-workers, or the public. Associates are protected from retaliation by the company’s code of ethics, along with a robust series of Human Resources (HR) policies and procedures.
Huntsman ensures that occupational health services are provided for employees under the guidance of the Global Director of Occupational Health, a board-certified medical doctor. Each site contracts with either an on-site medical provider or with a local medical provider to ensure prompt access to occupational health and medical services when needed.
The sites adjust their workload to ensure that the services are available to associates as required.
The company has processes to protect worker privacy under U.S. Health Insurance Portability and Accountability Act (HIPAA) and EU General Data Protection Regulation (GDPR) practices—specifically, EHS-505: Health Record Management and Confidentiality.

Huntsman includes worker participation in the development, implementation, and evaluation of the EHS Management System by having site-based personnel involved and consulted with on the development of new corporate requirements and on the updating of existing requirements.
Certain individual site-based personnel are directly involved in the rollout of new and updated requirements via webinars, face-to-face trainings, and other communication packages, contingent on the extent of the update.
Sites are expected to have frontline associates directly involved in the development
of EHS practices and programs (for example, developing formal job safety analyses).
Where formal joint management–worker health and safety committees exist, the responsibilities, decision-making authority, worker representation, and frequency of meetings are based on local laws and negotiated contracts.
a corporation.
The hazards in the workplace are communicated by making safety data sheets that are readily available for all raw materials, products, and intermediates. Workers have access to process hazard information through readily available Process Hazard Analyses.
Huntsman values input from sites to continue to improve EHS practices as| GRI 403-4 |
| GRI 403-5 |
Training requirements for associates are outlined in the EHS Management System— specifically, EHS-113: EHS Training and Competency. Several corporate-level training programs exist to provide a high-level overview including a requirement for everyone to complete a training course called “Why EHS Matters,” which prominently features Chairman, President, and CEO Peter Huntsman discussing the importance of EHS to the company and all associates. Our sites are required to develop training matrices for their operations to ensure competencies and safe work practices. The effectiveness of these programs is assessed through corporate EHS and process safety audits.
Huntsman has a corporate EHS Center of Excellence that assists our sites in providing training to ensure safe work practices and compliance with local regulatory requirements. Tasks identified as “EHS critical” require routine operator drills to ensure our capabilities for proper and timely responses.
| GRI 403-6 |
Huntsman provides benefits to employees, including healthcare coverage. The type of coverage is dependent on the plan available to associates in the area where they live.
Huntsman provides benefits to employees, such as employee assistance programs and voluntary health promotional programs. Certain individual sites have developed comprehensive health and wellness promotional programs to encourage health and well-being.
| GRI 403-7 |
Huntsman has developed an EHS Management System that incorporates aspects of occupational health, occupational safety, environmental safety, product EHS, and process safety management.

Huntsman’s corporate product safety team has developed procedures for product hazard identification, hazard communication, risk assessment, and risk management—specifically, EHS-701: Chemical Hazard Communication, EHS-702: Product Stewardship, EHS-703: Product Risk Assessment, and EHS704: Distribution Risk Management.
The goal of these programs is to prevent (or mitigate) the impacts that are directly linked to its operations, products, and services. Huntsman
All sites are subject to internal audits. External audits are conducted as part of our Responsible Care® commitment.
All our associates and contingency workers are covered by these systems, as are contractors, with limited exceptions that consist primarily of contractors at our independent work sites, as determined by our guidance, and those
individuals who are on our sites temporarily who do not materially interface with our operations and/or over which we do not exert material control over their working conditions or determine their work process.
| GRI 403-9 | GRI 403-10 | SASB RT-CH-320a.1 |
1 Full-time, part-time, contract and temporary workers are included
2 Also called a Life-Impacting or Fatal Event (LIFE), a work-related personal injury or illness that meets defined severity criteria due to its impact on the quality of the affected person’s life, whether temporary or permanent.
Huntsman has issued detailed guidance on reporting metrics and definitions in EHS-1109A: EHS Metrics Reporting Methodology. All Huntsman-owned-and-operated sites report associate and contractor exposure hours through an electronic EHS database. Any incidents that meet corporate reporting requirements are reported by the sites through an electronic EHS database, with corporate support and oversight. Data collected in the EHS database is reported and
distributed company-wide on a monthly basis through the Global EHS Scorecard. Injuries and illnesses are categorized according to internal guidance documents, based on U.S. OSHA standard 29 CFR 1904.7. Additionally, injuries and illnesses are documented as required by the laws in the areas where we operate.

Actions taken to address work-related hazards are addressed in section GRI 403-2.
From 2021 to 2022, our Total Recordable Incident Rate (TRIR) increased from 0.38 to 0.47. Leading contributors to work-related illness include noise, manual handling/ergonomics, and mental health (work related stress, depression, or anxiety).
The chart below shows our TRIR trend from 2018–2022. From 2017 through 2020, Huntsman’s TRIR has been below the American Chemistry Council’s Responsible Care® benchmark for Medium-Sized Companies and based on the U.S. Bureau of Labor Statistics, NAICS 325000 – Chemical Manufacturing.
All LIFE incidents are formally investigated with corrective actions taken to reduce or eliminate work hazards, using the Hierarchy of Controls.
Examples of these corrective actions include performing a global review of the use of rotating equipment to eliminate the use of these machines where possible. Huntsman also revised corporate machine guarding requirements to include more stringent administrative controls, such as revised training requirements and more frequent inspections of
equipment in areas of high use (e.g., maintenance workshops and laboratories).
Huntsman has further introduced global risk tolerance training to all personnel to identify why and where our personnel take risks, and to help address line of fire, hazards, and overexertion. For more information on actions taken to address LIFE incidents and other hazards, see reference to GRI 403-2 and the discussion on process safety.
For 2022, we had no LIFE incidents.
Technical failures, human errors, or external factors can lead to loss of primary containment at our manufacturing facilities or during transportation of our products. Failures and errors, in addition to loss of primary containment, could lead to fires and explosions, given the nature of our manufacturing operations.
We see process safety as critical to assuring our facilities are safe and working as intended, and that our products are properly stored and transported.
Process safety risks are managed though several means, including:
• Applying inherent safety principles in all processes and in our equipment
• Design process
• Designing and installing engineered independent protection layers
• Using procedures and training to assure operating competency
• Utilizing proper personal protective equipment
As the figure to the right illustrates, we start with the most effective risk mitigation strategy, which is to eliminate the risks, and then we work through subsequent mitigation strategies to continually improve the safety of our operations.
Elimination
Physically remove the hazard
Substitution
Replace the hazard
Enginering controls
Isolate people from the hazard
Administrative controls
Change the way people work
Protect the worker with Personal Protective Equipment (PPE)
Our Process Safety Standard EHS-400 outlines global requirements to identify and manage risks associated with process safety incidents and how they may impact the environment.
Process Hazard Assessment (PHA) procedures identify process safety hazards and the appropriate safeguards to prevent or mitigate impacts to the environment from loss-of-containment events.
As we strive for continual improvement in process safety, we have placed considerable focus on improving process safety culture. The chemical industry has recognized the importance that culture plays in determining the overall success of a process safety management program. In an organization, with a positive process safety culture, there exists a high degree of trust and transparency at all levels of the
organization, coupled with highly effective management systems. Huntsman has developed a series of process safety cultural leadership workshops to align process safety core values and behaviors from the executive level to the frontline worker level. Workshop participants develop a personal action plan that drives sound process safety principles and practices, provides clear leadership actions and behaviors required to move the culture toward operational excellence, and instills an understanding and passion for their role in process safety management systems.
Process safety performance is based on API RP 754: Process Safety Performance Indicators for the Refining and Petrochemical Industries. The API RP 754 standard provides a consistent means of evaluating process safety performance across the industry.
1 2
Total Associates and Contractor Hours Worked (Tier 1 + Tier 2) x 200,000
Our 2025 Horizon Goals include the aim for no Tier 1 Process Safety Incident Counts and Tier 2 Process Safety Incident Rate of less than 0.15.
We also track the Process Safety Incidents Count (PSIC) and calculate a Process Safety Incident Severity Rate (PSISR), which is defined as the
cumulative (annual) severity-weighted rate of process safety incidents and is calculated as:
Total Severity Score for all PS Incidents x 200,000
Total Associates and Contractor Hours Worked PSISR
We began collecting the PSISR for Tier 1 events in 2019. In previous years, this data was not tracked. Information around the root cause and corrective
actions implemented is maintained at the local site level and is not currently tracked for corporate reporting.
We track chemical releases and
spills at a corporate level across all Huntsman-owned-and-operated facilities.
A Tier 1 event is defined as a loss of primary containment (LOPC) with the greatest consequence.
A Tier 2 event is defined as a loss of primary containment (LOPC) with lesser consequence.
From 2021 to 2022, our Tier 1 count increased from 6 to 7, and our Tier 1 incident rate increased from 0.053 to 0.063. Our Tier 2 count decreased from 13 to 6, and our Tier 2 incident rate decreased from 0.114 to 0.054.
From 2021 to 2022, our Process Safety Incidents Count
increased from 6 to 7, and our Process Safety Total Incident Rate increased from 0.05 to 0.06 and Process Safety Incident Severity Rate increased from 0.05 to 0.13.
The following tables show our transport incidents and significant distribution incidents.
The table to the right presents incidents that resulted in chemical spills or loss of material from primary containment that Huntsman has classified as significant. A spill is defined by GRI as “an accidental release of a hazardous substance that can affect human health, land, vegetation, water bodies, and ground water.” We designate a spill as “significant” when the spill is not specifically allowed by a government-issued authorization such as a permit, license, or consent, and when the spill is not contained on site. Air emission incidents and volumes are tracked under Air Emissions.
Our 2022 incident count was 2, which was a decrease from 6 in 2021. Volumes released in 2022 were 1,810 pounds, down from 29,709 pounds in 2021. The 2022 incidents included a reactor overpressure resulting in release though the pressure relief vent valve to atmosphere at our Los Angeles site and an unscheduled power outage at our Conroe, Texas site causing the cooling tower basin to overflow and drained to a stormwater ditch. The storm water discharge value leaked resulting in non-stormwater to discharge directly to a surface water body.

At Huntsman, we believe it is our responsibility to make a difference in the lives of others in our communities.
We support a variety of social causes that follow the United Nations Sustainable Development Goals, including:
• Good Health and Well-Being
• Quality Education
• Reduced Inequalities
• Zero Hunger
• Zero Poverty
• Clean Water and Sanitation
We encourage personal involvement from our employees, and focus on helping those within our communities. Examples of our investment of Huntsman resources in our local communities can be found in the Communities section of this report.

The Responsible Care® program helps member companies elevate the safety of their employees, support local communities, and protect the environment—all while
enhancing operational performance.
At our major sites, we participate in community advisory panels (CAPs) and local emergency planning committees (LEPCs). We also engage with local first responders. Where applicable, we engage with local work councils and other labor organizations.
In addition to the CAP and LEPC forums, our community outreach efforts include our corporate crisis plan and our site emergency response plans, which outline our engagement in the event of an incident or crisis. As a Responsible Care® company, we also operate a 24/7 Care Line phone number at our company headquarters that community members can call to report concerns. Communities can also access our website for information on our facilities and operations.
We monitor the effectiveness of our community engagement through feedback we receive from our CAP and LEPC activities, as well as through social media monitoring and website analytics. Please refer to Stakeholder Engagement in this report.
Details regarding our operating locations can be found on our website at Huntsman.com/locations.
We are also committed to strong community relations where we operate. We are a founding member of Responsible Care®, the industry’s environmental, health, safety, and security performance initiative.

Product stewardship demonstrates our commitment to the safe handling of potentially hazardous chemicals at every stage of their life cycles, from the sourcing of raw materials, through manufacture and use, to eventual disposal.
At Huntsman, product stewardship is an integrated process for identifying, managing, and minimizing the environmental, health, and safety impacts at every stage of a product’s life cycle. Our commitment to safer and more sustainable products enhances public confidence, keeps our customers and consumers safe, and ensures our reputation as a responsible and sustainable company.
Huntsman regularly evaluates its products for substances of concern throughout the life cycle to help with future portfolio planning and prioritization of R&D efforts to support the development of alternative chemicals as required to meet regulatory and market demands.
The Substances of Very High Concern (SVHC) list under REACH is one of the widely recognized lists specifying substances of concern that presents current and future potential risk of regulatory action.
We implement strong product stewardship programs to ensure that all products we make can be safely transported, stored, and used by our customers.
To this end, we have several active programs addressing the use of SVHCs across our businesses.
Products are considered on a case-by-case basis, including assessing the use of the substance, along with existing and potential risk management options, ease of substitution, and product benefits. We work with regulators, customers, suppliers, and value chain partners to make these assessments and to develop suitable risk mitigation plans that could include phase out, reformulation, or development of alternatives.
We evaluate new product developments against defined Substances of Concern (SoC) lists at various stages in the development process, including at stage gate reviews. Our Product EHS teams have developed an SoC risk evaluation tool specifically for this purpose. Our R&D teams look for SoC issues at all stages of the development process as part of the selection of the preferred technical solution and when screening new raw materials from suppliers. A formal hazard assessment is completed by our Product EHS teams during the new product introduction process. Products with significant SoC impact may be eliminated or new product development projects terminated based on an SoC assessment or if the business case for further development is not viable. In some cases, if there are no viable or sustainable alternatives, we may still choose to launch a product that contains SoCs, which may require regulatory approval and be either manufactured or used under strictly controlled conditions. Huntsman safety data sheets (SDSs) are available in multiple languages and accessible to all registered Huntsman customers on our online service portal. Customers can access product safety information through multiple channels, including:
• Sales contacts
• Division-specific online service portals, such as Texnet for Textile Effects
• Contact links at our website: Huntsman Contacts
Huntsman associates are trained on product safety, relevant to their roles and responsibilities. Designated product stewards are equipped to train associates, customers, distributors, and transporters.
We offer our customers training on Huntsman’s product stewardship, along with in-depth training on safety data sheets, regulatory compliance, and safe use of products in customer applications.
The safety of our associates, business partners, customers and consumers is our top priority.
Huntsman has over 30,000 finished products and raw materials that are sold or used. We evaluate our products, using our New Product Introduction process or our Hazard Communication processes.

One example of how Huntsman continually reviews and evaluates our substances for improvement is through our Registration, Evaluation, Authorization and Restriction of Chemicals (REACH) review process. We are required to update REACH dossiers for certain substances in our portfolio every year, due to reviews conducted by the European Chemicals Agency (ECHA), based on new evaluations or new health science data.
In 2022, we updated 39 substances as a part of this mandatory process. We went beyond what was required by ECHA and updated an additional 886 products. Updates included adding use case and exposure scenarios and incorporating advances in science and descriptions for read-across data applicability. In total, Huntsman updated 925 REACH Dossiers in 2022, an increase from 155 REACH dossiers in 2021.
39
886
925
In 2022, we updated more than 70,000 safety data sheets. Roughly 65% of our products contain Globally Harmonized System of Classification and Labeling of Chemicals (GHS) Category 1 and 2 Health and Environmental Hazardous Substances.
The publishing of at least 30 product safety summaries is one of the targets of Horizon 2025, our business strategy for environment, health, and safety (EHS). This target is aligned with the American Chemistry Council’s Responsible Care® initiative. The product safety summaries are not intended to replace the information included on a safety data sheet, product safety label, and other safe use and handling literature for chemical substances.
As of the end of 2022, we have published 20 product safety summaries. A list of the product safety summaries can be found at: Product Safety Summaries
In 2022, we did not identify any incidents of non-compliance with regulations and/or voluntary codes related to health and safety impacts of our products.
All our products are assessed for compliance with labeling regulations. In 2022, we did not identify any incidents of non-compliance with regulations and/or voluntary codes concerting our product information and labeling. Additionally, we did not identify any incidents of non-compliance with regulations and/or voluntary codes concerning marketing communications, including advertising, promotion, and sponsorship in 2022.
The safety of our associates, business partners, customers and consumers is our top priority.
People are the foundation of Huntsman. At Huntsman, we pride ourselves on being a people-oriented organization. Our family-like atmosphere is cultivated by our diverse groups of team members around the world.
We welcome the talent, experience, and fresh ideas that employees at all stages of their careers, from interns to seasoned professionals, bring to Huntsman.
In return, we offer employees the opportunity to become an integral part of a dynamic, industry-leading company, where safety and ethics always come first.
The table below provides a breakdown of our employees by region and gender, and of our contractors by region, based on headcount as of December 31, 2022:
Our policy is to competitively compensate our associates and to appropriately motivate associates to provide value to our shareholders.
Our compensation philosophy is to align both near-term and long-term incentives with our strategic objectives and to consider market forces, best practices, and the performance of our company and our employees. We offer employees benefits that vary by country and are designed to meet or exceed local laws and to be competitive in the marketplace. Examples of benefits offered in the U.S. include:
• 401(k) plan with employer contributions
• Health benefits
• Business travel insurance
• Supplemental voluntary insurance
• Life/disability insurance
• Paid time off
We sponsor several contributory and non-contributory defined benefit plans, covering employees primarily in the U.S., the U.K., the Netherlands, Belgium, and Switzerland , but also covering employees in several other countries. We fund the material plans through trust arrangements (or local equivalents) where the assets are held separately from us. We also sponsor unfunded postretirement plans that provide medical and, in some cases, life insurance benefits covering certain employees in the U.S. and Canada.
| GRI 404-1 |
Huntsman provides associates with training and development to further enhance their professional skills. These training and development courses include topics such as EHS, compliance, soft skills, technical skills, and leadership development.

Huntsman develops associates who are in or will assume supervisory or management positions in the organization to ensure they feel comfortable dealing with employee-related matters, such as setting objectives, career development plans, coaching, and performance management. This training is made available in local languages.
The table to the right shows average annual training hours, by employee category and gender.
| GRI 404-2
At Huntsman, we build a culture of high performance and continuous learning and development. It is important that our associates continue to grow their skills, knowledge, experience, and behaviors which relate to their current and future job requirements.
Huntsman provides a range of learning and development resources through its My Learning & Development portal. Resources include career and learning development
planning frameworks, competency frameworks, performance and development feedback, e-learning, academies, and global training programs.
Employees who retire or are separated from Huntsman are offered support services including career coaching, resume reviews, networking assistance, and interview preparation.
We foster career growth through training, mentoring, and job rotations. Our programs identify and develop employees for future roles by offering courses in language training, personal effectiveness, team management, leadership, and more.
Most eligible associates of Huntsman are, in partnership with their supervisors, required to participate in an annual Performance Development Program (PDP) assessment. In addition, numerous training and development courses are offered to associates, both live and online, with the
| GRI 404-3
intention of developing the soft and technical skills of our associates.
The table below shows the percentage of employees receiving regular performance and career development reviews by employee category and gender.
87%
of employees completed Performance Development Program (PDP) assessments
A diverse workforce stimulates conversation, innovation, creativity, and problem solving. Huntsman unites people from various cultures and backgrounds who offer unique ideas and perspectives that help to build a stronger company. We value our team environment where people treat each other with integrity and respect.

Treating everyone with respect is a company value that applies to each of us. We are committed to creating an environment reflecting the diversity of the communities in which we do business. We make all employment decisions based on job-related qualifications and without regard to race, color, religion, gender, age, disability, national origin, sexual orientation, and any other protected status in each of the countries in which we operate.
This value is reinforced in our Business Code of Conduct and in our Human Rights Policy.
To achieve the objectives of our policies, we:
• Provide guidance and training on compliance with the policy and reporting of any suspected violations
• Encourage reporting of suspected violations of this policy through the same channels established for reports made under the Business Conduct Guidelines
• Investigate suspected violations by a team established by the Corporate Compliance Manager with appropriate corrective or other actions taken
• Periodically conduct a policy audit in accordance with the Corporate Compliance Program audit requirements, and, when necessary, update the policy or its procedures and guidance with respect to its effectiveness. Huntsman may seek an independent audit at any time in any manner that the Nominating and Governance Committee of the Board of Directors deems appropriate
• Report the company’s human rights performance to the Board of Directors on an annual basis (at a minimum)
Director succession for our Board of Directors is a thoughtful, ongoing process at Huntsman Corporation.
Our Board evaluates desired attributes, considering our strategy and evolving needs. As part of our Board’s multiyear director succession and refreshment process that began at the end of 2017, we have added eight new independent directors (including four women, two ethnically diverse directors, and one veteran) to the Board. Four of five Board committees will have women chairs, effective at the Annual Meeting, and our Lead Independent Director and Non-Executive Vice Chair is female.
50% are female directors
Range of Tenures
6.1 years is the average tenure (7 joined in the last 5 years)
Our Board consists of a highly qualified, diverse group of leaders in their respective fields, and is representative of an effective mix of deep company knowledge and fresh perspectives. The following graphic illustrates the diverse and well-rounded range of attributes, viewpoints, and experiences of our 10 directors.
In addition to diversity at the highest levels of the organization, the following table shows diversity in each employee category by gender, age group, and U.S. ethnic minority status:
Mix: 20% of all directors are ethnically diverse
Diverse Mix:
Balance of Mix of Ages 80% are 65 or younger (average age: 61.4)
Global Perspectives
Independent Oversight
Huntsman | 95 2022 Annual Sustainability Report

We aim to advance society while protecting the planet.
Huntsman’s mission is to provide products and solutions, through the application of science, that enrich lives and help create a sustainable future, while doing no harm to people or the environment. From your footwear to your clothes, your cell phone to your home, and your car to the aircraft you board, our products play an important role in making your life safer, cleaner, more efficient, and more convenient.

We see reliability as critical to meeting customer needs, delivering commercial results, and, ultimately, driving the success of our business. Several aspects comprise reliability, including roles and ownership, purchasing, supply chain, and our Manufacturing and Engineering Council.

Plant managers at each of our facilities oversee site operations, and manufacturing leads for each division have accountability and oversight of the operations strategy of the division. We manage logistics, including raw material input and shipments of products to customers as outputs, with a dedicated supply chain group that works closely with corporate purchasing teams that handle raw material purchases and vendor management.
Purchasing plays a key role in reliability. An understanding of our supply chain risks and opportunities is crucial to operations of our site facilities. For example, in 2017, we experienced a significant disruption to parts of our supply chain in China due to shutdowns related to enforcement for non-compliance with environmental regulations. Suppliers were either directly or indirectly impacted with minimal notice. Strengthening our understanding of that part of our supply chain has improved the assurance of our product delivery.
Our sourcing strategies for key materials and services further assure delivery of best-in-class reliability. For example, sole sourcing can pose a reliability risk; however, some items may require sole sourcing due to logistics, geography, or economics. While we can never fully eliminate interruptions, we continually assess the viability of sources across the value chain to minimize impacts and improve our overall reliability, customer satisfaction, and profitability.

Reliability is also critical for our supply chain teams as they support business plans. The supply chain teams balance customer demand with our supply capability to ensure that we meet our customers’ needs. The teams focus on customer alignment, organizational responsiveness, network resilience, and financial benefit.

We proactively track and trace our logistics capability to improve reliability. While our regional teams are implementing slightly different platforms across the globe, they have the shared overarching goal of increasing visibility of transportation, augmenting responsiveness for our customers, improving the performance of logistics service providers to deliver orders “on time and in full,” and reducing lead times and inventory. This approach may include the use of local suppliers in our significant locations of operation.
Huntsman works collaboratively across divisions to ensure maximum learning in the supply chain. Huntsman has established a Supply Chain Council that identifies critical supply chain areas where there is benefit in driving common goals and activities. In 2022, the Council concentrated on people development—leveraging both common internal and external training, harmonization of job profiles, and the identification of required competencies within the supply chain to ensure future success within the function.
Huntsman has a Vendor Code of Conduct that reinforces our commitments to environmental and social performance of our business, including our supply chain partners. In the future, Huntsman will use the EcoVadis platform to assess the relative sustainability performance of our supply chain partners, from onboarding through contract termination, to identify risks and corrective actions, if any, that may be required. As we deploy the EcoVadis assessment, we will be able to report on the percentage of suppliers screened in the reporting period.
We formed the Manufacturing and Engineering Council (MEC) more than ten years ago. The MEC is comprised of executives responsible for leading and continuously improving Huntsman’s manufacturing and engineering systems, processes, tools, and organizational capability and culture within our manufacturing sites. Safety, engineering, and operational excellence are key responsibilities for the MEC. The MEC is led by the Senior Vice President of EHS and Manufacturing Excellence and meets on a quarterly basis.
The Global Reliability Improvement Program (GRIP) has been integrated into a Polyurethanes-wide transformation with an expanded remit to deliver both sustainable and cost-effective reliability. Our global operating model changes are made to further integrate continuous improvement into core manufacturing activities.
• Global Excellence Team expanded to drive strategic improvement roadmaps in five areas:
- Process and Process Safety Engineering
- Maintenance, Reliability and Turnarounds
- Digital Manufacturing
- Operational Excellence and Lean
- Capex Portfolio Management
• Functional organization structures aligned across major sites in the U.S., U.K., the Netherlands, and China
- Unit cross-functional area teams created to drive asset accountability and performance
- Global functional networks established with clear linkages to Global Excellence Team strategic areas
These sites continue to use agile, 12-to 14-week sprints to develop, plan, and implement improvements targeted to improve reliability and deliver on business commitments.
Cybersecurity is a critical business issue and one that is continuously changing. We rely on information technology systems across our operations to manage our supply chain and financial information, as well as various other processes and transactions.
Our ability to effectively manage our business depends on the security, reliability, and capacity of our information and operational technology systems, as well as specific protection of the company’s intellectual property and other sensitive business information. Huntsman has invested, and continues to invest, in technology security initiatives and disaster recovery plans that help to protect against significant risks to our information technology systems and data. We have put in place security measures designed to protect against the misappropriation or corruption of our systems, intentional or unintentional disclosure of confidential information, and disruption of our operations. Our information security systems and processes are constantly reviewed, tested, updated, and enhanced as needed. This includes monitoring of third- and fourth-party risk, conducting cyber risk assessments to ensure that the third parties have appropriate controls in place.
All Huntsman employees are required to complete an annual cybersecurity course that is regularly updated based on the latest types of attacks and security best

practices. In addition, high cyber risk job roles and teams receive specialized training. Internal phishing awareness exercises and campaigns are included as part of this education.
In addition to our cybersecurity efforts, data privacy is a subject that has frequently changing rules and regulations in countries where we do business. For example, the European Union’s General Data Protection Regulation, Brazil’s General Data Protection Law (Lei Geral de Proteção de Dados), and, in the U.S., the California Consumer Privacy Act require companies to meet new regulations regarding the handling of personal data. Huntsman continuously monitors and updates data protection efforts as required. Effective cybersecurity requires constant vigilance and regular updating of systems and processes. Huntsman takes threats seriously, and we continue to work to improve our systems and processes, so they provide the most effective security possible to protect our technology systems, data, and operations.
Education is an essential part of protection, and we strive to reinforce a cybersecurity-aware culture within Huntsman.

Enriching lives through innovation is more than our motto—it is at the heart of who we are as a company.
For 50 years, our employees have been using science and ingenuity to create innovations that play a critical role in the everyday lives of many millions of people. We work in deep partnership with our customers to create solutions that help make people’s lives more sustainable, effective, and comfortable.

Our products comprise a broad range of chemicals and formulations, which we market globally to a diversified group of consumer and industrial customers. Our products are used in a wide range of applications, including those in adhesives, aerospace, automotive, construction products, durable and non-durable consumer products, electronics, insulation, medical, packaging, coatings and construction, power generation, refining, synthetic fiber, textile chemicals and dyes industries.
Growth in our differentiated products has been driven by the substitution of our products for other materials and by the level of global economic activity. We work closely with our customers to develop innovations that improve the performance and sustainability of our products.
Many of our products are designed for use-phase resource efficiency such as fuel additives and lubricants,

light weighting, or improving textile production processes. While sustainability broadly covers multiple aspects of society, we selected the United Nations Sustainable Development Goals (SDGs) as a globally accepted standard. And we have therefore defined sustainability as products that contribute to one or more of the SDGs.
Proprietary protection of our processes, apparatuses, and other technology and inventions is important to our businesses. We also rely on unpatented proprietary know-how, along with continuing technological innovation and other trade secrets, to develop and maintain our competitive position.
We own approximately 3,080 unexpired patents and have approximately 1,055 patent applications (including provisionals) currently pending.
Energy Conservation, Alternative Energy, and Storage
Polyurethanes Performance Products Advanced Materials Textile Effects

High performing insulation
Smarter, more efficient power grid
Electric vehicle battery solvents and motor encapsulation

Wind energy (resins, hardeners, and adhesives)
Light weighting (transportation, industrial)
Low energy consumption in processing
High performance polyurethanes panel insulation used in cold chain / food preservation
Polyurethanes pipe insulation used to improve industrial insulation and drive emission reduction
Low-VOC emission products
Emissions Reduction
Cleaner fuels and natural gas treating
Water-reducing and zero discharge dyes and inks
Waste Reduction
Upcycling PET (e.g., plastic bottles) to polyester polyols

For additional details on financial data, please refer to our 10-K for the year-ended December 31, 2022.

The following section offers further details on our reporting parameters and provides indices that cross-reference wellknown disclosure frameworks.


Huntsman has reported in accordance with the GRI Standards (2021) for the period January 1 through December 31, 2022, in line with our financial reporting period, unless stated otherwise in the report.
We have provided a consistent treatment of identified material topics and have aligned these topics and other disclosures to the World Economic Forum’s taxonomy of Stakeholder Topics. Huntsman is also reporting in accordance with Sustainability Accounting Standards Board (SASB) standards and the Task Force on Climate-related Financial Disclosures (TCFD) framework and has cross-referenced the CDP Worldwide global disclosure system. We report our sustainability performance on an annual basis.
All the entities in our financial reporting are included in our sustainability reporting. A list of Huntsman’s entities can be found online.
The report includes data related to all Huntsman enterprises where we have operational control (more than 50%) and to joint ventures where we have management control.
The data reported have been obtained primarily from our financial management reporting systems; various human resources information systems; and the Huntsman corporate reporting systems for environmental, health, and safety performance indicators.
We are confident in the overall reliability of the data reported but recognize that some of these data are subject to uncertainty, inherent to limitations associated with measuring, calculating, and estimating data.
Minor corrections in historic data may be due to data errors or other approved reasons. Each year, energy consumption and environmental emission estimates are recalculated and revised for all years in the annual sustainability report, as attempts are made to improve both the analyses (by using better methods or data) and the overall usefulness of the report. As a result, figures may include updates to data published in the past.
Restatements to data to figures previously reported are made to assure consistency and enable comparability between reporting periods.
We make restatements when material changes in our business or disclosure parameters could influence the analysis of the changes in our impacts over time. The source of
these material changes could be due to, but is not limited to, changes in:
• Reporting boundary
• Methodology
• Our business due to acquisitions, divestments, and mergers, to assure comparable reporting over time periods
• Improvements in data accuracy
• Error made in previous reporting periods.
There is no materiality threshold for the abovenamed changes. For acquisitions, divestments, and mergers, that occur in the reporting year, we adjust measures for the entire reporting year and all previous years.
In this reporting cycle, we adjusted our historical numbers for changes in our assumptions regarding the global warming potential (GWP) for non-methane volatile organic compounds (NMVOCs) based on the speciation of the gases composing our NMVOCs. To assure that we track our progress against our 2019 baseline for our 2025 Horizon targets, we have adjusted our historical figures to account for a lower assumption for the GWP of our NMVOCs.
In the 2021 Sustainability Report, the figures for water withdrawals, discharges, and consumption were shown in megaliters but the amounts reported were in cubic meters. This caused the amounts reported as megaliters to be overstated by a factor of one thousand. The prior year amounts have been corrected to megaliters in the current year.
All financial figures disclosed in this report are in U.S. dollars (USD). In this report, “metric tons,” “tons,” “t” and “(t)” all refer to metric tons.
Limited assurance has been provided by a third party for operational greenhouse gas emissions (Scope 1 and Scope 2) and water consumption. A link to the third-party report can be found online.
Please contact us at sustainability@huntsman.com with any questions or comments about this report.
Note: The above financial amounts reflect the results from continuing operations for all periods presented and primarily exclude the results of our Textile Effects business, which were reported as discontinued operations beginning in 2022.
1 Reconciliation of non-GAAP financial measures to the most directly comparable GAAP financial measures are provided through the “Non-GAAP Reconciliation” link available in the “Financials” section on our website at www.huntsman.com/investors.
2 Pursuant to U.S. Securities and Exchange Commission (SEC) regulations, the company accrues liabilities (reserves) relating to anticipated environmental cleanup obligations, site remediation/reclamation and closure costs, and material monetary sanctions (i.e., enforcement penalties), which are recorded and can be reasonably estimated.
3 Net Debt calculated as total debt, excluding affiliates, less cash of $654 million, $1,041 million, and $1,593 million in 2022, 2021 and 2020, respectively.
4 Environmental data is based on 72 manufacturing facilities reporting emissions and energy data.
5 Air emissions are releases of volatile organic compounds (VOCs), carbon monoxide (CO), nitrogen oxides (NOx), sulfur oxides (SOx), particulate matter, and other contaminants.
6 Number of full-time equivalents (FTE) based on annual reported hours worked by contractors in our safety statistics program and 2,000 hours per FTE.
Statement ABOUT THIS REPORT Introduction Who We Are Governance Planet People Prosperity
of
Huntsman has reported in accordance with the GRI Standards (2021). We have provided a consistent treatment of identified material topics and have aligned these topics and other disclosures to the World Economic Forum’s taxonomy of Stakeholder Topics. We do not list our material topics in order, but instead have grouped topics according to the World Economic Forum’s sustainability themes of “Planet-People-Prosperity-Principles of Governance.” The GRI
index is provided in this report for convenience to enhance readability and assist with locating topics.
The GRI index is provided below to assist with locating topics. In addition to providing the sections and page numbers for topics, we have included, where applicable, cross-references to both the United Nations Sustainability Development Goals
with the GRI Standards
Communication and training about anti-corruption policies and procedures
In addition to our Code of Business Conduct, Huntsman internal policies include training on anticorruption. Each year, 100% of regular full-time and part-time, limited-term and Huntsman paid employees worldwide are required to complete online Code of Business Conduct training. Employees with more sensitive roles are required to take additional training.
Confirmed incidents of corruption and actions taken
Where any incident of corruption was identified, appropriate disciplinary action was taken in conformance with applicable laws. In addition, Huntsman has internal policies that include training on anti-corruption.
Any legal actions that are material for anti-competitive behavior, anti-trust, or monopoly practices would be disclosed in Huntsman’s filings with the U.S. Securities and Exchange Commission, and all such actions would generally be a matter of public record.
Huntsman is not aware of any significant impacts in our supply chain with respect to the environment, labor, human rights, or societal issues that occurred in 2022.
do not report in detail on the return to
leave by
Huntsman is unaware of any complaints regarding breaches of customer privacy or loss of customer data in 2022.
Air Quality
Air emissions of NOX (excluding N2O), (2) SOX, (3) volatile organic compounds (VOCs), and (4) hazardous air pollutants (HAPs)
Discussion of corporate positions related to government regulations and/or policy proposals that address environmental and social factors affecting the industry
Governance
Disclose the organization’s governance around climate related risks and opportunities.
Strategy
a.) Describe the Board’s oversight of climate-related risks and opportunities.
b.) Describe management’s role in assessing and managing climate-related risks and opportunities.
a.) Describe the climate-related risks and opportunities Huntsman has identified over the short, medium, and long term.
Disclose the actual and potential impacts of climate-related risks and opportunities on the organization’s businesses, strategy, and financial planning.
b.) Describe the impact of climate-related risks and opportunities on Huntsman’s businesses, strategy, and financial planning.
c.) Describe the resilience of Huntsman’s strategy, taking into consideration different climate related scenarios, including a 2°C or lower scenario.
Risk Management
a.) Describe Huntsman’s processes for identifying and assessing climaterelated risks.
Disclose how the organization identifies, assesses, and manages climate-related risks.
b.) Describe Huntsman’s processes for managing climate-related risks.
c.) Describe how processes for identifying, assessing, and managing climate-related risks are integrated into Huntsman’s overall risk management.
a.) Disclose the metrics used by Huntsman to assess climate-related risks and opportunities in line with its strategy and risk management process.
Disclose the metrics and targets used to assess and manage relevant climate related risks and opportunities.
b.) Disclose Scope 1, Scope 2, and, if appropriate, Scope 3 greenhouse gas (GHG) emissions and the related risks.
c.) Describe the targets used by Huntsman to manage climate-related risks
and performance against targets.
Certain information set forth in this report contains “forward-looking statements” within the meaning the Private Securities Litigation Reform Act of 1995, Section 27A of the Securities Act of 1933 and Section 21E of the Securities Exchange Act of 1934. All statements other than historical factual information are forward-looking statements, including without limitation statements, express or implied, of belief or expectation or aspirational statements regarding our ESG commitments, targets, goals, initiatives, strategies, and efforts and their impact on our business, future financial results, suppliers, customers, and communities; the timing of any of the foregoing; assumptions underlying any of the foregoing; and any other statements that address events or developments
that we intend or believe will or may occur in the future. In some cases, forward-looking statements can be identified by terminology such as “believes,” “expects,” “may,” “will,” “should,” “anticipates” or “intends” or the negative of such terms or other comparable terminology, or by discussions of strategy. We may also make additional forward-looking statements from time to time.
All forward-looking statements are based upon our current expectations, estimates, projections, opinions or beliefs and various assumptions. Our expectations, beliefs and projections are expressed in good faith and we believe there is a reasonable basis for them, but there can be no assurance that our expectations, beliefs and projections will result or be achieved. These expectations and assumptions
are inherently subject to significant business, economic, competitive, regulatory and other risks and uncertainties, many of which are difficult to predict and beyond Huntsman’s control. All forward-looking statements apply only as of the date made. We undertake no obligation to publicly update or revise forward-looking statements whether because of new information, future events or otherwise, except as required by securities and other applicable law.
There are a number of risks, known and unknown, and uncertainties and assumptions that could cause our actual results to differ materially from the projected results expressed or implied by the forward-looking statements contained in or contemplated by this report. Accordingly, investors should not place undue

reliance on forward-looking statements as a prediction of actual results or actual performance. Any forward-looking statements should be considered in light of the risks discussed in our periodic filings with the Securities and Exchange Commission, including our Forms 10-K, 10-Q, and any 8-Ks.
As further discussed in the “Materiality” section of this report, materiality is used within this document to describe issues relating to ESG strategies that we consider to be of a particular level of importance in terms of stakeholder interest and potential business impact. Materiality, for the purposes of this document should not, therefore, be read as equating to any use of the word in other reporting or filings by Huntsman. No part of this report shall be
taken to constitute an invitation or inducement to invest in Huntsman.
Certain information contained herein relating to any goals, targets, intentions, or expectations, including with respect to climate change-related targets and goals and related timelines, is subject to change, and no assurance can be given that such goals, targets, intentions, or expectations will be met. Similarly, there can be no assurance that Huntsman’s ESG policies and procedures as described in this report will continue; such policies and procedures could change, even materially. Huntsman is permitted to determine in its discretion that it is not feasible or practical to implement or complete certain of its ESG initiatives, policies, and procedures based on cost, timing, or other considerations.
Statistics and metrics provided herein relating to ESG matters (including those related to greenhouse gas emissions) are estimates and may be based on estimates or assumptions, which may be inaccurate, or developing standards and methodologies. The accuracy of such statistics and metrics is therefore subject to variance
Certain information contained herein has been obtained from third parties, and in certain cases has not been updated through the date hereof. While these third-party sources are believed to be reliable, Huntsman makes no representation or warranty, express or implied, with respect to the accuracy, fairness, reasonableness or completeness of any of the information contained herein, and expressly disclaims any responsibility or liability therefor.


