DRAFT BUDGET 2022-23
GOLDEN PLAINS SHIRE COUNCIL
5.4 RATING INFORMATION This section contains information on Council’s past and foreshadowed rating levels, along with Council's rating structure and the impact of changes in property valuations. This section should be read in conjunction with Council’s Rating Strategy which is available on Council’s website. Rating context Rates and charges are an important source of revenue, accounting for 50% of income received by Council. Planning for future rate increases is therefore an important component of the Financial Planning process. In 2005, it was identified that Council’s low level of rate income was becoming unsustainable and that Council had to make a conscious decision to improve its financial position. To ensure this action did not have a detrimental impact on Council services, it was important to increase the unsustainably low rate base and to decrease Council’s reliance on government funding. Golden Plains Shire also faced, and continues to face, the following challenges: High population growth Increased demand for new services A history of significant dependence on grants, contributions and recoupments Substantial challenges associated with provision and renewal of roads, paths, and community and recreation facilities • Supporting community based Committees of Management that currently manage the vast majority of community and recreation facilities on Council and Crown land Council’s Rate Concentration is budgeted to be 57.9%, which has historically been 5-6% less than similar large rural shires. The current rate capping framework will not enable Council to improve this indicator without applying for a variation. Managing the competing interests of rural and urban communities and Maintaining the extensive road network of over 1,800 km • • • •
• • •
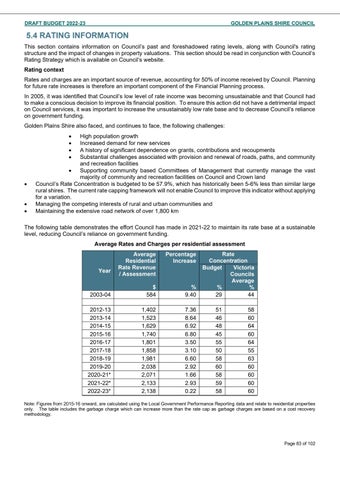
The following table demonstrates the effort Council has made in 2021-22 to maintain its rate base at a sustainable level, reducing Council’s reliance on government funding. Average Rates and Charges per residential assessment Average Residential Rate Revenue / Assessment
Percentage Increase
2003-04
$ 584
% 9.40
2012-13 2013-14 2014-15 2015-16 2016-17 2017-18 2018-19 2019-20 2020-21* 2021-22* 2022-23*
1,402 1,523 1,629 1,740 1,801 1,858 1,981 2,038 2,071 2,133 2,138
7.36 8.64 6.92 6.80 3.50 3.10 6.60 2.92 1.66 2.93 0.22
Year
Rate Concentration Budget Victoria Councils Average % % 29 44 51 46 48 45 55 50 58 60 58 59 58
58 60 64 60 64 55 63 60 60 60 60
Note: Figures from 2015-16 onward, are calculated using the Local Government Performance Reporting data and relate to residential properties only. The table includes the garbage charge which can increase more than the rate cap as garbage charges are based on a cost recovery methodology.
Page 83 of 102


