1 minute read
LICs: New challenges emerge compared to pre-HIPC era


Compared to the pre-HIPC era: Debt stocks are not as high.
Public Debt-to-GDP Ratio in Country Subgroups (Median, percent of GDP)
Advertisement
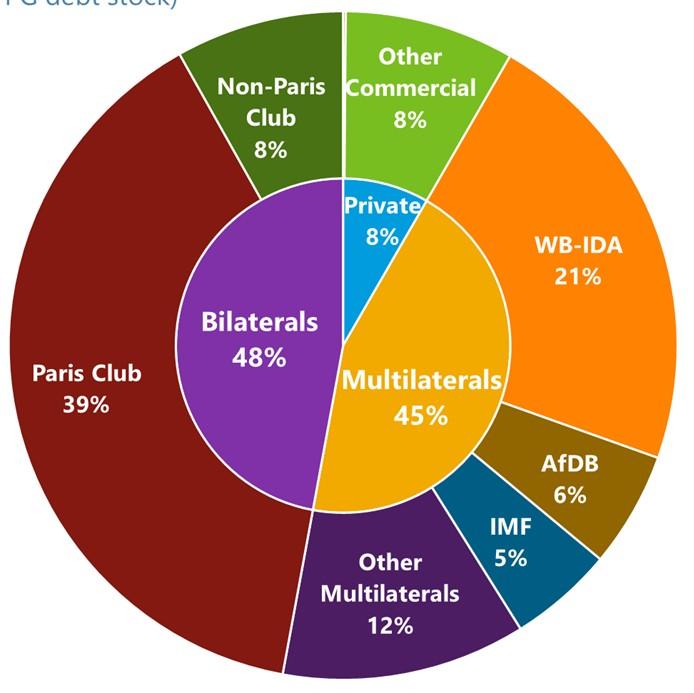
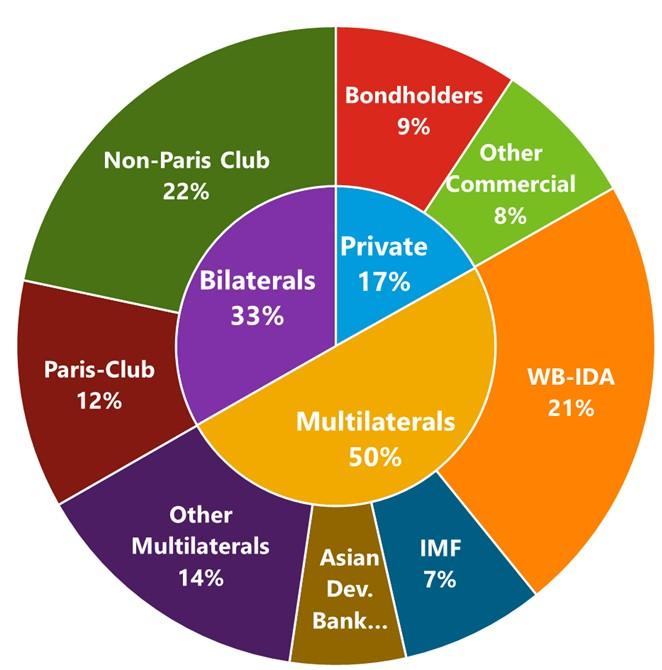
evolving creditor landscape with increasing lending from non-Paris Club and private creditors poses new coordination challenges.
End-1996: Distribution of PRGT Creditors (in percent of total PPG debt stock)
End-2020: Distribution of PRGT Creditors (in percent of total PPG debt stock)
Sources: IMF Global Debt Database, IMF WEO and staff calculations
Arrears accumulation also appears to be minimal.
Outstanding Arrears (in Percent of Exports, median)
Pre-HIPC HIPC
Principal arrears, official Principal arrears, private Interest arrears, official Interest arrears, private
Source: WB IDS and staff calculations
Sources: World Bank IDS and staff calculations
Debt Vulnerabilities in EMs: debt and interest payments are projected to be at pre-pandemic levels for 2023, but primary balances worsen Projections for year 2023 (in percent of GDP)
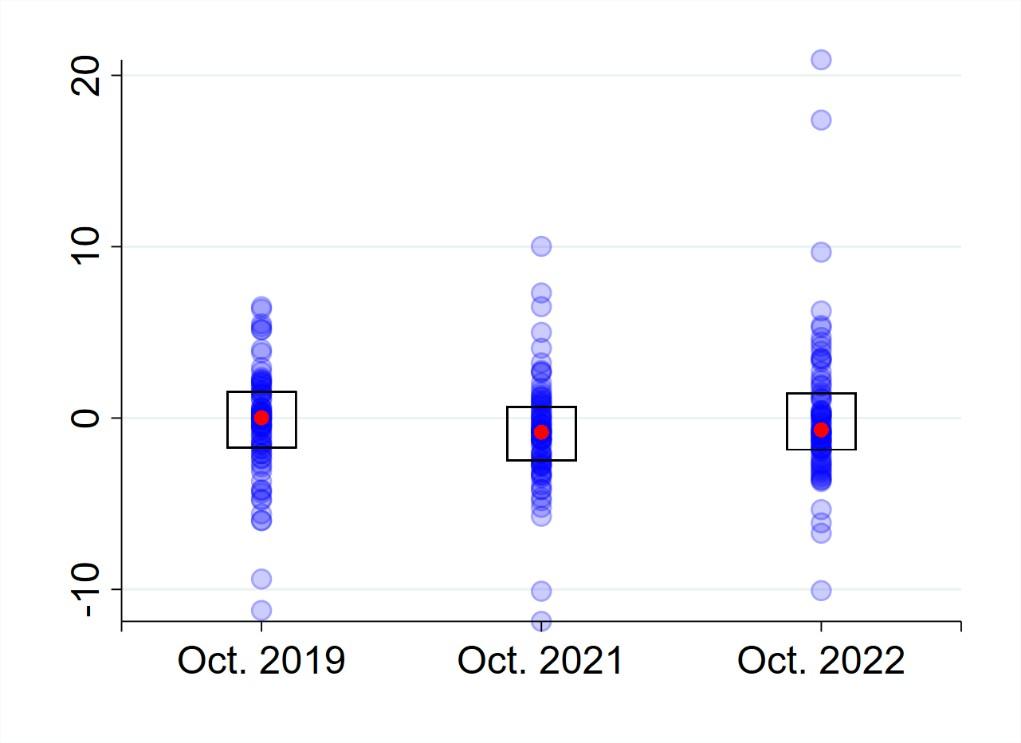
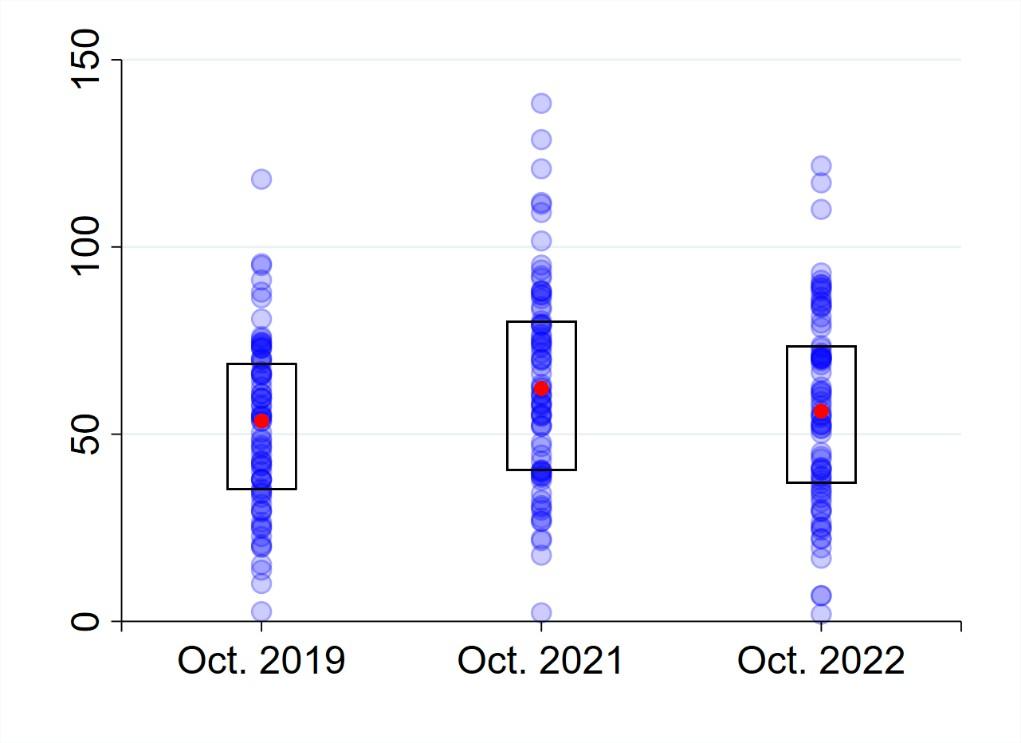

Interest Payments of Countries Displayed: 79.
Note: Charts exclude Venezuela, Lebanon and Ukraine. Red diamond indicates median value. “Boxes” indicate interquartile range.

