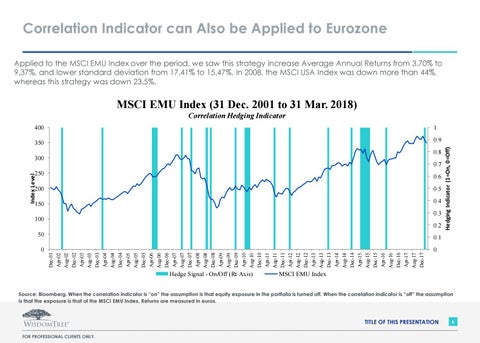
Correlation Indicator can Also be Applied to Eurozone Applied to the MSCI EMU Index over the period, we saw this strategy increase Average Annual Returns from 3.70% to 9.37%, and lower standard deviation from 17.41% to 15.47%. In 2008, the MSCI USA Index was down more than 44%, whereas this strategy was down 23.5%.
MSCI EMU Index (31 Dec. 2001 to 31 Mar. 2018) 400
1
350
0.9 0.8
300 0.7 0.6
200
0.5
150
0.4
Index Level
250
0.3 100 0.2 50
0.1 Dec-01 Apr-02 Aug-02 Dec-02 Apr-03 Aug-03 Dec-03 Apr-04 Aug-04 Dec-04 Apr-05 Aug-05 Dec-05 Apr-06 Aug-06 Dec-06 Apr-07 Aug-07 Dec-07 Apr-08 Aug-08 Dec-08 Apr-09 Aug-09 Dec-09 Apr-10 Aug-10 Dec-10 Apr-11 Aug-11 Dec-11 Apr-12 Aug-12 Dec-12 Apr-13 Aug-13 Dec-13 Apr-14 Aug-14 Dec-14 Apr-15 Aug-15 Dec-15 Apr-16 Aug-16 Dec-16 Apr-17 Aug-17 Dec-17
0
Hedging Indicator (1=On, 0=Off)
Correlation Hedging Indicator
Hedge Signal - On/Off (Rt Axis)
0
MSCI EMU Index
Source: Bloomberg. When the correlation indicator is “on” the assumption is that equity exposure in the portfolio is turned off. When the correlation indicator is “off” the assumption is that the exposure is that of the MSCI EMU Index. Returns are measured in euros.
TITLE OF THIS PRESENTATION FOR PROFESSIONAL CLIENTS ONLY.
6