F
Flour milling requires control of the protein and moisture content of wheat
F
by Phillip Clancy, Next Instruments, Australia lour milling requires control of the protein and moisture content of wheat. Traditionally, samples of wheat are collected from each truckload and decisions are made to segregate the wheat into low, medium and high protein silos. These grab samples do not necessarily reflect the protein variation within the truck or railcar loads. As such, a Manildra Flour Mill, Narrandera, NSW installed a CropScan 3000S In Line Whole Grain Analyser (fig 1 and 2) to measure protein and moisture in wheat at the in-take elevator of the mill. A calibration was developed by collecting spectral data from daily intake loads over several weeks. Having a good range of samples with low to high protein and moisture values and different varieties helped to develop a robust calibration that predicts accurately in the future. To validate the CropScan 3000S, calibration for wheat samples from many weeks were compared to the flourmill’s laboratory NIR analyser. This study compares the protein and moisture in wheat as analysed by the CropScan 3000S In Line Whole Grain Analyser with the flourmills’ bench top NIR analyser.
Instrumentation
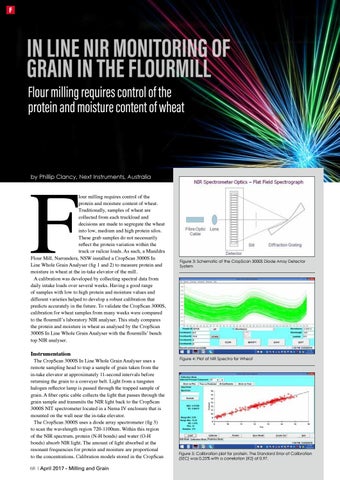
The CropScan 3000S In Line Whole Grain Analyser uses a remote sampling head to trap a sample of grain taken from the in-take elevator at approximately 11-second intervals before returning the grain to a conveyer belt. Light from a tungsten halogen reflector lamp is passed through the trapped sample of grain. A fiber optic cable collects the light that passes through the grain sample and transmits the NIR light back to the CropScan 3000S NIT spectrometer located in a Nema IV enclosure that is mounted on the wall near the in-take elevator. The CropScan 3000S uses a diode array spectrometer (fig 3) to scan the wavelength region 720-1100nm. Within this region of the NIR spectrum, protein (N-H bonds) and water (O-H bonds) absorb NIR light. The amount of light absorbed at the resonant frequencies for protein and moisture are proportional to the concentrations. Calibration models stored in the CropScan 68 | April 2017 - Milling and Grain
Figure 3: Schematic of the CropScan 3000S Diode Array Detector System
Figure 4: Plot of NIR Spectra for Wheat
Figure 5: Calibration plot for protein. The Standard Error of Calibration (SEC) was 0.25% with a correlation (R2) of 0.97.