sanford stadium history
2018 Rose Bowl Game Champions
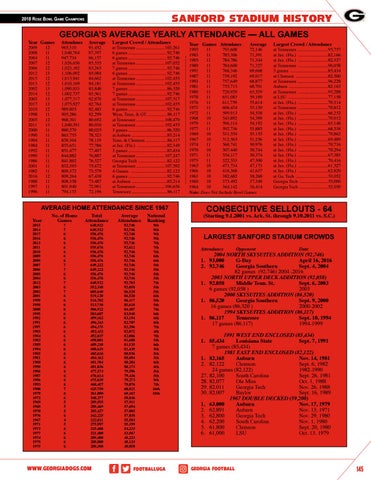
GEORGIA’S AVERAGE YEARLY ATTENDANCE — ALL GAMES
Year Games Attendance Average 2009 12 2008 11 2004 11 2007 12 2006 12 2012 13 2015 12 2013 12 2002 13 2014 12 2003 13 2017 13 2010 12 1998 11 2005 12 2011 13 2000 11 1990 11 1994 11 1984 11 1992 11 1999 11 1986 11 2001 11 1982 11 2016 12 1988 11 1997 11 1996 11
965,310 1,048,764 947,734 1,026,656 1,023,182 1,106,092 1,015,941 1,010,169 1,090,033 1,002,737 1,077,317 1,075,927 989,805 905,286 968,301 1,040,391 880,270 863,755 859,304 855,651 851,477 844,882 841,802 832,395 809,372 809,264 808,358 801,940 794,153
91,452 87,397 86,157 85,555 85,265 85,084 84,662 84,181 83,848 83,561 82,870 82,764 82,483 82,299 80,692 80,030 80,025 78,523 78,119 77,786 77,407 76,807 76,527 75,672 73,579 67,438 73,487 72,901 72,196
Largest Crowd / Attendance
at Tennessee..........................103,261 6 games...................................92,746 6 games...................................92,746 at Tennessee..........................107,052 7 games...................................92,746 6 games...................................92,746 at Tennessee..........................102,455 at Tennessee..........................102,455 7 games...................................86,520 7 games...................................92,746 at Tennessee..........................107,517 at Tennessee..........................102,455 6 games...................................92,746 Wym, Tenn, & GT.................. 86,117 at Tennessee..........................108,470 at Tennessee..........................102,455 3 games...................................86,520 at Auburn ...............................85,214 Tenn. & Clemson.................... 86,117 at Jax. (Fla.) ...........................82,349 3 games...................................85,434 at Tennessee..........................107,247 Georgia Tech ..........................82,122 at Tennessee..........................107,592 4 Games .................................82,122 6 games...................................92,746 at Auburn ...............................85,214 at Tennessee..........................106,656 Tennessee................................ 86,117
AVERAGE HOME ATTENDANCE SINCE 1967
No. of Home Year Games 2015 2014 2017 2016 2013 2011 2010 2009 2008 2007 2006 2005 2004 2012 2003 2002 2001 1999 1998 2000 1995 1992 1991 1997 1983 1984 1982 1989 1994 1985 1981 1988 1990 1986 1987 1996 1993 1980 1979 1972 1969 1968 1970 1976 1967 1971 1973 1977 1974 1978 1975
Total Average National Attendance Attendance Ranking
7 7 6 6 6 6 6 6 6 7 7 6 6 7 6 7 6 6 6 6 6 6 6 6 6 6 6 6 6 6 6 6 6 6 6 6 6 7 6 6 5 5 5 6 4 5 6 6 6 6 6
648,922 92,746 9th 648,922 92,746 9th 556,476 92,746 9th 556,476 92,746 9th 556,476 92,746 7th 555,676 92,612 7th 556,476 92,746 7th 556,476 92,746 6th 556,476 92,746 6th 649,222 92,746 5th 649,222 92,746 5th 556,476 92,746 5th 556,476 92,746 5th 648,922 92,703 7th 552,348 92,058 5th 605,640 86,520 5th 519,120 86,520 6th 516,702 86,117 5th 513,710 85,618 5th 506,922 84,487 7th 503,687 83,948 6th 499,162 83,194 6th 496,243 82,707 6th 494,375 82,396 7th 492,432 82,072 4th 492,037 82,006 7th 490,081 81,680 5th 489,210 81,535 6th 488,633 81,439 5th 485,616 80,936 5th 484,162 80,694 5th 481,704 80,284 6th 481,036 80,173 6th 477,573 79,596 5th 476,614 79,436 5th 475,639 79,273 9th 468,457 78,076 7th 425,750 60,821 16th 361,000 60,167 18th 348,277 58,046 289,555 57,911 288,469 57,694 285,427 57,085 342,225 57,038 222,011 55,503 275,997 55,199 325,400 54,233 321,400 53,567 289,400 48,233 288,800 48,133 288,300 48,050
www.georgiadogs.com
footballuga
Year Games Attendance
Average
1995 11 793,608 72,146 1983 11 785,306 71,391 1985 11 784,786 71,344 1989 11 784,600 71,327 1991 11 766,346 69,668 1987 11 759,192 69,017 1993 11 757,649 68,877 1981 11 755,715 68,701 1980 11 720,929 65,539 1978 11 651,083 59,189 1976 11 611,759 55,614 1973 11 606,434 55,130 1972 11 599,913 54,538 1968 10 543,892 54,389 1979 11 596,114 54,192 1977 11 592,736 53,885 1969 10 531,554 53,155 1967 10 512,565 51,256 1974 11 560,741 50,976 1970 10 507,440 50,744 1971 11 554,117 50,374 1975 11 522,533 47,500 1965 10 471,734 47,173 1966 10 416,368 41,637 1963 10 382,682 38,268 1960 10 373,492 37,349 1964 10 364,142 36,414 Note: Does Not Include Bowl Games
Largest Crowd / Attendance
at Tennessee............................95,757 at Jax. (Fla.) ...........................82,166 at Jax. (Fla.) ...........................82,327 at Tennessee ...........................96,058 3 games ..................................85,434 at Clemson .............................82,500 at Tennessee............................96,228 Auburn ...................................82,165 at Tennessee ...........................95,288 at LSU ....................................77,158 at Jax. (Fla.) ...........................70,314 at Tennessee ...........................70,812 at Jax. (Fla.) ...........................66,252 at Jax. (Fla.) ...........................70,012 at Jax. (Fla.) ...........................63,148 at Jax. (Fla.) ...........................68,538 at Jax. (Fla.) ...........................70,862 at Jax. (Fla.) ...........................69,489 at Jax. (Fla.) ...........................70,716 at Jax. (Fla.) ...........................70,294 at Jax. (Fla.) ...........................67,383 at Jax. (Fla.) ...........................70,416 at Jax. (Fla.) ...........................61,527 at Jax. (Fla.) ...........................62,820 at Ga. Tech .............................53,052 Georgia Tech ..........................55,000 Georgia Tech ..........................52,050
CONSECUTIVE SELLOUTS - 64
(Starting 9.1.2001 vs. Ark. St. through 9.10.2011 vs. S.C.)
LARGEST SANFORD STADIUM CROWDS Attendance
Opponent
Date
2004 NORTH SKYSUITES ADDITION (92,746) G-Day April 16, 2016 1. 93,000 2. 92,746 Georgia Southern Sept. 4, 2004 82 games (92,746) 2004 -2016 2003 NORTH UPPER DECK ADDITION (92,058) 1. 92,058 Middle Tenn. St. Sept. 6, 2003 2003 6 games (92,058 ) 2000 SKYSUITES ADDITION (86,520) 1. 86,520 Georgia Southern Sept. 9, 2000 16 games (86,520 ) 2000-2002 1994 SKYSUITES ADDITION (86,117) Tennessee Sept. 10, 1994 1. 86,117 17 games (86,117) 1994-1999 1991 WEST END ENCLOSED (85,434) 1. 85,434 Louisiana State Sept. 7, 1991 7 games (85,434) 1981 EAST END ENCLOSED (82,122) 1. 82,165 Auburn Nov. 14, 1981 2. 82,122 Clemson Sept. 6, 1982 24 games (82,122) 1982-1990 27. 82,100 South Carolina Sept. 26, 1981 28. 82,077 Ole Miss Oct. 1, 1988 29. 82,011 Georgia Tech Nov. 26, 1988 30. 82,007 Baylor Sept. 16, 1989 1967 DOUBLE DECKED (59,200) 1. 63,000 Auburn Nov. 17, 1979 2. 62,891 Auburn Nov. 13, 1971 3. 62,800 Georgia Tech Nov. 29, 1980 4. 62,200 South Carolina Nov. 1, 1980 5. 61,800 Clemson Sept. 20, 1980 6. 61,000 LSU Oct. 13, 1979
georgia football
145