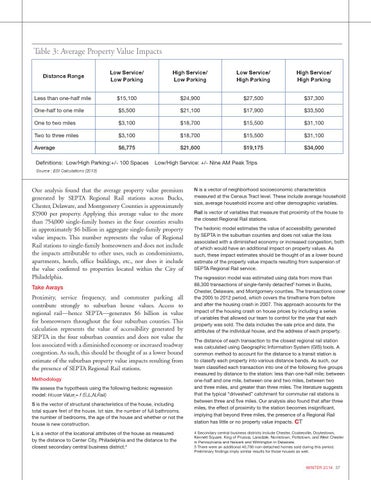
Table 3: Average Property Value Impacts Distance Range
Low Service/ Low Parking
High Service/ Low Parking
Low Service/ High Parking
High Service/ High Parking
Less than one-half mile
$15,100
$24,900
$27,500
$37,300
One-half to one mile
$5,500
$21,100
$17,900
$33,500
One to two miles
$3,100
$18,700
$15,500
$31,100
Two to three miles
$3,100
$18,700
$15,500
$31,100
Average
$6,775
$21,600
$19,175
$34,000
Definitions: Low/High Parking:+/- 100 Spaces
Low/High Service: +/- Nine AM Peak Trips
Source : ESI Calculations (2013)
Our analysis found that the average property value premium generated by SEPTA Regional Rail stations across Bucks, Chester, Delaware, and Montgomery Counties is approximately $7,900 per property. Applying this average value to the more than 754,000 single-family homes in the four counties results in approximately $6 billion in aggregate single-family property value impacts. This number represents the value of Regional Rail stations to single-family homeowners and does not include the impacts attributable to other uses, such as condominiums, apartments, hotels, office buildings, etc., nor does it include the value conferred to properties located within the City of Philadelphia. Take Aways
Proximity, service frequency, and commuter parking all contribute strongly to suburban house values. Access to regional rail—hence SEPTA—generates $6 billion in value for homeowners throughout the four suburban counties. This calculation represents the value of accessibility generated by SEPTA in the four suburban counties and does not value the loss associated with a diminished economy or increased roadway congestion. As such, this should be thought of as a lower bound estimate of the suburban property value impacts resulting from the presence of SEPTA Regional Rail stations. Methodology We assess the hypothesis using the following hedonic regression model: House Valuei= f (S,L,N,Rail) S is the vector of structural characteristics of the house, including total square feet of the house, lot size, the number of full bathrooms, the number of bedrooms, the age of the house and whether or not the house is new construction. L is a vector of the locational attributes of the house as measured by the distance to Center City, Philadelphia and the distance to the closest secondary central business district.4
N is a vector of neighborhood socioeconomic characteristics measured at the Census Tract level. These include average household size, average household income and other demographic variables. Rail is vector of variables that measure that proximity of the house to the closest Regional Rail stations. The hedonic model estimates the value of accessibility generated by SEPTA in the suburban counties and does not value the loss associated with a diminished economy or increased congestion, both of which would have an additional impact on property values. As such, these impact estimates should be thought of as a lower bound estimate of the property value impacts resulting from suspension of SEPTA Regional Rail service. The regression model was estimated using data from more than 88,300 transactions of single-family detached5 homes in Bucks, Chester, Delaware, and Montgomery counties. The transactions cover the 2005 to 2012 period, which covers the timeframe from before and after the housing crash in 2007. This approach accounts for the impact of the housing crash on house prices by including a series of variables that allowed our team to control for the year that each property was sold. The data includes the sale price and date, the attributes of the individual house, and the address of each property. The distance of each transaction to the closest regional rail station was calculated using Geographic Information System (GIS) tools. A common method to account for the distance to a transit station is to classify each property into various distance bands. As such, our team classified each transaction into one of the following five groups measured by distance to the station: less than one-half mile; between one-half and one mile, between one and two miles, between two and three miles, and greater than three miles. The literature suggests that the typical “driveshed” catchment for commuter rail stations is between three and five miles. Our analysis also found that after three miles, the effect of proximity to the station becomes insignificant, implying that beyond three miles, the presence of a Regional Rail station has little or no property value impacts. 4 Secondary central business districts include Chester, Coatesville, Doylestown, Kennett Square, King of Prussia, Lansdale, Norristown, Pottstown, and West Chester in Pennsylvania and Newark and Wilmington in Delaware. 5 There were an additional 40,700 non-detached homes sold during this period. Preliminary findings imply similar results for those houses as well.
WINTER 2014 37