
1 minute read
March and Easter hit by poor weather

Let’sstart with Easter: GTNBestsellers gardencentre Eposdataanalysis of volume sales over the Easter fortnight reveals that total volumesales were 11% down on Easter 2022 but 4% up on Easter 2019 and 44%uponEaster2018whenwe experienced the “Beastfromthe East.”
Withinthosetotal sales volumes, plant sales were down on Easter 2022 and2019by 21% and15%, butupon2018by45%
Theproblem with comparing Eastersales is that it movesaroundsomuch; from late March in 2018 to the endofApril in 2019.As Easter this year was one week earlier than in 2022 we won’tbeabletosee atrue year on year trading comparison.
The currentyear to date GTNBestsellers All Products Index, at the endofweek endingSunday16th April 2023 is down 1.7% on 2022 but up 19%vs2019. Thatfits well with reports that footfall andrestaurant sales have beengood. The cold andwet weather has,however had abiggereffecton plant sales.
To dateplantsalesvolumesare runningat 11.6%downon2022. Thankfully thisyear’s weather has not been as badas2018; the GTNBestsellersAll Plants index is currently 43% higherthan 2018
Those with good memories and records will recall that even afterthe disastrous Spring of 2018,plant sales and all garden sales volumes recovered to be 8% up on 2017 by the year end for plants and only 1% down on 2017 for All Products Sales volumes.
March BestsellersCharts and Volume trend analysis
The volumes of all items sold, including plants, in the GTNBestsellers Garden CentreEPOS data for March, shows adrop of 9% year on year and 27%downonthe peak of 2021.However,all sales volumes for the month were 12% up on March 2019 and 53% higher than March 2018
March Plant Sales
All Plant Sales Volumesfor March2023inthe GTNBestsellers EPOSdata were down 27% on 2022 volumes and down 9% on 2019 levels.

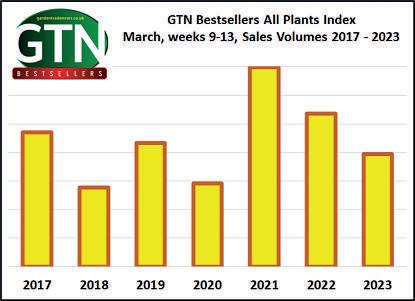
Comparedto2018’sBeast from theEast sales March 2023 fared 42%better.
Here’sthe Top50Bestselling plants for the month:
The UK Garden CentrePlants BestsellersChart
March 2023,Weeks 9-13
Garden Products Sales Volumes

The GTNBestsellers Garden Products Top50Chartssales volumes for March 2023 were only down 3% year on year but wayoff thehigh of 2021.Measured against pre-covid sales volumes the GTNTop 50 index wasup7%compared with 2019 and 28% up on 2018

The GTNBestsellersGarden Products Chart March 2023,Weeks 9-13
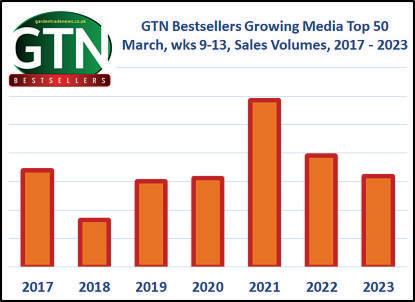
Growing Media
Sales Volumes
The GTNBestsellers Growing Media sales analysis for March reflects clearly the drop on gardening activity due to the poor weather.The GTNBestsellers Top50 Growing Media Products volume index wasdown 18% on 2022, down 45% on 2021,but up 6% on 2019 and 92% higher than levels seen in March 2018
The GTNBestsellersGrowing Media Chart March 2023,Weeks 9-13
Wild BirdCareVolume Sales
Interestingly the weatherduringMarch 2023 wasn’tbad enough to see aspikeinWildBirdCareSales, wherethe economic situation may also havehad an impact. Volumes for March 2023 were down 7% on 2022 but also down 27% on 2018 when therewas abig rush to feed wild life during “The Beast from the East.”
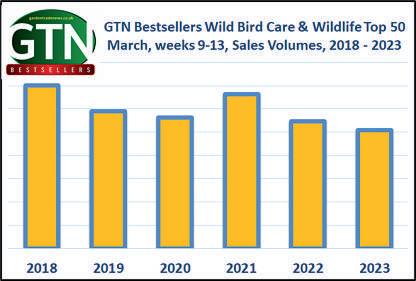

The GTNBestsellersWild Bird&Wildlife CareProducts Chart

March 2023,Weeks 9-13
The GTNBestsellersVeg 2Gro Chart March 2023,Weeks 9-13

