
JKG Q1 OFFICE market report 2023 | GALLELLI REAL ESTATE Gallelli Real Estate 3005 Douglas Blvd #200 Roseville, CA 95661 P 916 784 2700 GallelliRE.com

15.2 %
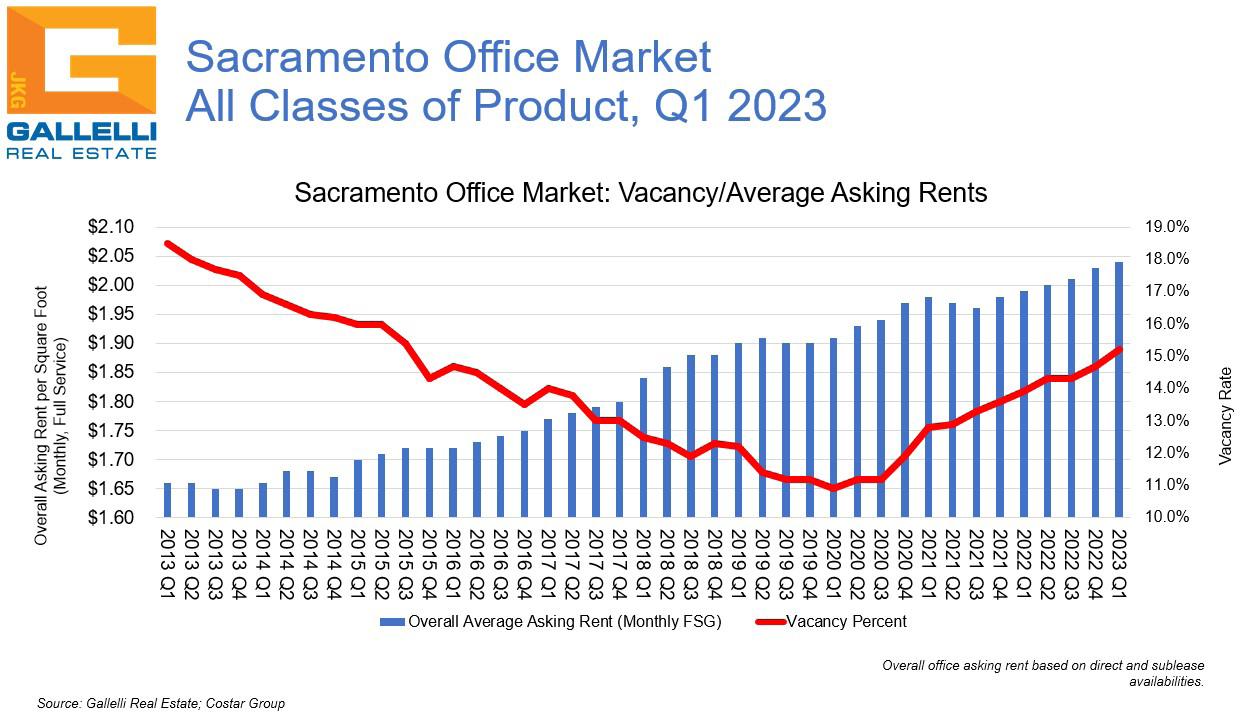
As of the close of Q1 2023, overall office vacancy in the Sacramento region stood at 15.2%. This reflects an increase from the 14.7% rate posted three months ago and the 13.9% level of one year ago. The market recorded negative net absorption to the tune of -324,000 square feet (SF) over the first three months of the year, continuing the trend that has challenged the marketplace since the pandemic first hit the United States three years ago. At that time, local vacancy stood at 10.9% with the market eight years into one of the strongest growth runs in its history. Following the Great Financial Crisis, local vacancy had peaked at 20.4% by Q1 2012. Over the next eight years, vacancy would decline in 28 of 32 quarters and local occupancy would grow by nearly 7.4 MSF. In fact, the 10.9% vacancy rate of Q1 2020 was the lowest the local market had recorded since Q4 2001.
Obviously, that all changed with the arrival of CoVid-19. The resulting surge in hybrid and remote work followed now by heightened economic uncertainty and the potential of a downturn have significantly weakened office leasing fundamentals everywhere. But considering the nature of these challenges (a structural shift in office usage for which the full impacts remain unclear combined with more “normal” cyclical economic issues), the Sacramento market has fared better than most. However, the pendulum has clearly swung in favor of tenants, and this is not likely to change anytime
soon. While we anticipate greater economic clarity over the next six months (positive news on the inflation front could hopefully give the Federal Reserve room to back off of additional interest rate hikes), the reality is that the structural issues facing the market are going to be with us through at least 2025.
Sacramento’s office inventory is roughly 68.0 MSF; over the last three years the amount of total vacant space has increased from 7.3 MSF to 10.3 MSF (or roughly 4.4% of the market’s inventory), with occupancy declines in ten of the past 12 quarters. This trend is expected to continue for at least the next 18 to 24 months as existing leases expire and many tenants use that opportunity to downsize. Meanwhile, sublease availability continues to rise.

Since 2020, sublease availability has more than doubled nationally (from roughly 115 MSF to approximately 265 MSF), with some metros experiencing triple or more the levels of sublease availability (Austin, Phoenix, Raleigh-Durham and San Francisco among them). While Sacramento has not been spared this trend (there is currently 1.7 MSF of sublease space available, compared to 704,000 SF pre-pandemic), the region does benefit from the fact that these still represent a small percentage of the region’s inventory (2.5%). By comparison, 7.2% of San Francisco’s inventory is available for sublease. In fact, Phoenix, Seattle, Boston, New York, Los Angeles and a number of other markets have double the supply of sublease overhang as a percentage of inventory than Sac ramento. Unfortunately, the problem is that deal velocity remains muted, with much of the activity occurring focused on relocations and downsizing. It is likely that much of the sublease availability nationally will eventually translate into actual vacancy down the road.
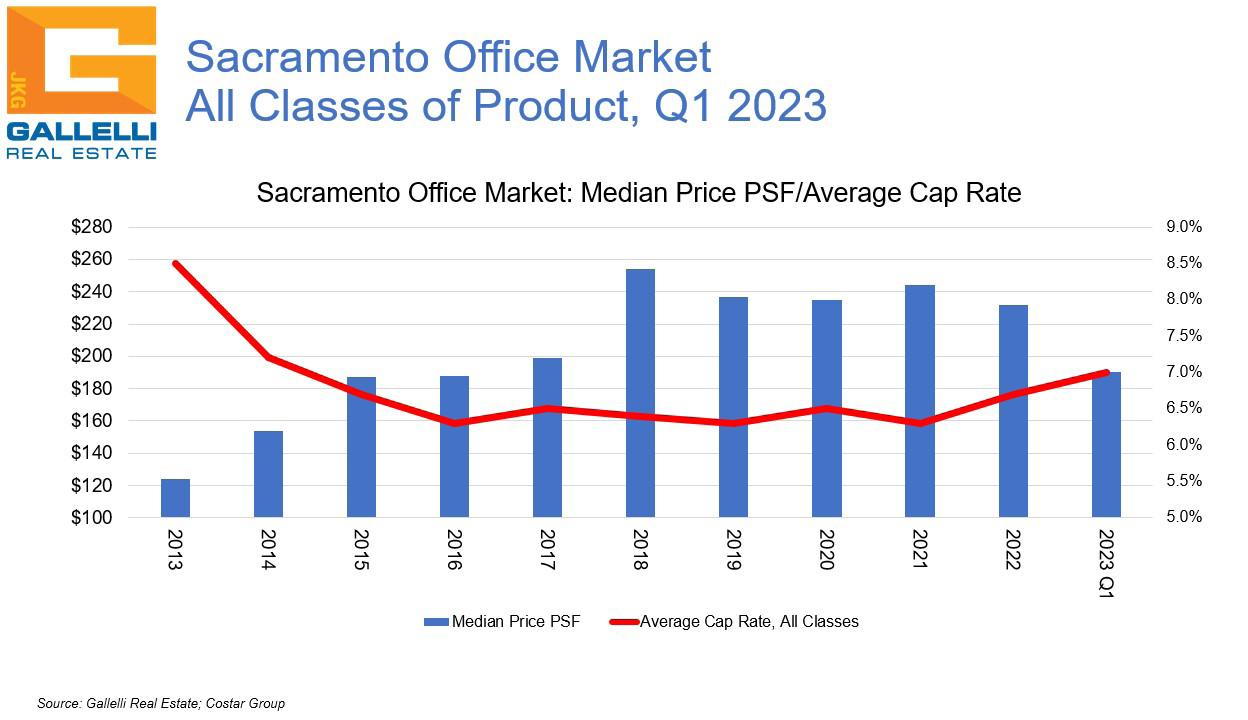
Despite all of these challenges, asking rates have remained firm. The current market-wide average asking rent (on a monthly full service gross basis) stands at $2.15 per square foot (PSF). One year ago, it stood at $2.09 PSF. Some of this reflects inflationary pressures, and landlords are certainly offering greater inducements today (free rent, more aggressive tenant improvement packages, etc.), but it also is critical to note that Sacramento’s current vacancy rate of 15.2% still stands below the region’s 20-year average of 15.3%. The region went through far more distress during the GFC, when it entered a period of crisis with vacancy already in the 15.0% range.
There are some other significant reasons why Sacramento has fared better than most markets and will likely continue to do so over the next couple of years. Nearly one third of the region’s office space is occupied by governmental entities—which largely have not shifted their real estate strategies (indeed, they still continue to drive modest occupancy gains offsetting some of the private sector space givebacks). Meanwhile, though the region is home to multiple corporate campuses and corporate headquarters users, the bread and butter of the Sacramento office market is the smaller professional business tenant. In general, these users have both less space to consolidate and have been less likely to move to hybrid or WFH models.
The largest space givebacks nationally have been from large block corporate users—particularly in the tech sector. While Sacramento is home to Intel and other tech players, the local presence here is dominated by small space startups. A quick review of submarket net absorption for Q1 2023 data demonstrates this fact. The Sacramento submarkets where large block space users are most plentiful would be Downtown (-55,000 SF and a 15.2% vacancy rate), Highway 50
(-116,000 SF/20.9%), Natomas (-123,000 SF/17.1%). Space users are a mix of larger block corporate players and smaller professional business users in El Dorado Hills/Folsom (-45,000 SF/15.2%) and Arden Arcade/Point West (-47,000 SF/20.5%). The markets where space users are overwhelmingly smaller professional business tenants; Roseville/Rocklin (+7,000 SF/14.7%), Northeast (+37,000/13.9%), Elk Grove/South Sacramento (+16,000 SF/5.4%) and Yolo County (+29,000 SF/8.5%).
Look for office vacancy in the Sacramento region to climb over the coming year, but for the local landlords and investors to experience far less pain than their counterparts in other major US markets. That said, flat rent growth in 2023 will be the best that landlords can hope for. Space users in growth mode, however, will find the most optimal leasing environment for tenants since the GFC. Expect a growing trend of flight to quality ahead; active space users will increasingly see the opportunity to upgrade space (though many of these will be footprint consolidations) in the current environment.
OFFICE MARKET STATISTICS: Criteria based on: 10,000 SF and above, does not include owner occupied, Existing, Under Construction, Proposed, Final Planning