JKG Economic & Commercial Real Estate Forecast 2023 | GALLELLI REAL ESTATE Gallelli Real Estate 3005 Douglas Blvd #200 Roseville, CA 95661 P 916 784 2700 GallelliRE.com Sacramento 2023
2023:
2023:
GAS
STATEWIDE
LOCAL
US EMPLOYMENT GROWTH SINCE THE PANDEMIC
CALIFORNIA EMPLOYMENT GROWTH SINCE THE PANDEMIC
US LABOR MARKET STILL HOT, DESPITE ECONOMIC CONCERNS
CALIFORNIA LABOR MARKET AMONG THE HOTTEST
USA JOB OPENINGS BY PROFESSION
WAGE GROWTH
US PERSONAL SAVINGS RATE
HOW MUCH DO AMERICANS HAVE IN THE BANK?
TOTAL CONSUMER DEBT
HOUSING WHIPLASH
OFFICE MARKET OVERVIEW
OFFICE INVESTMENT
INDUSTRIAL MARKET OVERVIEW
INDUSTRIAL INVESTMENT OUTLOOK
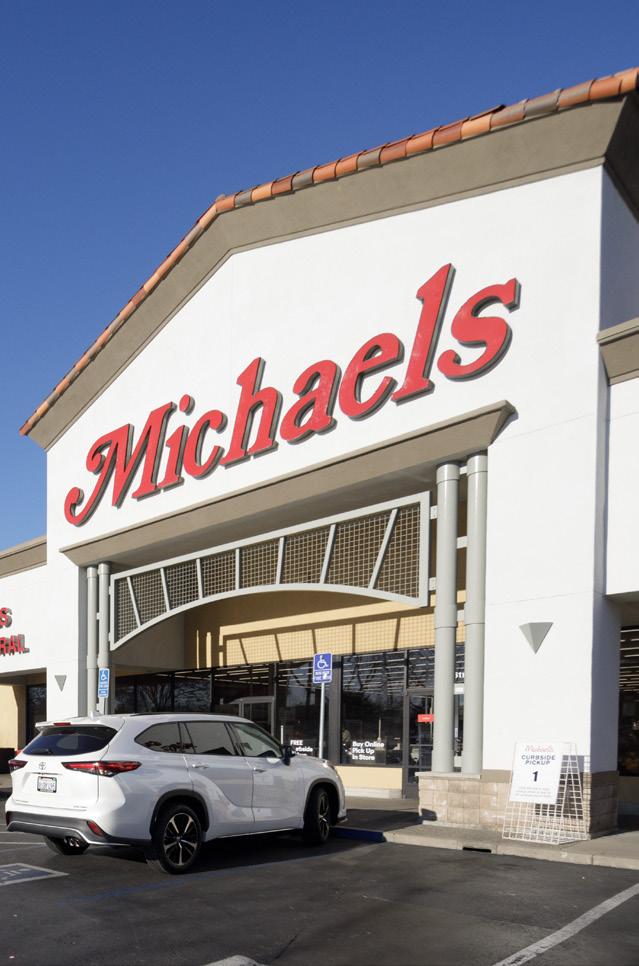
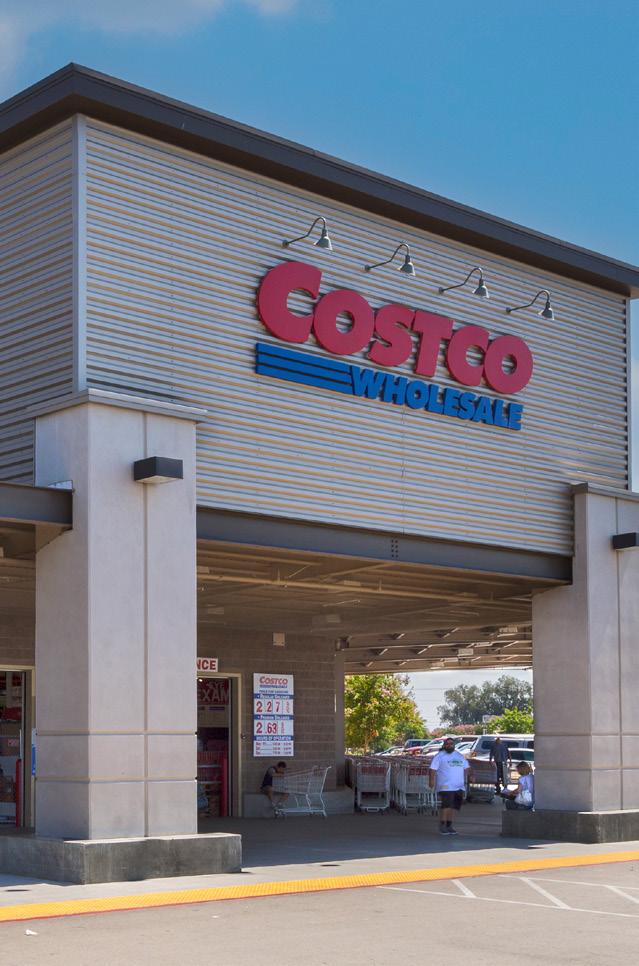
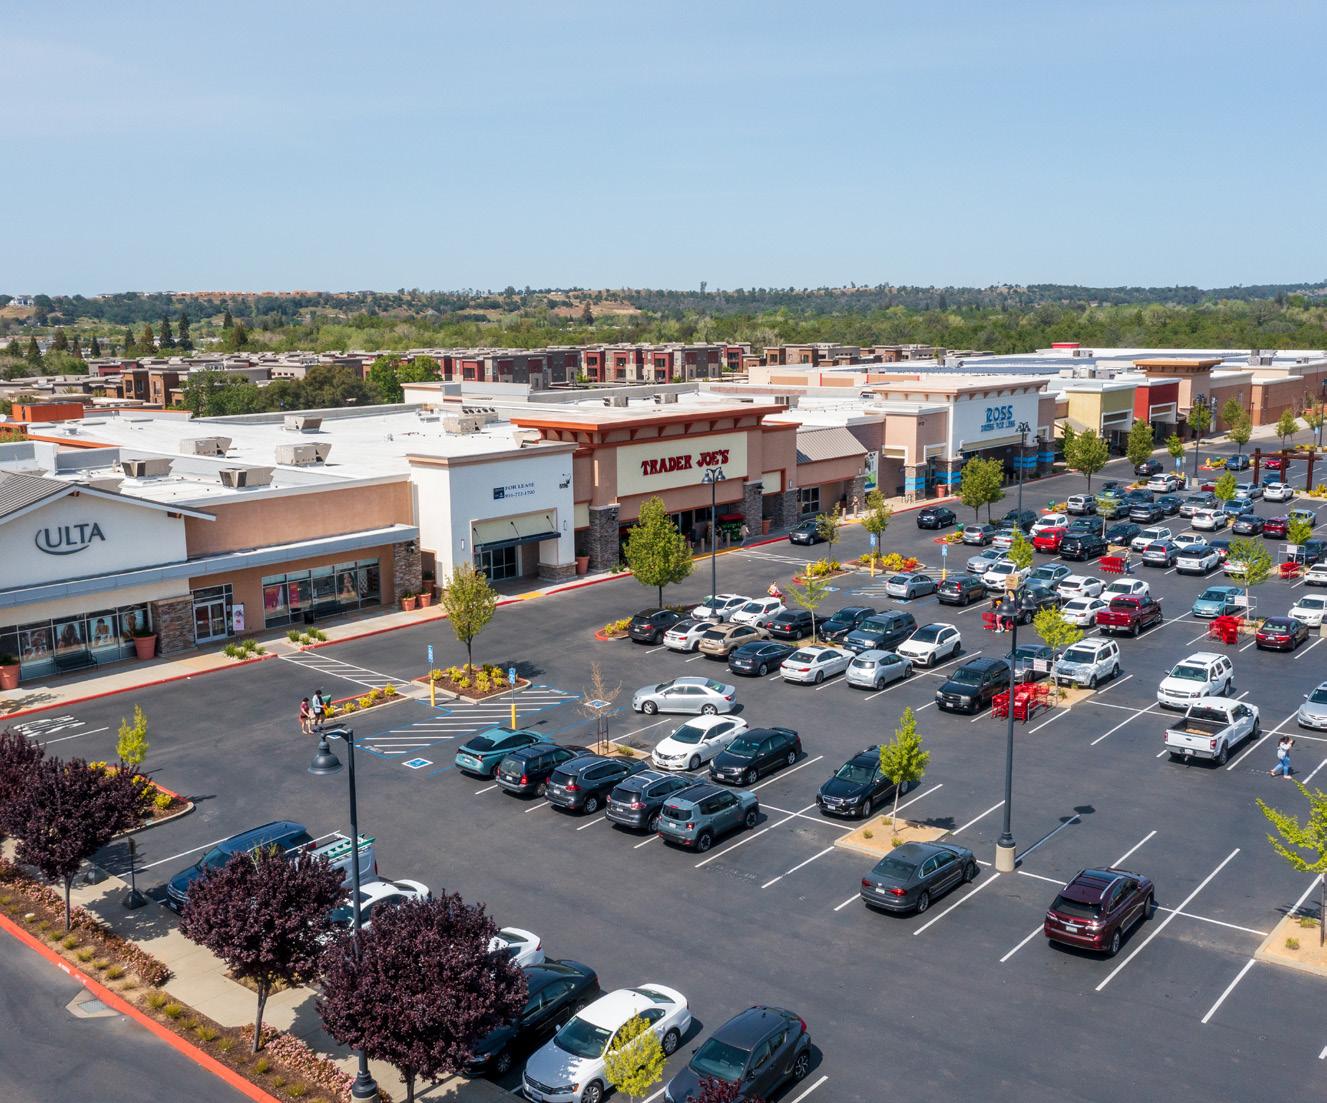
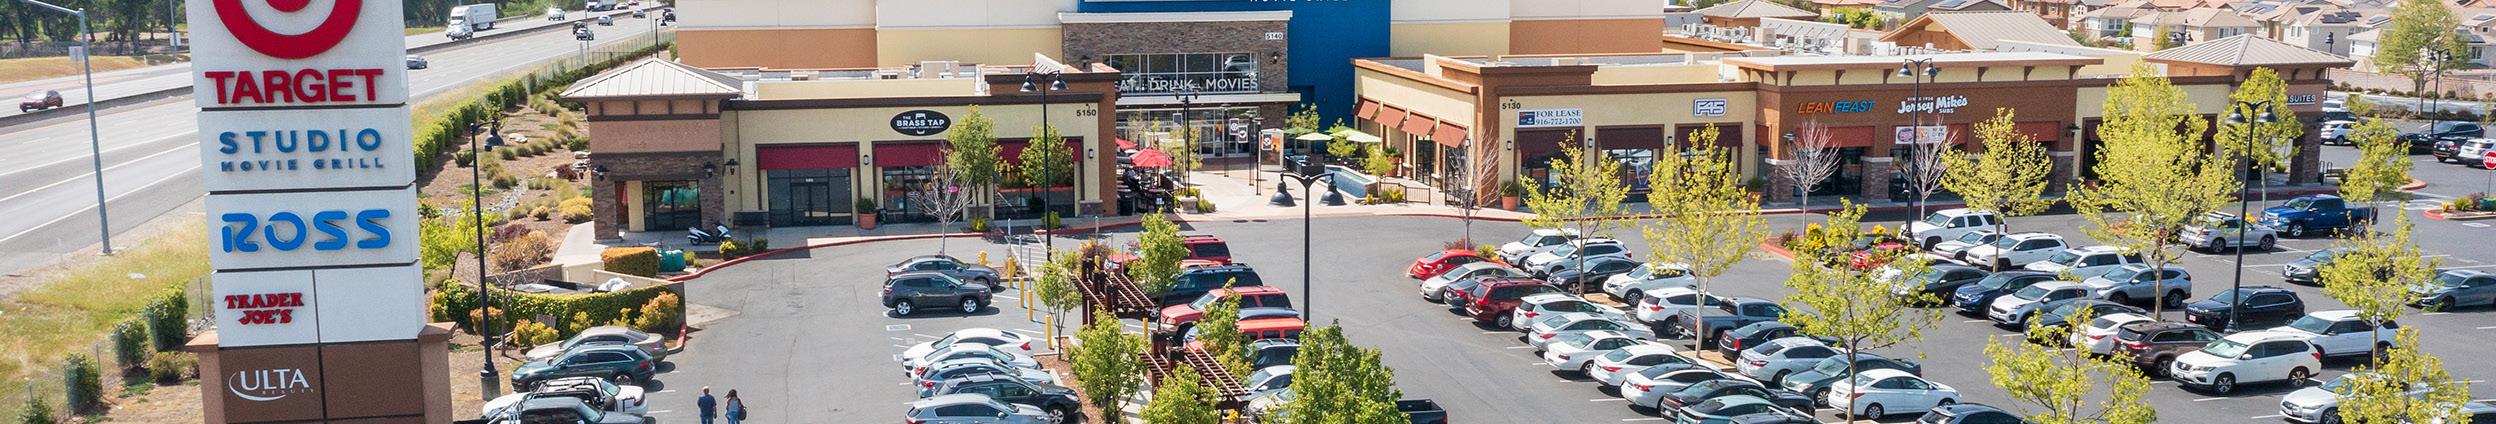
RETAIL MARKET OVERVIEW
RETAIL INVESTMENT OUTLOOK
MULTIFAMILY INVESTMENT OUTLOOK
GALLELLI TEAM PERSONNEL SHEET
FINAL
2 | GALLELLI REAL ESTATE PAGES 03 04-05 06 06-07 08 08-09 09 10 11 11 11 12 13 14 14 15 15 15-16 16 17 17 18-19 20-21 22 22-24 24 25-26 26 27-28 29 30
KEY TAKEAWAYS
SECTION 10
RECESSION OUTLOOK
CEILING RISK
DEBT
FROM PANDEMIC WHIPLASH TO THE EMERGENCE OF A
NORM INFLATION
NEW
PRICES COMING BACK TO EARTH CONSTRUCTION COSTS MODERATING STOCK MARKET WHIPLASH CORPORATE PROFIT SURGE NATIONAL UNEMPLOYMENT
UNEMPLOYMENT
UNEMPLOYMENT
CREDITS TABLE OF CONTENTS
FORECAST
ECONOMIC OVERVIEW AND FORECAST LOCAL CRE
THE DATA
TEN KEY TAKEAWAYS
Recent economic indicators suggest that the US economy may not necessarily experience an actual recession in 2023, but instead a year of flat growth, however, if a downturn occurs it is likely to be mild and brief.
2. 5. 8.
Inflation has turned the corner from peak levels in 2022 as the impact of Federal Reserve interest rate hikes continue to play out through the economy. But the Fed will likely continue to raise rates, albeit at a slower rate, through the first six months of 2023.
Office investment will continue to face challenges simply because of the uncertainties surrounding remote work impact. This will likely be the case heading into 2024 but could create opportunities for investors ahead of the curve.
3. 6. 9.
The Sacramento region economy is expected to fare better than other major California markets in 2023 due to continued strong population growth—primarily in-migration from higher cost of living markets in the Bay Area.
In 2022, the US retail market posted its strongest occupancy growth year in almost two decades. Sacramento experienced that trend starting in 2021, but 2023 will be a year in which retail leasing will remain on positive footing but will come back to earth. Class A space will remain difficult to find.
A slight uptick in industrial vacancy, greater deliveries in 2023 will mean more options for tenants that have struggled in recent years to find space in a deeply constrained market. While industrial demand is expected to cool from white hot to hot, the market may see higher deal level activity levels and continued rental growth in 2023 simply due to the availability of sorely needed product.
4. 7. 10.
Office vacancy nationally is anticipated to climb in 2023 due to the impact of space users economizing under-utilized space due to greater utilization of remote and hybrid work models. However, the Sacramento region will fare better than most US markets because of its high concentration of government and smaller professional users that are not expected to return as much space to market as large footprint corporate tenants.
In 2023 multifamily will experience its highest level of new deliveries since before the Great Financial Crisis. After 15 years of housing undersupply, as well as a sharp slowdown in single family residential activity, new product is sorely needed. The impact of interest rate hikes on housing affordability will benefit apartment landlords for the next few years, however, the aggressive rent growth the region has experienced over the past decade will slow as inflationary pressures impact renters.
Retail investment demand to continue to increase. Though cap rates for all asset types will increase in 2023 due to interest rate hikes, quality retail will continue to offer better yields than most industrial or multifamily product, while office product will likely be on the sidelines.
The Sacramento investment market will continue to face the challenge of a lack of available property for sale, as well as for exchange players to trade into. In 2023, deal activity will also continue to be challenged by the impasse between buyers and sellers created by economic uncertainty, with buyers looking for recession-induced deals and sellers looking to capture past pricing. This has already created a gulf between bids and asking prices. Until there is greater economic certainty this will issue will hamper deal flow.
SACRAMENTO ECONOMIC AND COMMERCIAL REAL ESTATE FORECAST | 3
1.
overview & forecast
2023: RECESSION OUTLOOK
Over the last half of 2022, the big question hanging over the US economy was whether the economy would move into recession. More specifically, the question was whether the pace of interest rate hikes by the FRB to tame rampant inflation would, or even could, succeed in bringing about a “soft landing” that wouldn’t send it into a downturn. There was good reason for this; the pace of interest rate hikes in 2022 was the fastest in its history. A total of seven rate hikes over the course of the year effectively doubled the target federal funds rate to 4.25% to 4.50%, with the central bank indicating more hikes were to come in 2023, though likely at a slower pace.
Adding fuel to the fire, one reliable economic indicator sounded a huge alarm for economists in 2022 from the bond market. Starting in April 2022, yields on short-term U.S. government debt (threemonth) vs. long-term (ten-year) inverted. Typically, U.S. government debt with a later maturity earns a higher interest rate than bonds with a shorter term. When the curve between those two rates inverts and suddenly short-term rates rise above longer-term rates, lending is impacted. Banks and lenders can earn more on their loans for shorter-term lending than they can on the kind of longer-term loans that fuel economic growth. This phenomenon—the inversion of the yield curve—has proven to be a reliable indicator for recessions in the modern era. Since 1980, the yield curve has inverted twelve times and, in eleven of those, a recession occurred within six to 18 months of this occurrence.
The reliability of this economic indicator alone would usually mean we were likely doomed to a downturn in 2023, although there has been nothing historically “normal” about economic activity in the pandemic era. Polling of the National Association of Business Economists (NABE) revealed that 64% respondents polled in October 2022 believed that the economy was either already in a recession or that we were likely to be in one over the next 12 months. But then a couple of things happened. After peaking at 9.0% in June 2022, inflation started to turn a corner. By December it had fallen to 6.4%, still well above the FRB target rate (2.0% range) but indicating that sharp interest rate hikes were having the intended result of cooling the economy. This is despite the continued resilience of the
US Retail Sales Monthly Change Shows Slow Return to Earth
US consumer—which is hugely significant because consumer spending drives nearly 70% of American GDP.
Though retail sales have been slowing slightly over the course of 2022 as inflation took a bite out of consumer buying power, they remained resilient. For example, between November and December 2022, U.S. retail sales fell -1.1%, but on an annual basis, the $677.1 billion that American consumers spent that month was still 6.0% above 2021 totals. While the annual rate of increase the prior year was 17.6%, keep in mind that for the 20 years prior to the pandemic the average annual increase in retail sales was typically in the 2.0% to 3.0% range.

US Retail Sales Annual Change Shows Continued Strength
4 | GALLELLI REAL ESTATE
Source:GallelliRealEstate;CensusBureau MIllions ($) YearoverYear Change -1.1% -1.5% -1.0% -0.5% 0.0% 0.5% 1.0% 1.5% 2.0% 2.5% $500,000 $550,000 $600,000 $650,000 $700,000 $750,000 Jan-2022 Feb-2022 Mar-2022 Apr-2022 May-2022 Jun-2022 Jul-2022 Aug-2022 Sep-2022 Oct-2022 Nov-2022 Dec-2022 ALL RETAIL TRADE AND FOOD SERVICES, Sales ($ Millions) % Y-o-Y Change; ALL RETAIL TRADE AND FOOD SERVICES
Source:GallelliRealEstate;CensusBureau MIllions ($) YearoverYear Change 6.0% -40.0% -20.0% 0.0% 20.0% 40.0% 60.0% $300,000 $400,000 $500,000 $600,000 $700,000 $800,000 Jan-2020 Mar-2020 May-2020 Jul-2020 Sep-2020 Nov-2020 Jan-2021 Mar-2021 May-2021 Jul-2021 Sep-2021 Nov-2021 Jan-2022 Mar-2022 May-2022 Jul-2022 Sep-2022 Nov-2022 ALL RETAIL TRADE AND FOOD SERVICES, Sales ($ Millions) % Y-o-Y Change; ALL RETAIL TRADE AND FOOD SERVICES Average Annual Retail Sales Growth 2000 – 2020 2.8% economic
The continued resilience of the American consumer, despite significant headwinds, was a critical reason why overall economic growth (GDP) has remained on positive footing. The U.S. Bureau of Economic Analysis shocked most economists in January 2023 when it released data indicating that GDP increased by 2.9% in the final quarter of 2022.
While GDP totals pleasantly surprised many economists, there was a slew of data late in 2022 that provided optimism. Despite increasing levels of layoffs, the job market remains extremely resilient. While layoffs have been on the rise—for example, combined cuts from major tech companies have accounted for over 80,000 layoffs in the past year—nearly every employment sector needs workers. Total job openings in the US remained near record levels as 2022 ended. While many media talking heads have been quick to compare current conditions to the economic malaise of the late 1970s and early 1980s by throwing around terms like “stagflation,” the reality is far from that truth. Stagflation means an economy with high inflationary pressures but little economic growth. The late 70s and early 80s were marked by both double-digit inflation and double-digit unemployment. Our current period has the significantly elevated inflation part of the equation, but near-record low unemployment. It is not currently stagflation at all—instead, it is uncharted territory for which there are no modern historical periods for comparison.
Meanwhile, so far, layoffs have almost exclusively come from some of the sectors that benefited immensely from pandemic conditions, hired aggressively, and now are trimming down as the new postpandemic “normal” begins to emerge. While we may be moving in on the three-year anniversary of CoVid-19’s arrival in the United States, that “new normal” is still being formed after years of one economic anomaly after the next.
The shifts have been significant enough that as of January 2023, the NABE conducted another survey of the top economists in the US and found that the rate of those who believed we were already in or were facing an imminent recession had fallen from 64% in October 2022 to 53% in January 2023. In other words, the prevailing wisdom of most prognosticators has moved from a 2023 recession being a near certainty to that of being a coin flip. They haven’t been the only ones encouraged by the latest data. JPMorgan Chase CEO Jamie Dimon who had predicted a 2023 economic “hurricane” last year, changed his forecast to “storm clouds.” Moody’s Analytics, one of the pre-eminent U.S. economic forecasting organizations, also upgraded their prognosis for the year ahead, stating that “the more likely scenario is a ‘slowcession,’ where growth grinds to a near halt but a full economic downturn is narrowly avoided.
Accurately predicting the economy is highly difficult under the best circumstances. The best indicators are typically asset price bubbles, but it is impossible to predict shocks to the system that unforeseeable “black swan” events can trigger. For example, the 2000/2001 collapse in tech stock pricing (“the tech wreck”) did not infect other sectors of the economy and was an isolated headwind on economic growth (though it certainly took its toll on high growth tech markets at the time) it did not spill over into becoming a national downturn until the September 11th attacks happened—pushing the US into one of its briefest, and ultimately mildest, recessions in its history.
There are many parallels between then and the current situation, due largely to the major price reset of tech stocks that has occurred over the past 14 months (and prompted layoffs from major players like Alphabet, Meta, Microsoft, etc.). But there is one big difference, the early tech players of the tech wreck largely did not have proven track records of profitability and were highly speculative investments. Outside of recent, still more speculative assets like cryptocurrencies, NFTs or metaverse real estate, nearly all the companies that have experienced the most significant stock price corrections have strong records of being immensely hugely profitable endeavors. Their valuations simply became disconnected from underlying business fundamentals because of the tsunami of capital that was unleashed by central banks across the globe early in the pandemic to keep a public health crisis from turning into a global depression. If anything, we anticipate that the economic whiplash of the last three years will come to an end in 2023 as a new post-pandemic norm finally begins to emerge.
Ultimately, the two most likely scenarios ahead are either a modest, but likely brief downturn, or a 2023 “slowcession” or “nocession,” in which growth is flat but does not veer into negative territory. Black swan events could derail either of those scenarios; for example, a spread and worsening of the Ukraine war or a potential default of the US on its debt as new debt ceiling debate showdown looms. The latter is likely the biggest risk factor that could potentially derail the current favored scenarios of either no recession, or modest one.
SACRAMENTO ECONOMIC AND COMMERCIAL REAL ESTATE FORECAST | 5
DEBT CEILING RISK
Total U.S. debt stood at roughly $31.5 trillion as this report went to press—its highest level on record. This equates to a future per capita tax liability of over $85,000 per person in the United States and is simply unsustainable in the long run. The last time the Federal Government balanced its budgets or operated in the black was in the late 1990s. This is a long-term challenge that must be dealt with by policymakers—sooner, rather than later. However, while the debt ceiling debate has surfaced multiple times over the past 20 years, it has primarily been used as a political game of chicken to force spending cuts. Perhaps the best analogy would be a household with a spending problem that, rather than address the problem of spending more than it takes in, just decides not to pay the bills it already has accrued. On a personal consumer level, all this would do is damage your credit and result in even more debt through higher interest rates and penalties. It’s not that different at the governmental level.
In 2011, the US came within days of defaulting on its debt before a deal was cut—causing the nation’s AAA credit rating to be lowered briefly for the first time in history. That move alone is estimated by the Government Accountability Office (GAO) to have increased government borrowing costs by $1.3 billion that year alone. It also rattled the global financial markets and sent stock prices into a tailspin with the NASDAQ falling -6.9%, S&P 500 dropping -6.7%, the
NYSE losing -7.1% and the Dow Jones shedding -5.6% of its value. Investors and 401Ks lost billions and market values did not return to where they had been until early 2012.
It is impossible to know the full economic impact that a default would have if it were to occur, but it would be severe to catastrophic. It would not just keep the government from paying employees, the military and issuing social security and other entitlement checks. It would send global financial markets into turmoil, possibly lead to bank collapses, and paralyze capital flows. It would guarantee recession, but almost certainly a severe one that could potentially match the 2008 Global Financial Crisis.
We think it highly unlikely that this will occur and that legislators won’t reach an accord before an actual default. However, it is likely that this year’s anticipated showdown on raising the debt ceiling could, like in 2011, come within days of it. If so, just as we saw in 2011, it will create additional economic headwinds for an economy already facing its fair share.
2023: FROM PANDEMIC WHIPLASH TO THE EMERGENCE OF A NEW NORM
There have been a whole lot of economic buzzwords thrown since the arrival of the pandemic that, no doubt, you are likely as sick of hearing as analysts are as sick of using. Acceleration, agility, digital disruption, new normal, unprecedented, etc., the list goes on and on. Indeed, nearly three years after the US start of the pandemic, it is challenging for economists to conduct business as usual because that typically means comparing historical behavior to current conditions and extrapolating forecasts based upon that. But nothing economically over the last three years has a precedent. The last economic “normal” we had was in February 2020, before CoVid-19 exploded in this country. But the impact of that public health crisis, and then the steps we collectively took to avert financial disaster, haven’t just been unprecedented, but their impacts could best be described as the one buzzword that probably should have been used: whiplash.
In six weeks from March to April 2020, global stock markets lost an estimated $7 trillion in value, setting off unprecedented reactions from governments and central banks. The resulting wave of economic stimulus was both global and unprecedented. In the United States, it came out to a price tag of roughly $7 trillion ($3 trillion in bond purchases to stabilize the stock market and $4 trillion in forgivable small business loans or direct aid to individuals). Adjusted for inflation, the US spent $5.5 trillion on WWII. The resulting wall of money would have immense impact on the US economy.
6 | GALLELLI REAL ESTATE
The stock market, after nearly crashing in April, had regained its losses by August 2020 and by November 2021 it had gained another 50% in value--before it began to come back to earth. The housing market, which saw activity fall off a cliff in the initial months of the pandemic, was surging by the second half of 2020. By June 2021, the average home price in the US had surged 44.5% over where it had been pre-CoVid—before it began to come back to earth. US venture capital investment, which had averaged $81.5 billion annually from 2010 through the end of 2019, spiked to $169 billion in 2020 and then doubled to over $320 billion in 2021—before starting to slow in 2022.
Early winners from pandemic lockdown era conditions all saw immense spikes in value but are now normalizing. While these corrections are painful for anyone that has checked their 401k balances or likely home valuations today against peak values, they may prove to be a good thing in the long run. Corrections are what prevent much more painful busts. Early winners from pandemic lockdown era conditions all saw immense spikes in value but are now coming back to earth. As you will see in the data section of our report, the stock market was clearly in bubble territory by late 2021.
As for the housing market, though it will continue to feel pain in 2023 with the Fed likely to hike interest rates at least twice early in the year (if not more), it will likely play out as a correction. The absence of the kind of toxic loan product (adjustable rate, stated income loans, etc.) in the marketplace that drove the 2006 housing meltdown and subsequent financial crisis is one reason. The decade-plus of residential underbuilding in most markets is another. Prices are, and will continue, to reset downward as the price of money goes up. But the housing market is not likely to collapse under these stresses. While there are certainly asset classes that are going to face a challenging year ahead (for commercial real estate, the office market in particular), there are no glaring asset bubbles likely to burst in 2023 that would have the power to crash the US economy.
Looking forward, while we see multiple headwinds and plenty of potential crisis points that could negatively impact the economy, but we anticipate that 2023 will be a year in which the chaotic highs and lows of the past three years finally smooth out and the long theorized post-pandemic norm finally materializes. This should be the case whether the economy avoids recession completely or if it has a brief, but mild one. It likely won’t hold true, however, if any black swan events tip the economy into something much more severe. But assuming our forecast holds, the Sacramento region’s commercial real estate market is poised to perform better than most in 2023 for multiple reasons.
SACRAMENTO ECONOMIC AND COMMERCIAL REAL ESTATE FORECAST | 7
the data
INFLATION
According to the Federal Reserve Bank (FRB), annual inflation, as measured by the Consumer Price Index (CPI) registered at 6.4% as of December 2022.
In the 20 years prior to the pandemic, the CPI averaged 2.2% annually on any given month. Keep in mind that these averages include the substantial downturn periods of the Great Financial Crisis (2008 – 2010) and the early months of the pandemic. But overall, inflation in the US was in its lowest long-term period in recorded history.
Then came CoVid, shutdowns, massive stimulus, supply chain disruptions, and then an invasion that threatened global energy supply lines. In other words, a perfect cocktail for sending inflation through the roof very quickly. While initial increases were driven by Americans with more retail spending power (demand), combined with a CoVid-overwhelmed (especially for Chinese imported goods) supply chain. Reduced domestic oil production had already exasperated energy pricing by late 2021 as Americans returned to the road. US oil production had peaked at 13 million barrels per day in November 2019, but fell as low as 9.7 million barrels a day by May 2020. By the time that Russia sent global energy markets
Gas Prices Coming Back to Earth
Inflation Has Peaked Interest Rate Hikes Showing Impact

into turmoil with its invasion of Ukraine in February 2022, US oil production was still down 13.1% from peak.By June 2022, year-over-year price inflation peaked at 9.0%. This was the highest rate of inflation since the early 1980s and prompted the aggressive action of the Federal Reserve in raising interest rates to slow the economy.
As of December 2022, the overall CPI rate had fallen to 6.4%. It is anticipated
to continue to decline, but this relies immensely upon further moves of the Fed in addition to global political and economic events. We anticipate, barring any unforeseen “black swan” events that the downward trend in inflation will continue but that it is not likely to fall below the 4.0% annual rate by year end unless a dire economic situation unfolds. Luckily, we do not anticipate the latter either.
GAS PRICES COMING BACK TO EARTH
The current wave of inflation is global. Its initial roots were in the massive amount of government stimulus that Central Banks across the world unleashed to prevent a depression in the wake of the CoVid-19 crisis. In the US, this amounted to $7 trillion in stimulus; approximately $3 trillion in Treasury bond purchases to stabilize the stock market and an additional $4 trillion in direct aid to businesses and individuals. By comparison, adjusted for inflation the US spent roughly $5.5 trillion on World War II.
While moves like this across the world had the intended effect of stabilizing economies, the impact of massive amounts of money being pumped into the global
8 | GALLELLI REAL ESTATE
Source:GallelliRealEstate;FederalReserve -38.6% 62.0% 62.2% -1.1% -60.0% -40.0% -20.0% 0.0% 20.0% 40.0% 60.0% 80.0% $0.00 $1.00 $2.00 $3.00 $4.00 $5.00 $6.00 2019-01-01 2019-03-01 2019-05-01 2019-07-01 2019-09-01 2019-11-01 2020-01-01 2020-03-01 2020-05-01 2020-07-01 2020-09-01 2020-11-01 2021-01-01 2021-03-01 2021-05-01 2021-07-01 2021-09-01 2021-11-01 2022-01-01 2022-03-01 2022-05-01 2022-07-01 2022-09-01 2022-11-01 2023-01-01 U.S. All Grades All Formulations Retail Gasoline Prices Dollars per Gallon % Annual Change YearoverYear Change (Inflation Rate) USA Average Price Per Gallon ($), All Formulations
Source:GallelliRealEstate;FederalReserve Index: 1982 –1984 = 100 YearoverYear Change (Inflation Rate) 9.00% 6.42% 0.0% 2.0% 4.0% 6.0% 8.0% 10.0% 220.000 240.000 260.000 280.000 300.000 320.000 2020-01-01 2020-03-01 2020-05-01 2020-07-01 2020-09-01 2020-11-01 2021-01-01 2021-03-01 2021-05-01 2021-07-01 2021-09-01 2021-11-01 2022-01-01 2022-03-01 2022-05-01 2022-07-01 2022-09-01 2022-11-01 CPI for All Urban Consumers: All Items in Average US City Average % Annual Change
GAS PRICES COMING BACK TO EARTH CONT.
economy was bound to have a major impact on equilibrium between supply and demand. Too much money suddenly chasing the same (or reduced) amount of goods, services, or assets available is a surefire recipe for rapid price acceleration.
The exposure of the fragility of global supply chains in an international crisis is another that started to drive inflationary pressures by 2001. The Chinese zero tolerance policy for CoVid until 2023 meant the world’s largest manufacturing economy has been prone to shutdowns, output reductions and shipping issues at a time in which US demand for goods climbed.
But the greatest factor driving inflation recently has been the impact of Russia’s invasion of Ukraine. After the US and Saudi Arabia, Russia is the third largest oil producer and accounted for 11% of the world’s supply in 2021. After the US, it is the second largest producer of natural gas on earth. The February 2022 invasion sent energy pricing skyward globally.
The national average price of a gallon of gasoline in February 2020 was $2.47 per gallon. The pandemic crashed the market, with this metric falling to just $1.77 per gallon by late April 2020—lows not recorded since the darkest days of the Great Financial Crisis.

Cost of Construction Materials Also Moderating
Pricing began to accelerate aggressively with the lifting of lockdowns, as oil producers looked to make up for lost time and revenue. On the eve of the Ukrainian invasion the average price per gallon stood at $3.53, up a whopping 43.1% over the pre-pandemic price. With the war, price acceleration would explode further, hitting a peak of $5.01 per gallon in June of last year—more than double the prepandemic price.
Since then, oil and gas prices have been coming back to earth. As of January 16, 2023, the national average stood at $3.31 per gallon, or 1.1% below where pricing was one year earlier.
CONSTRUCTION COSTS MODERATING
One of the most challenging issues facing the real estate industry over the past two years has been the run up in the price of construction materials. According to the FRB’s data, pricing began to ramp up in September 2020. Pricing climbed 35.1% in 2021. The highwater mark came in May 2022 when pricing stood at 50.1% above pre-pandemic (February 2020) levels. Keep in mind that in the 20-year period before the pandemic, construction costs averaged price growth of 2.8% per year.
The good news is that pricing has been steadily coming back to earth since. But as of December 2022, they still stood at 39.4% above where pricing was before the CoVid crisis.
This has been a major factor in slowing residential development over the past two years, even when the housing market was experiencing an unprecedented boom between late 2020 and early 2022. It also has had major impacts for ongoing commercial development, redevelopment, and tenant build-outs—particularly for industrial and multifamily projects, which have been driving commercial real estate development over the past few years. If these elevated construction costs cannot be passed on by developers in pricing or rents, potential profitability is challenged and development levels will be hampered.
SACRAMENTO ECONOMIC AND COMMERCIAL REAL ESTATE FORECAST | 9
Source:GallelliRealEstate;FederalReserve 39.4% -0.5% -10.0% 0.0% 10.0% 20.0% 30.0% 40.0% 50.0% 225.0 275.0 325.0 375.0 2020-01-01 2020-03-01 2020-05-01 2020-07-01 2020-09-01 2020-11-01 2021-01-01 2021-03-01 2021-05-01 2021-07-01 2021-09-01 2021-11-01 2022-01-01 2022-03-01 2022-05-01 2022-07-01 2022-09-01 2022-11-01 Consumer Price Index: Construction Materials % Annual Change Index: 1982 = 100 YearoverYear Change (Inflation Rate)
Stock Market Whiplash
STOCK MARKET WHIPLASH
Entering 2020, the greatest potential economic threat that kept most economists up at night was that stock market values were becoming unsustainably high and there may be a bubble in the making. But then the pandemic hit, and global markets had shed an astounding $7 trillion of value by April 2020. Moves by Central Banks across the world (including the US Treasury purchasing $3 trillion in bonds) stabilized the market quickly. By August 2020, markets had regained that $7 trillion. And then they began to soar. By the time they peaked in November 2021, global markets were up 45.0% from where they stood before the crisis.
This rate of growth simply was not going to be sustainable in the long-run and was increasingly leading to company valuations that were completely disconnected from reality.
The Shiller Price to Earnings (P/E) Ratio measures the price of a stock, divided by the average of ten years earnings, adjusted for inflation. It is a measurement for judging whether the prices investors are paying for stocks make sense based upon their underlying fundamentals. When investors pay too much for an asset, bubbles are created. Eventually those bubbles burst and that is how recessions usually occur.
The average reading of the Shiller P/E ratio since 1990 is 26.6. The all-time high for this metric came in December 1999 when it hit 44.2—within six months, the tech collapse occurred. Spikes in the Shiller PE ratio preceded the Black Tuesday collapse of 1929 that led to the Great Depression, as well as the Black Monday crash of 1987.
The second highest reading ever recorded by the Shiller P/E index was in January 2022 when it hit 36.9. There is a substantial upside to the stock market’s downward reset last year as market pricing had become disconnected from underlying fundamentals. The continuation of that trend would have likely driven a significant stock market crash that would have created much more economic damage than what occurred. The current P/E ratio of 28.7 is close to historic norms that enable sustainable growth. In other words, there is no longer a potential stock market bubble waiting to burst and, given the right economic conditions, the market is set to soar again.
Source:GallelliRealEstate;FederalReserve Index YearoverYear Change 43.77 36.94 28.65 0.0 10.0 20.0 30.0 40.0 50.0 1/1/90 1/1/91 1/1/92 1/1/93 1/1/94 1/1/95 1/1/96 1/1/97 1/1/98 1/1/99 1/1/00 1/1/01 1/1/02 1/1/03 1/1/04 1/1/05 1/1/06 1/1/07 1/1/08 1/1/09 1/1/10 1/1/11 1/1/12 1/1/13 1/1/14 1/1/15 1/1/16 1/1/17 1/1/18 1/1/19 1/1/20 1/1/21 1/1/22 1/1/23 Shiller P/E Ratio
Shiller P/E Ratio
Source:GallelliRealEstate;FederalReserve Index YearoverYear Change -40.0% -20.0% 0.0% 20.0% 40.0% 60.0% 80.0% 100.0% 100 125 150 175 200 225 250 2020-01-01 2020-03-01 2020-05-01 2020-07-01 2020-09-01 2020-11-01 2021-01-01 2021-03-01 2021-05-01 2021-07-01 2021-09-01 2021-11-01 2022-01-01 2022-03-01 2022-05-01 2022-07-01 2022-09-01 2022-11-01 2023-01-01 Wilshire 5000 Y-o-Y % Change Pre-Pandemic Peak
Corporate Profit Surge
US Unemployment Rate Back to 50-Year Low
CORPORATE PROFIT SURGE
Despite the growing economic concerns and turmoil of 2022, it turned out to be a banner year for corporate profits. The FRB tracks quarterly corporate profits, after taxes. As of the close of Q3 2022, annual corporate profits were up 45.6% annually.
This may seem hard to fathom in an inflationary environment, but the hard truth is that large corporations are much more able to shield themselves from those costs than small businesses due to their size, buying power and dominance in the market. Though by year-end 2022 we were seeing a steady drumbeat of corporate layoffs (mostly media and tech), this means that most companies are sitting on healthy balance sheets—which bodes well for their ability to ride out whatever economic scenario unfolds in 2023.
California Unemployment Back to Record Lows
NATIONAL UNEMPLOYMENT
According to the US Bureau of Labor Statistics (BLS), the national unemployment rate stood at just 3.5% as of December 2022 (the latest data available as this report went to press). This is back to the pre-pandemic rate that was posted in February 2020, just prior to lockdowns. At that time, the unemployment rate was the lowest it had been since 1967.
STATEWIDE UNEMPLOYMENT
This same trend has played out for unemployment throughout the State of California. As of December 2022, it stood at 4.1% (slightly elevated over the national level), but had returned to pre-pandemic record lows, despite ongoing economic concerns.
SACRAMENTO ECONOMIC AND COMMERCIAL REAL ESTATE FORECAST | 11
Source:GallelliRealEstate;FederalReserve Billions ($) YearoverYear Change 45.6% -20.0% 0.0% 20.0% 40.0% 60.0% $0 $1,000 $2,000 $3,000 $4,000 2015-07-01 2015-10-01 2016-01-01 2016-04-01 2016-07-01 2016-10-01 2017-01-01 2017-04-01 2017-07-01 2017-10-01 2018-01-01 2018-04-01 2018-07-01 2018-10-01 2019-01-01 2019-04-01 2019-07-01 2019-10-01 2020-01-01 2020-04-01 2020-07-01 2020-10-01 2021-01-01 2021-04-01 2021-07-01 2021-10-01 2022-01-01 2022-04-01 2022-07-01 Quarterly Corporate Profits (After Tax) $Billions % Annual Change
Source:GallelliRealEstate;BureauofLaborStatistics 4.1% 15.9% 4.1% 2.0% 5.0% 8.0% 11.0% 14.0% 17.0% J20 F20 M20 A20 M20 J20 J20 A20 S20 O20 N20 D20 J21 F21 M21 A21 M21 J21 J21 A21 S21 O21 N21 D21 J22 F22 M22 A22 M22 J22 J22 A22 S22 O22 N22 D22 California Unemployment Rate
Source:GallelliRealEstate;BureauofLaborStatistics 3.5% 14.8% 3.5% 2.0% 5.0% 8.0% 11.0% 14.0% 17.0% J20 F20 M20 A20 M20 J20 J20 A20 S20 O20 N20 D20 J21 F21 M21 A21 M21 J21 J21 A21 S21 O21 N21 D21 J22 F22 M22 A22 M22 J22 J22 A22 S22 O22 N22 D22 U.S. Unemployment Rate Unemployment by Educational Level, December 2022: 3.5% Overall 1.9% Bachelor’s Degree or Higher 2.9% Some College or Associate’s Degree 3.6% High School Graduate Only 5.0% Less Than High School Diploma
LOCAL UNEMPLOYMENT
The unemployment rate for the Sacramento region stood at 3.7% as of December 2022. This also reflects a return to pre-CoVid levels. Not only is this lower than the statewide average, but it also compares favorably to all other inland California markets:
Sacramento Region Unemployment Lower Than State, Inland Averages
12 | GALLELLI REAL ESTATE
Source:GallelliRealEstate;BureauofLaborStatistics 3.7% 14.2% 3.7% 2.0% 5.0% 8.0% 11.0% 14.0% 17.0% J20 F20 M20 A20 M20 J20 J20 A20 S20 O20 N20 D20 J21 F21 M21 A21 M21 J21 J21 A21 S21 O21 N21 D21 J22 F22 M22 A22 M22 J22 J22 A22 S22 O22 N22 D22 Sacramento Region Unemployment Rate Bakersfield 6.8% Fresno 6.6% Inland Empire 4.2% Los Angeles 4.4% Modesto 5.5% Oakland/East Bay 3.2% Orange County 3.0% Sacramento 3.7% San Diego 3.3% San Francisco 2.2% San Jose 2.4% Santa Barbara 3.2% Stockton 5.5%
US Employment Up 1.2 Million Jobs From Pre-Pandemic Levels
US EMPLOYMENT GROWTH SINCE THE PANDEMIC
As of December 2022, total employment in the US had not only rebounded from pre-pandemic levels, but—over the course of 2022— surpassed them. This is even though roughly four million Americans dropped out of the workforce in 2020 and have yet to return (nearly three million alone opted for early retirement and are not likely to return to the workforce). Hence, the record low unemployment, and the likelihood of protracted labor shortages in the future as the trend of baby boomers retiring continues to escalate.
The Labor Force Participation Rate stood at 63.4% in February 2020. It fell to just 60.2% by April of that year. Since that time, it has improved considerably to the current rate of 62.3% thanks to a hot labor market and rising wages.
Yet, the economy has added 1.221 million new positions since 2020. Not all categories have fully rebounded. The Leisure & Hospitality sector (which includes hotels and restaurants) remains down 864,000
jobs. Government shed 394,000 positions while Other Services lost 160,000 jobs.
The biggest winner has been Professional & Business Services (+957,000). In fact, the three major categories that account for most office use (Financial Activities, IT and Professional & Business Services) together account for more 1.226 million total jobs—more than the market as a whole.
Historically, office-using employment growth was a reliable indicator for future office real estate demand, with the average tenant typically housing anywhere from four to six workers per 1,000 square feet (SF) of space. The explosion of work-from-home (WFH) and hybrid work arrangements since the pandemic has, at least temporarily, rendered projections based on past norms nearly impossible. However, this strong level of growth is sure to be a mitigating factor in the wave of office space consolidation that is anticipated in 2023.
SACRAMENTO ECONOMIC AND COMMERCIAL REAL ESTATE FORECAST | 13
Source:Gallelli RealEstate;BureauofLaborStatistics 129 324 (394) (864) 135 (46) (160) 180 664 (3) 30 122 147 957 -1,200 -800 -400 0 400 800 1,200 Construction Education & Health Services Government Leisure & Hospitality Manufacturing Mining & Logging Other Services Retail Trade Transportation & Warehousing Utilities Wholesale Trade Financial Acivities Information Professional & Business Services
in Employment (February 2020 vs. December
Office Using Employment c
Difference
2022)
+1.221 MILLION JOBS ADDED THE LABOR FORCE PARTICIPATION RATE 62.3% PROFESSIONAL & BUSINESS SERVICES +957,000 JOBS GOVERNMENT -394,000 JOBS LEISURE & HOSPITALITY SECTOR -864,000 JOBS
CALIFORNIA EMPLOYMENT GROWTH SINCE THE PANDEMIC
US LABOR MARKET STILL HOT, DESPITE ECONOMIC CONCERNS
The BLS has tracked Job Openings and Labor Turnover (the JOLTs report) only since 2000. This data typically lags the monthly unemployment figures by one month. The most current data available as this report went to press was November 2022.
As of November 2022, there were a total of 10.5 million available positions in the US according to the BLS. While this number has steadily been dropping since peaking at 11.9 million in March 2022, it is critical to note that the number of available jobs in March of this year was a record since the BLS began recording this data over 20 years ago.

Similar labor trends have played out in the Golden State. While Leisure & Hospitality, Government, Other Services, Manufacturing, and Mining & Logging all have shed employment since 2020 but the remaining categories have posted enough gains to offset those losses.
All told, the state has created 89,000 more jobs than there were before the pandemic. The three categories that make up the lion’s share of office using employment have alone created more than 124,000 positions.
To put this in perspective, there were 6.3 million available jobs at the close of 2017—a year in which the economy was relatively healthy. There are now roughly 40% more positions available, despite elevated inflation and economic concerns, than there were then.
US Job Openings Still Near Record Levels
14 | GALLELLI REAL ESTATE California Employment Up 89K Jobs; Up 124K Office Using Positions Source:GallelliRealEstate;BureauofLaborStatistics 17 122 (73) (108) (12) (4) (36) 59 10 13 101 -400 0 400 Construction Education & Health Services Government Leisure & Hospitality Manufacturing Mining & Logging Other Services Trade, Transportation & Utilities Financial Acivities Information Professional & Business Services California Difference in Employment (February 2020 vs. December 2022) Office Using Employment c
Source:GallelliRealEstate;BureauofLaborStatistics 11,855 10,458 0 2,000 4,000 6,000 8,000 10,000 12,000 14,000 2000 2001 2002 2002 2003 2003 2004 2005 2005 2006 2006 2007 2007 2008 2009 2009 2010 2010 2011 2012 2012 2013 2013 2014 2014 2015 2016 2016 2017 2017 2018 2019 2019 2020 2020 2021 2021 2022 USA Monthly Job Openings (in thousands)
California Job Openings Near Record Levels
CALIFORNIA LABOR MARKET AMONG THE HOTTEST
As of November 2022, there were 1.2 million available jobs in California, accounting for 8.8% of all job openings in the US. While this number has fallen by 91,000 since the March 2022 peak, it still demonstrates a robust—albeit gradually slowing—job market. Unfortunately, the BLS does not break this data out at the local market level, but any reading of the data supports a strong market for employment seekers in the Sacramento region.
USA JOB OPENINGS BY PROFESSION
USA Job Openings by Profession
Service jobs, which include Leisure & Hospitality (1.5 million), as well as Retail Trade (900,000) combine for 2.4 million available positions. Should a recession occur, these two fields—typically among the lowest earning— would benefit from a weaker labor market.
The reality is that even with the growing economic clouds of the past year, every single major employment category in the US is in serious need of workers.
WAGE GROWTH
Even as job openings continue to fall in the wake of economic uncertainty and the FRB’s moves to cool the economy to tame inflation (including the knowing impact on the job market), there have been few times in recent economic history where employment was as readily available to those seeking it as now.
According to the latest BLS JOLTS report, there were nearly 10.5 million available positions in the US as of November 2022. The adjacent graph breaks those job openings out by general profession. Though we anticipate these numbers to continue to shrink in the face of FRB rate hikes going deeper into 2023, the current levels of demand (even if they were to fall by 50%) would still suggest a relatively strong job market.
Healthcare and Education, clobbered by the pandemic, has nearly 2.1 million jobs available. Professional & Business Services isn’t far behind at just over 2.0 million available jobs. Add those to the other two categories of office-using employment and there are a whopping 2.7 million jobs available. Again, this will be a mitigating factor in office space givebacks in 2023—even though it may be a challenging year for that product type.
The immense tightness of the labor market has been one of the many driving forces behind recent inflation. As we discussed earlier in this report, there were multiple factors that played out simultaneously to bring us where we were and where we are now—which is improving but remains deeply challenging.
For the 20 years prior to the pandemic, the average annual wage growth of the American worker was 3.7%. Then came the whiplash of the devastation of pandemic lockdowns, followed by the firehose of federal aid, the stabilization of markets and then the explosion of spending as that aid trickled through every single level of the economy.
Starting in May 2021 (15 months from the beginning of lockdowns), we saw wage growth start to explode as labor demand skyrocketed. The reason was simple; 15 months out from the pandemic winners and losers had already been sorted out. And the winners needed labor and they needed it fast.
SACRAMENTO ECONOMIC AND COMMERCIAL REAL ESTATE FORECAST | 15
Source:GallelliRealEstate;BureauofLaborStatistics 1,298 1,207 0 200 400 600 800 1,000 1,200 1,400 1,600 2012 2012 2012 2013 2013 2013 2014 2014 2014 2015 2015 2015 2016 2016 2016 2017 2017 2017 2018 2018 2018 2019 2019 2019 2020 2020 2020 2021 2021 2021 2022 2022 2022 California Monthly Job Openings (in thousands) c
Source:GallelliRealEstate;BureauofLaborStatistics 388 2,090 957 1,519 779 40 295 887 486 4 261 514 211 2,026 0 400 800 1,200 1,600 2,000 2,400 Construction Education & Health Services Government Leisure & Hospitality Manufacturing Mining & Logging Other Services Retail Trade Transportation & Warehousing Utilities Wholesale Trade Financial Acivities Information Professional & Business Services Job Openings (Seasonally Adjusted November 2022) Office Using Employment
WAGE GROWTH CONT.
By August 2022, wage growth had hit 6.7% annual growth. Sadly, for workers who had enjoyed an unprecedented run-up of wage growth over the previous 16 months, this metric simply did not keep up with overall inflation during this period. Which is normal, because when employers must raise wages—they upwardly adjust prices. So, while the average American worker has received the most substantial raises in their wages in 30 years, it has all been gobbled up by cost-of-living increases. But it is critical to note that wage increases alone create inflationary pressures in the economy.
According to the FRB, year-over-year wage growth in December 2022 stood at 6.1%. While this was down from the August 2022 peak of 6.7%, it is still nearly double where the pre-pandemic average had been for two decades. With overall inflation down to 6.4% during the same time, we are witnessing something relatively rare— where total inflation has fallen below wage inflation.
Wage Growth (Y-o-Y)
US Personal Savings Rate
It is not likely to last for a long time. As overall inflation comes back to earth, as job openings also come back to earth (though at an elevated level), wage inflation is also likely to follow.
Given the complexities of the current economic situation, a return to past historical (and sustainable) norms, is likely a good thing for the overall economic outlook.
US PERSONAL SAVINGS RATE
According to the FRB, from 2000 through 2020 the average American saved 5.9% of their monthly disposable income. That number skyrocketed to 33.8% in April 2020, as consumers fearful of the economic impacts of the pandemic engaged in widespread panic saving. The disparate impact of lockdowns meant frontline service workers felt the brunt of the challenges, while most professional positions simply adapted to working remotely.
As the early fog of pandemic lockdowns began to lift for most American workers, the savings rate slowly began to move back towards historic norms. The arrival of massive amounts of Federal aid in early 2021 saw the savings rates spike once again; to 19.9% in January 2021 and then again in March 2021
to 26.6% as waves of stimulus funds flooded the market. Meanwhile, a suddenly booming stock market and rapidly rising home values in the wake of the CoVid suburban exodus, suddenly meant that many Americans not directly impacted by lockdowns, were suddenly flush with cash.
This was one of multiple factors that led an 18- month surge in retail spending that only began to come back to earth in 2022 as inflationary pressures started to take their toll on consumer wallets. But while month-over-month retail sales have been on a slow trajectory downward over the final half of 2022 (typically averaging in the -1.0% to -1.5% per month range). Year-over-year metrics have remained elevated. While retail sales fell between November and December 2022, they remained up 6.0% over the same period a year before. Though slowing, retail sales have remained strong. But one of the reasons for this is that consumers have increasingly been dipping into their nest eggs to cope with the impact of 2022’s surge in pricing. The latest data available indicates that the US personal savings rate had dropped to just 2.4% in November 2022 and is likely to fall further. Though the consumer has remained resilient, the slow slide in retail sales is likely to accelerate over the first half of 2023. It’s performance over the final half of the year depends largely upon whether the trend of falling inflation can continue—particularly if the Fed can engineer a “soft landing” of the economy without tipping it into recession.
16 | GALLELLI REAL ESTATE
6.7 6.1 0.0 1.0 2.0 3.0 4.0 5.0 6.0 7.0 8.0 3/1/1997 3/1/1998 3/1/1999 3/1/2000 3/1/2001 3/1/2002 3/1/2003 3/1/2004 3/1/2005 3/1/2006 3/1/2007 3/1/2008 3/1/2009 3/1/2010 3/1/2011 3/1/2012 3/1/2013 3/1/2014 3/1/2015 3/1/2016 3/1/2017 3/1/2018 3/1/2019 3/1/2020 3/1/2021 3/1/2022 Wage Growth % 20-Year Average (2000 – Pandemic): 3.7% August 2022: 6.7% December 2022: 6.1%
Source:GallelliRealEstate;FederalReserve
33.8 26.6 2.4 0.0 5.0 10.0 15.0 20.0 25.0 30.0 35.0 40.0 2020-01-01 2020-03-01 2020-05-01 2020-07-01 2020-09-01 2020-11-01 2021-01-01 2021-03-01 2021-05-01 2021-07-01 2021-09-01 2021-11-01 2022-01-01 2022-03-01 2022-05-01 2022-07-01 2022-09-01 2022-11-01 Personal Savings Average Rate
Source:GallelliRealEstate;FederalReserve Personal Savings Rate, Percent of Total Income Average 2000 until 2020: 5.9%
US Bank Deposits
into their savings to deal with the impacts of inflation.
HOW MUCH DO AMERICANS HAVE IN THE BANK?
The FRB tracks the amount of money held in U.S. banking and savings accounts. As of February 2020, Americans had approximately $13.5 trillion dollars in the bank. That number stayed flat in the initial days of the pandemic, but then began to soar as stimulus began to flow through every portion of the economy. The purchase of roughly $3 trillion in bonds by the Treasury Department in April 2020, stabilized the stock market and then set it soaring. Another $4 trillion in small business (forgivable PPP loans) and direct aid began flowing through the economy. And some industries (media, tech, etc.) simply boomed due to the nature of the crisis even as workers involved in retail, hospitality and travel faced outsized challenges. Meanwhile, rising home values bolstered the wealth of homeowners in virtually every US market. The net result is that by March 2022, Americans were sitting on a record $18.2 trillion dollars in their bank accounts. This windfall of more than $4.8 trillion dollars helped to fuel the record retail spending, stock market, business, and real estate investment that, in turn, ultimately became huge inflationary pressures.
Since March 2022, Americans have been dipping into those savings. As of January 2023, there was a total of $17.7 trillion in US bank accounts—reflecting a decrease of roughly half a billion dollars in nine months. While we anticipate inflationary pressures will continue to gradually bring this number back to earth, it is critical to note that these are still near record levels of wealth. Assuming we have turned the corner on inflation going forward, this metric bodes well for the economy. Whether 2023 brings a mild recession or a flat growth “no-cession” or “slow-session,” it will almost certainly be the American consumer that keeps the lights on.
Total Consumer Debt
TOTAL CONSUMER DEBT
On the eve of the pandemic, total outstanding U.S. consumer debt stood at $852 billion. In the initial wave of panic saving, we also saw a movement of debt paydowns driven largely by affluent consumers. Later, the impact of stimulus checks and the rising tide of stock market wealth and surging home values would see American consumers pay down record levels of debt. Between March 2020 and April 2021, Americans paid down over $120 billion in debt. However, this metric has been on the rise since December 2021 as inflation began to ramp up.
It's clear that the continued strength of retail sales heading into 2023 has not just been a reflection of the resilience of the consumer, but it has also been bolstered by rising levels of debt and declining levels of savings. According to the FRB, as of early January 2023, Americans were carrying $942 billion in debt. This metric could become problematic if it continues to grow at the current pace, but the consensus view among economists is that the banking system is on much stronger financial ground and facing nothing near the default exposure that spiraled out of control during the Great Financial Crisis.

SACRAMENTO ECONOMIC AND COMMERCIAL REAL ESTATE FORECAST | 17
Source:GallelliRealEstate;CensusBUreau Billions ($) $13,353 $18,204 $17,700 $12,500 $13,500 $14,500 $15,500 $16,500 $17,500 $18,500 2020-01-01 2020-04-01 2020-07-01 2020-10-01 2021-01-01 2021-04-01 2021-07-01 2021-10-01 2022-01-01 2022-04-01 2022-07-01 2022-10-01 2023-01-01
-13.2% 16.6% -15.0% -10.0% -5.0% 0.0% 5.0% 10.0% 15.0% 20.0% $600 $700 $800 $900 $1,000 2019-01-02 2019-03-02 2019-05-02 2019-07-02 2019-09-02 2019-11-02 2020-01-02 2020-03-02 2020-05-02 2020-07-02 2020-09-02 2020-11-02 2021-01-02 2021-03-02 2021-05-02 2021-07-02 2021-09-02 2021-11-02 2022-01-02 2022-03-02 2022-05-02 2022-07-02 2022-09-02 2022-11-02 2023-01-02 Total Consumer Debt (Billions, $) % Annual Change
Prior to the pandemic Americans had nearly $13.5T in their checking accounts. This soared over $4.8T to $18.2T by March 2022. That number has dropped by more than $500 million since as more Americans dip
Source:GallelliRealEstate;FederalReserve Billions ($) YearoverYear Change
One of the asset classes that felt the greatest surge in the post-CoVid economic whiplash was housing. From 2012 through the close of 2022, an average of 5.3 million existing homes sold monthly in the US. That number plummeted in the initial months of the pandemic to a low of just over 4.0 million units, but ramped up significantly by Q3 2020. From September 2020 over the next 18 months, buying activity surged well beyond historic norms—averaging more than 6,000 units per month for 14 straight months.

The trend was driven both by a surge in Millennial first-time home buyers (this demographic group alone accounted for roughly 40% of all buying activity), the movement of urban dwellers to the suburbs (driven primarily by Millennials) and the impact of huge amounts of capital in the system. Pricing spiked, with the national average peaking in June 2022 at 44.6% above where they stood before the pandemic (February 2020). It was only by the middle of last year that the impact of interest rate hikes by the FRB began to significantly slow buying activity and started to drive price declines. According to the National Association of Realtors, the average home price fell 3.0% between June and October 2022 (the latest data available) but is continuing to trend downwards. However, prices remain roughly 40% above where they were before the pandemic.
The FRB had been keeping the Federal Funds Rate near zero (0.25% to 0.50%) until as recently as March 2022 though inflationary concerns had been growing over the final half of 2021. Since then, they have embarked on the most aggressive rate hikes in their history. Over the course of 2022 they raised the rate 425 basis points. By the end of last year, the Federal Funds Rate stood between 4.25% and 4.50%. This effectively doubled the interest rate on the average 30-year fixed rate mortgage.
The average interest rate had reached as low as 2.65% as of January 2021 but market pressures started driving rates up over a year before the Fed made its moves. As of January 2023, the average interest rate on a 30-year mortgage stood at 6.15%.
Let’s put this in perspective. On a $500,000 home (assuming a typical 20% down payment), at a 2.65% interest rate this would translate into a typical
US Existing Home Sales
Case-Shiller US National Home Price Index
US Average 30-Year Fixed Rate Mortgage
18 | GALLELLI REAL ESTATE
Source:GallelliRealEstate;FederalReserve Index: 2000 = 100 YearoverYear Change 21.0% 9.2% 0.0% 5.0% 10.0% 15.0% 20.0% 25.0% 200 220 240 260 280 300 320 2019-01-01 2019-04-01 2019-07-01 2019-10-01 2020-01-01 2020-04-01 2020-07-01 2020-10-01 2021-01-01 2021-04-01 2021-07-01 2021-10-01 2022-01-01 2022-04-01 2022-07-01 2022-10-01
HOUSING WHIPLASH
Source:GallelliRealEstate;FederalReserve 2.65 6.15 0.00 2.00 4.00 6.00 8.00 10.00 12.00 14.00 16.00 18.00 20.00 1971-04-01 1972-12-01 1974-08-01 1976-04-01 1977-12-01 1979-08-01 1981-04-01 1982-12-01 1984-08-01 1986-04-01 1987-12-01 1989-08-01 1991-04-01 1992-12-01 1994-08-01 1996-04-01 1997-12-01 1999-08-01 2001-04-01 2002-12-01 2004-08-01 2006-04-01 2007-12-01 2009-08-01 2011-04-01 2012-12-01 2014-08-01 2016-04-01 2017-12-01 2019-08-01 2021-04-01 2022-12-01 US 30-Year Fixed Rate Mortgage Average
Source:GallelliRealEstate;Tradingeconomics.com;NationalAssociationofRealtors US Existing Home Sales (thousands) Existing Home Sales 10-Year Average: 5.3 Million per month
HOUSING WHIPLASH CONT.
monthly payment of $1,612 per month. At 6.15%, that same monthly payment moves to $2,437 per month. Over the life of the loan, that is a difference of roughly $297,000.

The FRB has signaled that they are not necessarily through hiking interest rates in 2023, though inflation has almost certainly begun to turn a corner. It is entirely likely there may be one or two more 25 basis point rate hikes in early 2023.
Keep in mind that from 1980 to 2020, the average interest rate was 7.8%. From 2000 through 2020 it was 5.9%. It was only following the housing collapse and financial crisis that this average moved below the 5.0% level. From 2011 through 2020 it averaged 3.9%.
The real question going forward is whether we will return to the historically low rates of the past decade or whether that proves to be an aberration as we move back closer towards historical norms. This will have a profound impact on housing affordability and the US home ownership rate.
From the 1960s through 2000, roughly 65% of Americans owned their own home. The home ownership rate peaked in 2004 at 69.2%. Unfortunately, this was primarily due to toxic loan product (adjustable-rate loans, stated income
US Home Ownership Rate
loans, etc.) that would later lead to the housing collapse and the ensuing Great Financial Crisis. The home ownership rate fell to just 62.9% by June 2016 but had been climbing since. It surged in the pandemic housing boom to 67.9% but is already falling.
We anticipate this number to continue to drop in the immediate and, likely, near future. A shortage of new housing will mean home prices will likely not crash in most markets, though they will continue to move downward because of the cost of borrowing. This will particularly challenge first time buyers looking to make the jump from renter to owner. It will bolster multifamily landlords.

SACRAMENTO ECONOMIC AND COMMERCIAL REAL ESTATE FORECAST | 19
Source:GallelliRealEstate;FederalReserve 69.2 62.9 67.9 65.8 59 60 61 62 63 64 65 66 67 68 69 70 2000-07-01 2001-07-01 2002-07-01 2003-07-01 2004-07-01 2005-07-01 2006-07-01 2007-07-01 2008-07-01 2009-07-01 2010-07-01 2011-07-01 2012-07-01 2013-07-01 2014-07-01 2015-07-01 2016-07-01 2017-07-01 2018-07-01 2019-07-01 2020-07-01 2021-07-01 2022-07-01 US Home Ownership Rate (%)
Sacramento CRE Outlook
OFFICE MARKET OVERVIEW

Digital disruption has come to the office market in much the same way it came to the retail market starting in the early 2000s with the ascendancy of eCommerce. For office landlords, the disruptor is workfrom-home (WFH), remote or hybrid work models that emerged out of necessity during the lockdown days of the pandemic. To be clear, it is estimated that 15% of workers already worked from home offices prior to lockdowns. Remote work is nothing new to most regional sales representatives, for example. But, at the peak of lockdowns, it is estimated that between 75% and 85% of the office-using workforce in the US was working from home. The reason we mention retail as having gone through significant digital disruption is to point a few things out. In the early 2000s it was not uncommon to hear “futurist” types prognosticate on how there would be no more shopping malls in 20 years. Of course, while there would be immense pain in that sector, the mall still exists. In fact, while there are about 400 fewer malls in the US today than there were in 2002, most merely have been redeveloped into other shopping center types or mixed-use development. Retail real estate faced great challenges before, and during, the pandemic but “apocalypse” storylines in the media turned out to be overblown. Likewise, earlier in the pandemic, there were some futurists that predicted a permanent decline in as much as 40% of office usage. That, too, will be proven to be an overblown take for multiple reasons.
All Classes of Product,
We absolutely believe that remote and hybrid work models are here to stay, but that the ongoing trend of normalization will continue to occur as CoVid slowly fades into the rear-view mirror. Organizations will increasingly revert closer to the historic mean in terms of the number of workers in-office, though with far more freedom accorded to trusted, seasoned, and experienced employees with a proven track record of productivity. If roughly 15% of employees had a hybrid relationship with office work prior to the pandemic, we think it a safe assumption that the new norm may settle out in the 25% range.
The reality is that many employees thrive with WFH or hybrid work models. But just as many do not. The challenges are more profound for younger workers who have not yet built experience or expertise in their chosen fields. Remote work means they miss out on the training and mentoring that comes with being in office with coworkers. Perhaps most importantly, they lose much of the critical social interaction with others that is most important to those that have not started their own families yet. Meanwhile, some employees simply struggle with the discipline required to be productive in this model.
All Classes of Product, Q4 2022
The challenge of managing and training employees from afar is a serious one—particularly for larger organizations. And even with new tracking tools that can monitor employee productivity from afar, managers often find themselves struggling with the new hybrid reality when it comes to issues of trust, sometimes with good reason. At the end of the day, we see greater normalization occurring simply because of the gravity of human psychology.
Comparisons of the digital disruption now impacting the office market vs. those that impacted retail have one great big difference: leverage. Retail is about catering to the desires of the consumer— the shopper holds all the cards. But while conscientious employers certainly know that part of the formula for success means a happy and productive workforce, the leverage for most industries remains with management, with few exceptions. At the end of the day, it is a lot easier for employers to demand employees to work on-premises than it would be for malls to demand consumers to shop on-premises. None of this means that we will be rolling the clock back to 2019.
Of course, how much space a user can consolidate will depend on their individual hybrid models, the size of their current footprint and, critically, their industry. For example, three days in office per week seems to be the formula favored by most employers offering hybrid work currently. While replacing individual cubicles and private offices with more flexible hoteling workstations and expanded meeting room
20 | GALLELLI REAL ESTATE
Sacramento Office Market
Q4
10.0% 11.0% 12.0% 13.0% 14.0% 15.0% 16.0% (600,000) (400,000) (200,000) 0 200,000 400,000 600,000 2018 Q1 2018 Q2 2018 Q3 2018 Q4 2019 Q1 2019 Q2 2019 Q3 2019 Q4 2020 Q1 2020 Q2 2020 Q3 2020 Q4 2021 Q1 2021 Q2 2021 Q3 2021 Q4 2022 Q1 2022 Q2 2022 Q3 2022 Q4 Sacramento Office Market: Supply/Demand/Vacancy Net Absorption (Demand) Deliveries (Supply) Vacancy Percent Source:GallelliRealEstate;CostarGroup Net Absorption/Deliveries (SF) Vacancy Rate Sacramento
2022
Office Market
5.0% 5.5% 6.0% 6.5% 7.0% 7.5% 8.0% 8.5% 9.0% $100 $120 $140 $160 $180 $200 $220 $240 $260 $280 2013 2014 2015 2016 2017 2018 2019 2020 2021 2022 Sacramento Office Market: Median Price PSF/Average Cap Rate Median Price PSF Average Cap Rate, All Classes Source:GallelliRealEstate;CostarGroup
space can certainly create efficiencies, these can vary significantly. All told, we think it a safe assumption that the space needs of a user in 2019 will likely shrink an average of 10% to 20% going forward as part of the new hybrid reality. Those space givebacks obviously started in 2020, but still have a way to go, especially as leases inked prior to the pandemic come up for renewal. Whether we have a recession or not in the coming year, we will continue to see space givebacks likely over the next few years. A recession is bound to result in higher levels of negative occupancy growth simply because more space users will be looking to tighten their belts. There will certainly see some businesses that see the opportunity to ramp up remote work simply to save rent costs. However, greater fear of layoffs among workers could very likely drive a greater return to the office, especially within sectors facing the greatest potential cuts.
the lowest tallies came from the two largest tech-focused markets in the United States, San Francisco (35.8%) and San Jose (31.0%). The number of workers returning to their offices in those cities has simply not budged in over 18 months. A shortage of skilled tech workers has meant these workers have had the leverage to demand WFH or hybrid models. However, with tech sector experiencing a significant reset following its pandemic boom, some of that leverage is bound to evaporate as layoffs mount. “Out of sight, out of mind, out of a job,” may become a painful reality for some remote workers.
As of the close of Q4 2022, the total size of the Sacramento office market was 68.0 MSF and vacancy in the region stood at 14.9%. This reflects an increase from the 14.5% rate posted three months ago and the 13.9% level recorded one year ago. The market recorded 257,000 square feet (SF) of negative net absorption in Q4. All told, 785,000 SF of previously occupied space came back to market over the course of 2022 (roughly 1.2% of the market’s total inventory).This past quarter also reflects the ninth consecutive quarter of negative occupancy growth in the region; vacancy had been on a downward trend until Q1 2020 when it fell as low as 10.8%. That was, of course, the quarter in which the pandemic arrived. Since that time, just over two million square feet of space has been returned to the market. As daunting as those statistics may sound, we saw nearly twice that amount of space vacated in the aftermath of the Great Financial Crisis.

While the impact of WFH, remote and hybrid models will continue to be a major disruptor for the nation’s office sector, Sacramento will be spared the worst impact that are likely to be felt in neighboring Bay Area markets. For example, prior to the CoVid crisis, office vacancy in San Francisco had fallen to just 4%, it now stands at roughly 26% and analysts there fear it could approach the 40% level by the end of 2023 due to numerous large tech leases that may not be renewed in the coming year.
There are multiple reasons for Sacramento’s comparative strength; nearly one third of the region’s office space is occupied by governmental entities—which largely have not shifted their real estate strategies (a few smaller build-to-suit projects for the State of California were delivered and occupied in 2022, helping to reduce overall negative net absorption numbers by roughly 156,000 SF). While the region is home to multiple corporate campuses and corporate headquarters users, the bread and butter of the Sacramento office market is the smaller professional business tenant. In general, these users have both less space to consolidate and have been less likely to move to hybrid or WFH models. The largest space givebacks nationally have been from large block corporate users—particularly in the tech sector. While Sacramento is home to Intel and other tech players, the local presence here is dominated by small space startups.
According to Kastle Systems’ Back to Work Barometer Index, keycard and building security data indicate that the percentage of workers in office had reached a pandemic era high in January 2023 of just under 50%. While some Texas markets posted numbers as high as 65%,
Look for office vacancy in the Sacramento region to climb over the coming year, but for the local landlords and investors to experience far less pain than their counterparts in other major US markets. Submarkets with exposure to large block users are likely to experience the greatest challenges, though the likelihood of a recession—even if it proves to be brief and minor—is going to be another factor impacting demand. That said, flat rent growth in 2023 may be the best that landlords can hope for. It is highly likely that some submarkets may see rates dropping. Expect a growing trend of flight to quality ahead; active space users will increasingly see the opportunity to upgrade space (though many of these will be footprint consolidations) in the current rent environment.
SACRAMENTO ECONOMIC AND COMMERCIAL REAL ESTATE FORECAST | 21
Select Office Leases 2022 - Sacramento Metro Market Building Name/Address Submarket Tenant Total SF Roseville Innovation Center Roseville/Rocklin Gainwell Technologies 100,000 1300 U Street Downtown California Highway Patrol 48,000 North Pointe—Phase 1 Howe/Fulton/Watt Unitek College 35,000 Renaissance Tower Downtown Water Resources Board 33,000 Prospect Park Highway 50 ThermoGenesis 31,000 Sutter Health Plus Natomas Sutter Health 25,000 Parkway Medical Plaza Roseville/Rocklin Wells Fargo 24,000 Harvard Corporate Center Point West State of California 23,000 Creekside Ridge Roseville/Rocklin KPFF Engineering 22,000 US Bank Tower Downtown HCL Tech 21,000
The impact of remote work on office space demand remains both a question mark and a dark cloud hanging over the investment market. Add into the mix greater economic uncertainty in 2022 and increasingly challenged commercial real estate lending and you have a recipe for what turned out to be the slowest year for deal volume since 2014. The good news for local owners is that the Sacramento region will fare better than most markets because of its high concentration of smaller, professional firms that are less likely to give back large blocks of space in 2023. But we do anticipate an uptick in vacancy.

The region’s medical office space will be immune to the remote work givebacks simply because of the in-person nature of the services they offer. In fact, one of the more significant transactions of 2022 was the sale of the four building, 245,000 SF Blue Shield of California campus in El Dorado Hills to ProEquity Asset Management for a reported $49.3 million, or $201 per square foot.
We anticipate that Class A projects will face their fair share of space givebacks, but they will be better able to backfill those spaces. Tenant flight to quality is likely to accelerate in 2023 with space givebacks—many will trade up as they are shrinking office footprints. The greatest challenges are likely to be faced by large Class B projects. But here Sacramento has another factor going for it that will benefit Class B owners—the heavy presence of government users that have always been active locally in this type of space.
While the region’s office investment market will experience challenges in 2023, we also expect opportunities to arise as uncertainty regarding remote work impact and the economy start to lift. While we expect a lot more clarity regarding the economy by the second half of the year, it will likely be at least another year before the dust settles regarding hybrid office use impacts.
INDUSTRIAL MARKET OVERVIEW
As of the close of Q4 2022, the total size of the Sacramento industrial market was 161.4 MSF, of which just 5.8 MSF (4.0%) was vacant. While this reflects a slight uptick from the 3.8% mark of three months ago and a more substantial increase over the 3.5% reading of Q4 2021, it still reflects an incredibly tight marketplace.
The market posted 567,000 square feet (SF) of occupancy growth in Q4, bringing annual positive net absorption totals to 2.5 million square feet (MSF). While still a robust figure, this falls slightly below the nearly 3.1 MSF of occupancy growth that Sacramento has averaged annually for the last decade. It also reflects a considerable drop in demand from the region’s all-time growth record of last year. Over 7.5 MSF of occupancy

Sacramento Office Market All Classes of Product, Q4 2022
growth was recorded over the course of 2021. That remarkable level of tenant activity translated into the region’s lowest vacancy rate on record by Q1 2022, when the metric for total industrial vacancy (all product types) fell to just 3.4%.
The recent climb in vacancy, despite continued strong growth, reflects two trends, the impact of rising development levels and a slight cooling of demand. Roughly 956,000 SF of new industrial product was delivered to market in Q4 2022, outpacing occupancy growth by just over 40%. All told, nearly 3.4 MSF of new warehouse and distribution space was delivered in 2022, against 2.5 MSF of occupancy growth—hence, the uptick in vacancy levels. Meanwhile, sublease availability in the Sacramento region has doubled in the past year from roughly 623,000 SF to over 1.2 MSF of space. Keep in mind, against the total market inventory
22 | GALLELLI REAL ESTATE
10.0% 11.0% 12.0% 13.0% 14.0% 15.0% 16.0% $1.60 $1.65 $1.70 $1.75 $1.80 $1.85 $1.90 $1.95 $2.00 $2.05 $2.10 2018 Q1 2018 Q2 2018 Q3 2018 Q4 2019 Q1 2019 Q2 2019 Q3 2019 Q4 2020 Q1 2020 Q2 2020 Q3 2020 Q4 2021 Q1 2021 Q2 2021 Q3 2021 Q4 2022 Q1 2022 Q2 2022 Q3 2022 Q4 Sacramento Office Market: Vacancy/Average Asking Rents Overall Average Asking Rent (Monthly FSG) Vacancy Percent Source:GallelliRealEstate;CostarGroup Overall Asking Rent per Square Foot (Monthly, Full Service) Vacancy Rate Overallofficeaskingrentbasedondirectandsublease availabilities.
OFFICE INVESTMENT
Select Office Sales 2022 - Sacramento Metro Market Building Name/Address Submarket Building SF Total Price Price PSF 925 L Street Downtown/ Midtown 169,000 $55.1M $326 Harvard Square Point West 159,000 $22.5M $142 Gateway I Natomas 126,000 $21.6M $172 Creekside Ridge Roseville/Rocklin 78,000 $17.0M $217 Gateway IV Natomas 82,000 $15.3M $187 Gateway II Natomas 66,000 $12.1M $183 St. George Medical Center Carmichael/Fair Oaks 53,000 $12.0M $227 UC Davis Data Drive Highway 50 18,000 $11.1M $601 10811 International Drive Highway 50 55,000 $10.5M $191 2195 Iron Point Road Folsom 20,000 $10.4M $519
of more than 161 MSF of space, this is a very modest increase. But it does reflect a slight cooling in demand levels.
slow national tenant demand in 2023, though an increased availability in product locally could see activity levels in the coming year above the inventory-constrained realities of 2022.
Look for demand for eCommerce logistics space to continue to move further away from the mega million SF warehouse regional model to the 250,000 SF to 400,000 SF (or below) local delivery model. Additionally, cold storage space continues to be in short supply and high demand in the Sacramento region. We anticipate that warehouse and logistics space will continue to be the focal point of local demand in 2023. Flex product, which currently boasts a 6.2% vacancy rate and accounts for roughly 19 MSF of inventory in the region, accounted for just 56,000 SF of positive net absorption in 2022 and simply hasn’t been a strong driver of demand. The same holds true for manufacturing space, which experienced negative occupancy growth in 2022 to the tune of -141,000 SSF but only 15 MSF of local product.
Ultimately, we see all of these as signs that the market is cooling from what been unsustainably, white hot growth levels to merely hot.
Much attention has been paid to Amazon’s recent downshift in activity. The eCommerce behemoth has pulled back from dealmaking significantly (and not just for industrial—they have also done so for their retail concepts, primarily Amazon Fresh). In January 2023, they also issued the first layoffs in their history. We see this as merely part of the ongoing reset for tech and eCommerce from unsustainable pandemic highs to the new emerging norms of the post-CoVid era. It was bound to happen. Actual numbers are hard to define because Amazon enforces strict confidentiality on their real estate deals and does not comment publicly on strategy. However, during their pandemic industrial dealmaking surge, it is estimated that they singlehandedly bought, leased, or purchased land to develop somewhere between 120 MSF and 130 MSF of industrial product— essentially within 30-month time frame. That is roughly the same size as the Sacramento region’s entire warehouse/distribution inventory. Those levels of astonishing growth, fueled by Amazon’s drive to build same day delivery capabilities throughout the continental US, were bound to eventually come back to earth.
While any increase in vacancy is bound to cause concern for landlords and developers, but keep in mind that one of the reasons why occupancy growth in 2022 fell below the region’s ten-year average was the lack of available quality product. Of the roughly 161 MSF of industrial space in the region, 127 MSF (or nearly 80% of the entire marketplace) is warehouse/distribution space (this includes cold storage as well as modern eCommerce logistics product). This is, and will remain, the sector driving activity throughout North America. Both the pandemic era surge in demand and an already tight marketplace have conspired over the past three years to drive some metrics that are simply unsustainable in the long run. Warehouse/distribution vacancy currently stands at 3.8%. This is up from a record low of just 3.2% for this industrial product type in Q1 2022, but still reflects an incredibly tight marketplace where tenants have few, if any, options. This lack of product hasn’t just negatively impacted deal levels, it has set in rent growth levels that cannot be sustained forever.
The average asking rent for industrial space in the Sacramento region currently stands at $0.77 per square foot (PSF) on a monthly triple
However, it would be a mistake to assume that we won’t continue to see significant demand from other eCommerce players, distribution, warehousing, and logistics concerns. But the potential of an economic downturn, as well as Amazon’s pause in the marketplace, are sure to
SACRAMENTO ECONOMIC AND COMMERCIAL REAL ESTATE FORECAST | 23
Select Industrial Leases 2022 - Sacramento Metro Market Building Name/Address Submarket Tenant Total SF 3771 Channel Drive West Sacramento TK Classics 402,000 2031 Optisolar Lane McClellan PCA McClellan 399,000 3510 Carlin Drive West Sacramento LKQ 387,000 2925 Ramco Street West Sacramento Home Depot 157,000 3765 Channel Drive West Sacramento TK Classics 155,000 3689 Industrial Boulevard West Sacramento RL Liquidators 132,000 1600 Cebrian Street West Sacramento Sutter Health 120,000 6101 Midway Street Power Inn RoadTex Transportation 114,000 1464 Enterprise Street West Sacramento Mailing Systems, Inc. 110,000 25 Wayne Court Power Inn Huttig Building Products 105,000 Sacramento Industrial Market
0.0% 1.0% 2.0% 3.0% 4.0% 5.0% 6.0% 7.0% 8.0% (1,000,000) 0 1,000,000 2,000,000 3,000,000 4,000,000 5,000,000 2018 Q1 2018 Q2 2018 Q3 2018 Q4 2019 Q1 2019 Q2 2019 Q3 2019 Q4 2020 Q1 2020 Q2 2020 Q3 2020 Q4 2021 Q1 2021 Q2 2021 Q3 2021 Q4 2022 Q1 2022 Q2 2022 Q3 2022 Q4 Sacramento Industrial Market: Supply/Demand/Vacancy Net Absorption (Demand) Deliveries (Supply) Vacancy Percent Source:GallelliRealEstate;CostarGroup Net Absorption/Deliveries (SF) Vacancy Rate Sacramento Industrial Market All Classes of Product, Q4 2022 2.0% 3.0% 4.0% 5.0% 6.0% 7.0% 8.0% $0.20 $0.30 $0.40 $0.50 $0.60 $0.70 $0.80 2018 Q1 2018 Q2 2018 Q3 2018 Q4 2019 Q1 2019 Q2 2019 Q3 2019 Q4 2020 Q1 2020 Q2 2020 Q3 2020 Q4 2021 Q1 2021 Q2 2021 Q3 2021 Q4 2022 Q1 2022 Q2 2022 Q3 2022 Q4 Sacramento Industrial Market: Vacancy/Average Asking Rents Average Asking Rent (Monthly NNN) Vacancy Percent Source:GallelliRealEstate;CostarGroup Average Asking Rent per Square Foot (Monthly, Triple Net) Vacancy Rate
All Classes of Product, Q4 2022
INDUSTRIAL MARKET OVERVIEW CONT.
INDUSTRIAL MARKET OVERVIEW CONT.
net basis. Even with slightly lower deal activity levels, increased deliveries, rising vacancy and looming economic concerns hanging over the market in 2022, this metric is up a full 10.0% from where it stood a year ago. Incidentally, the year before (2021) saw asking rents spike by 16.7%. Over the past five years, the overall industrial asking rate has increased by a whopping 57.1% from $0.49 PSF to the current average of $0.77 PSF.
Against these metrics, that developers have aggressively moved to build new, speculative industrial product (almost exclusively modern warehouse/distribution/logistics space), with over 12.4 MSF of new inventory added in the past five years. As of the end of 2022, there was another 2.5 MSF of new construction in the pipeline, slated for 2023 deliveries—much of which is being delivered on a speculative basis. There are additional projects we anticipate will go forward shortly in 2023, however, we also anticipate the development levels of the pandemic era, and its accompanying surge are going to slow slightly in 2023 simply because of the impact of inflation on construction costs that has become a greater challenge for developers and merchant
INDUSTRIAL INVESTMENT OUTLOOK
While the region’s industrial market is likely best positioned to weather the challenges of 2023, the investment market is likely to slow. Pricing was already showing signs of softening in late 2022 with cap rates creeping up slightly from what had record lows. One of the challenges we are seeing across all product types is a widening spread between bid and ask. Until there is greater economic clarity we will continue to see this connect—which has varied by property type but typically the gap is between 10% and 15%. We anticipate that due to industrial’s extremely robust leasing fundamentals that many sellers simply are not going to lower pricing unless forced to by market conditions. This won’t change the fact that there will be some value erosion due to higher interest rates— it may not impact industrial as much as other property types, but it will occur. That said, we see owner-users that need properties as continuing to be active in the Sacramento region in 2023 but anticipate some cooling on the institutional investor side. If industrial leasing is going from white hot to hot, industrial sales are likely to go from mildly hot to warm. However, of all asset classes locally, industrial will be in the best position to recover lost value in the next upswing of the economic cycle because its underlying fundamentals are rock solid.
builders. The price of construction materials had skyrocketed as high as 60% (year-over-year) as of May 2022, though this rate of inflation has thankfully come back to earth since that time. According to the FRB, year-over-year inflation for building materials had fallen back to 20% to 30% range (depending on the materials, i.e., wood, concrete, steel, etc.) as of December 2022 and are expected to moderate further downward along with overall inflation levels. Yet, even with Sacramento’s outsized industrial rent growth of the past few years, this spike has made it harder for new projects to pencil. Assuming the Fed can successfully bring inflation back to the 3% range by the end of 2023, this may provide developers with some relief. However, that remains a big “if.”
While we expect vacancy levels to tick up further, we also expect continued rent growth—though it is unlikely to match the same aggressive pace of the past few years. Even if the market may be in the earlier stages of transformation to a new post-pandemic reality, we are a long way from market equilibrium between supply and demand. The pendulum still favors landlords and will continue to do so for quite some time.
Sacramento Industrial Market All Product Types, Q4 2022

24 | GALLELLI REAL ESTATE
3.0% 4.0% 5.0% 6.0% 7.0% 8.0% 9.0% $40 $60 $80 $100 $120 $140 $160 2013 2014 2015 2016 2017 2018 2019 2020 2021 2022 Sacramento Industrial Market: Median Price PSF/Average Cap Rate Total Sales Volume Average Cap Rate Source:GallelliRealEstate;CostarGroup Select Industrial Sales 2022 - Sacramento Metro Market Building Name/Address Submarket Building SF Total Price Price PSF 8301 Belvedere Avenue South Sacramento 348,000 $42.8M $123 3065 Ramco Street West Sacramento 119,000 $40.1M $336 8301 Fruitridge Road South Sacramento 261,000 $37.8M $144 3200 – 3240 Reed Avenue West Sacramento 103,000 $25.6M $248 7120 Badiee Drive Highway 50 126,000 $23.5M $187 3940 Seaport Boulevard West Sacramento 132,000 $18.2M $139 3805 Faraday Avenue Davis/Woodland 71,000 $16.4M $230 8372 Tiogawoods Drive Power Inn 144,000 $16.0M $111 1600 Cebrian Street West Sacramento 120,000 $14.6M $121 4350 Pell Drive Natomas 126,000 $14.0M $111
RETAIL MARKET OVERVIEW
Retail has always had to adapt faster than other property types, simply because the consumer space is always evolving, and it is doing so at a faster pace than ever. Digital disruption from eCommerce is what was driving the sector’s pre-pandemic issues and the often overblown “retail apocalypse” stories in the media. Then, CoVid-19 arrived in 2020 and it seemed briefly as if the sector was now actually in a real apocalypse. Yet, the crisis ended up demonstrating that retail may be the most resilient of all commercial real estate types.
That resiliency is best demonstrated by the wild swing in retail demand that has occurred since 2020. The sector set records in terms of bankruptcies and closures in the wake of the pandemic. COVID-19 accelerated the demise of dozens of chains that had already been struggling. Other chains accelerated right-sizing plans, expanded already planned strategic closures, or withdrew from the marketplace completely.
have gone toward services, travel, and entertainment elsewhere (those sectors would not see a rebound in spending until the arrival of vaccines).
The impact of an unprecedented $6 trillion in stimulus would only further fuel what would become a retail sales holiday. By March 2021, growth was in the double digits, averaging 22.6 percent over the next 14 months. Sales numbers only began to falter in May 2022 as the impact of inflation started to take a bite out of consumer spending.

The stimulus also led to a surge in asset prices from homes to equities; 2021’s booming stock market led to a round of retail initial public offerings (IPOs), with multiple newly public retail concepts announcing robust growth plans. Business investment surged, as did new business formation. All these factors would spur retailers to their most aggressive growth levels in the better part of a decade.
This includes dollar stores and discounters, which have driven retail growth tallies for the better part of the last decade. But the automotive, convenience stores, cosmetics, fitness clubs/gyms, grocery, hobby stores, home furnishings, off-price apparel, pet concepts, shoe stores (athletic), and sporting goods categories have all accelerated expansion plans.
Meanwhile, the categories hit hardest were those that had been e-commerce-resistant bright spots of the retail landscape prior to the pandemic. Service retail from restaurants to fitness clubs and from experiential to entertainment concepts faced the greatest challenges. Though quick service restaurants (QSRs) with drive-throughs fared far better than their dine-in counterparts, more than 110,000 restaurants failed in the first six months of the pandemic alone. This sector would not see overall sales rebound until March 2021 as vaccines became widely available. For an industry dominated by small business (including franchisees) and already operating on narrow margins, COVID was an unprecedented disaster.
Though a combination of government aid (PPP loans), operator grit, and landlord largesse kept the damage from being far worse, it is critical to remember that the pandemic disproportionately hammered small businesses across all retail sectors. For many large national credit chains, this would become an opportunity to aggressively grow market share heading deeper into 2021.
This was only further fueled by outsized spending. Monthly retail sales had averaged 2.9 percent annual growth in the 20 years preceding the pandemic. This metric turned negative for the first three months of lockdown. But consumers quickly reallocated dollars that would
Grocery remains white-hot, with growth bolstered by aggressive expansion plans from newer market entrants like Aldi, Lidl, and until recently, Amazon Fresh (they paused store openings in late 2022 and had not resumed activity by the time this report went to press). Offprice apparel has returned to robust growth, with players like Kohl’s and Burlington experimenting with smaller-format stores to facilitate expansion into new markets. Fueled by QSRs and new fast casual concepts, major chains nationally were poised to add as many as 7,000 stores through 2024. Dominant players like Starbucks, Chipotle, Chick-fil-A, McDonald’s, and Dunkin have all ramped up growth and intensified competition.
Select Retail Leases 2022 - Sacramento Metro Market
SACRAMENTO ECONOMIC AND COMMERCIAL REAL ESTATE FORECAST | 25
Building Name/Address Submarket Tenant Total SF Koreana Plaza Highway 50 Floor & Décor 76,000 The Ridge Elk Grove LA Fitness/City Sports 35,000 Florin Towne Centre South Sacramento Chuze Fitness 34,000 2800 Power Inn Road Downtown/ Midtown/East Sacramento Falling Prices 30,000 Centre Pointe Shopping Centre Roseville/Rocklin Airport Home Appliance 26,000 Bidwell Center Folsom Planet Fitness 18,000 Rancho Cordova Town Center Highway 50 Marshall’s 25,000 Harding Plaza Roseville/Rocklin Falling Prices 24,000 2214 El Camino Avenue Arden/Watt/Howe dd’s Discounts 22,000 Woodland Plaza Woodland Planet Fitness 18,000
Of course, not all retail sectors are in growth mode. Theaters remain deeply challenged and we anticipate consolidation ahead. Retail banking continues to deal with digital disruption, driving less need for overall branches and smaller footprints. Drugstore chains are reducing store counts, though online pharmacy has yet to emerge as a major disruptor. Department stores, particularly outside of the luxury sphere, still largely need to downsize and evolve their models to remain relevant. Store closures in 2022 account for the lowest numbers in a decade, while occupancy growth nationally was the highest it has been since 2006.
this regard for three consecutive years and is on track to do it again in 2022. Nationally, less than 30 million square feet of new retail space came online in 2021, with the market on track to deliver roughly 20 million square feet in 2022. With roughly 11.87 billion square feet of total retail space in the United States, this reflects an increase in inventory of 0.25 percent. This metric has not surpassed the 0.60 percent level in 15 years. Nearly all new development has been in strong population growth areas in the form of retail’s strongest-performing asset class, grocery-anchored centers.
The real question is whether retail’s rebound can hold heading into 2023, in either a no or mild recession scenario.
RETAIL INVESTMENT OUTLOOK
The other significant factor aiding the recovery of the retail sector has been historically low development levels. The sector has set records in Retail property sales volume in the Sacramento region ticked up significantly in 2022. According to Costar, there was more than $1.6 billion in deal activity last year. The average sales volume over the previous three years had been roughly $1.0 billion.
Grocery-anchored assets and net lease retail (particularly fast-food properties with drive-throughs, assuming long-term leases are in place to gold standard, national credit tenants) opportunities have dominated the retail investment landscape for most of the past decade. The greatest challenge has been finding quality available properties in a marketplace where everyone is chasing the same thing. Do not expect this to change in 2023, though higher interest rates and greater challenges in lending will have an impact on activity. However, with greater uncertainty around office product and years of investors having picked over the industrial and multifamily landscape (and driving significant cap rate compression), retail may increasingly be an acquisition target for institutional investors that had shied away from it in recent years. Retail asset pricing will simply offer better returns on quality product than will industrial or multifamily.
There may also be increased demand in 2023 from buyers looking for opportunistic plays that may arise from changes in the debt markets, across all property types. While plenty of challenged assets remain across the wide spectrum of retail property types and geographies, the real question for these buyers is whether tighter debt markets will depress prices
on high-quality assets. While stand-alone, occupied retail product and community/neighborhood centers remain good opportunities, we could potentially see an uptick in demand for lifestyle centers due to their high viability but still generally depressed valuations.
Meanwhile, the trend of mixed-use redevelopment and densification playing out in the mall arena is likely to expand to other property types. Nationally, there are multiple players actively looking for class B properties in class A locations where there is an opportunity to repurpose lifestyle, power, even grocery-anchored centers to mixeduse live/work/play projects. This trend could potentially play out in Sacramento in 2023.
Select Retail Sales 2022 - Sacramento Metro Market
26 | GALLELLI REAL ESTATE
Building Name/Address Submarket Building SF Total Price Price PSF 8176 – 8230 Delta Shores Elk Grove 217,000 $62.3M $287 Broadstone Plaza I Folsom 208,000 $53.3M $256 Park Place I Natomas 79,000 $23.1M $293 Delta Shores—At Home Elk Grove 90,000 $21.7M $241 Delta Shores---Regal Elk Grove 59,000 $19.0M $343 Strikes Rocklin Roseville/Rocklin 64,000 $15.7M $245 Country Club Plaza Arden/Howe/Watt 250,000 $15.3M $61 Sunridge Plaza—Raley’s Highway 50 40,000 $14.9M $373 Blue Oaks Town Center Roseville/Rocklin 91,000 $14.0M $155 Raley’s—Douglas Blvd Roseville/Rocklin 67,000 $13.0M $194
RETAIL MARKET OVERVIEW CONT.
Sacramento was one of the markets that benefited from pandemic migration trends. The Sacramento region has always acted as a pressure valve market for the Bay Area—when housing costs soar there, in-migration of residents occurs in Sacramento.
In the decade prior to the housing crash that began in 2006 (1996 to 2006), the Sacramento region averaged 16,194 new single-family residences (SFRs) per year. From 2007 through 2019, it averaged just 5,561 new units per year. This level of under-development has historically been a key factor behind the region’s strong multifamily rent growth. There simply has not been enough housing in the area SFR or multifamily.
SFR development, however, began to significantly ramp up by late 2020 as in-migration from the Bay Area ticked up and then home prices began to climb. In 2020, developers added 10,953 new SFRs locally. In 2021, there were 12,075 single-family permits issued, the most in the region since 2005. But those development levels have come back to earth as the one-two punch of construction cost inflation and higher interest rates, slowed the trend. There were 10,591 permits issued in 2022—but 65% of them were issued in the first six months of the year. SFR developers are pulling back significantly.
Apartment vacancy in the Sacramento market posted its sixth consecutive quarterly increase during the final three months of 2022, closing the year at 6.7%. Our data only tracks competitive multifamily projects with a minimum of 25 units and does not include smaller complexes or fourplexes, nor does it include senior, student, or Section 8 housing.
as those restrictions were lifted. So, while vacancy numbers have increased, this at least reflects an improved situation for landlords that were not earning income on many of these units but whose hands were tied in respect to finding new tenants.
Vacancy is up from the 5.8% rate of three months ago as well as from a year ago when it stood at 4.2%. Over the course of 2022, the market added over 2,200 new units from construction deliveries while simultaneously seeing unit occupancy fall by approximately 760 units. However, not all of this news is bad news for landlords. One reason for the vacancy creep has been loosening pandemic era restrictions that precluded many owners from carrying out evictions for non-payment of rent. For example, in the City of Sacramento, tenants were spared eviction if they could pay 25% of their rents due by the close of Q3 2021. However, evictions of those tenants were prohibited until April 1, 2022. Not surprisingly, unit occupancy growth turned negative
Even while vacancy numbers climbed in 2022, the reality is that Sacramento’s population growth has increased since the arrival of the pandemic. The Sacramento region has acted as a housing pressure valve for its pricier neighbors by the Bay for the better part of the last 40 years. This in-migration has come in multiple significant waves; in the early 1990s as the initial tech boom ramped up, in the early 2000s as the second tech boom arrived and, most recently, with the arrival of the pandemic. For example, it is estimated by the Census Bureau that in the year 2020 the City of San Francisco lost approximately 140,000 residents, or nearly 19% of its population. Only a small percentage of these movers left the state. Most of the movement was temporary—it is estimated that roughly half of these residents had returned by mid2022. Many were first-time homebuyers (primarily Millennials) that drove a suburban housing boom and national spike in single-family residential (SFR) pricing. Others were renters that took advantage of remote work capabilities to leave town. Many landed in Sacramento where average asking rent per units typically are near 50% below those of San Francisco, the Peninsula and San Jose.
The in-migration trend is demonstrated clearly by occupancy trends in 2020 (the Sacramento apartment market absorbed over 2,500 units) and 2021 (positive net absorption of just under 1,800 units). Incidentally, new deliveries in both of those years were below 2022 levels. Developers added just over 1,300 new units in 2020 and another 1,800 the following year. Incidentally, that construction pipeline remains strong going forward. As of the end of 2022, there were over 4,400 units in development throughout the region with delivery timetables slated through early 2024. This is the highest number of units under development that we have tracked in 20 years. But it is important to remember that in the wake of the housing collapse and the Great Financial Crisis, very little new product came to market. Less than 1,600 new apartment units were delivered in the region between 2008 and 2014. This shortage of product resulted in Sacramento taking its place as one of the top US markets for multifamily rent growth multiple times over the last decade. That rent growth, obviously, has
SACRAMENTO ECONOMIC AND COMMERCIAL REAL ESTATE FORECAST | 27
MULTIFAMILY INVESTMENT OUTLOOK
also fueled the aggressive return of new development. That said, the current rate of new development accounts for less than 3% of the existing inventory. Years of underbuilding and the recent surge in in-migration since the pandemic mean this level of development isn’t just sustainable but it is simply not enough to return the marketplace to equilibrium.
The current average asking rent per unit throughout the region is $1,832. This reflects an increase of just 1.1% from the $1,813 per unit reading of one year ago. But it is still up 18.7% from where it stood prior to the pandemic. Over the past decade, this metric has climbed a whopping 70.9%.
by the Federal Reserve, the ability to make the jump from renter to firsttime homeowner will remain significantly strained. The issue of affordability for first-time buyers is not likely to improve for a minimum of a couple of years. This means many renters are going to be remain renters, which should bolster multifamily occupancy growth totals.
We anticipate increasing vacancy in 2023, but with strong net absorption as well. Ultimately, we see continue strong underlying leasing fundamentals for multifamily product. However, the potential for recession ahead remains a significant risk. The consensus among most economists is that if one occurs in 2023, it will likely be mild and brief, barring any unforeseen or “black swan” events. However, after the record rent growth of most of the past decade, a real question remains as to how much further Sacramento landlords can push rents. The ability for owners of Class C projects to push rents will be limited by the fact this asset class will be most exposed to tenants that simply may be priced out. Class A projects will continue to face a ceiling of where SFR rental units are priced. Class B projects likely have the most room for upside, but not without risk of lower occupancy rates if moves are too aggressive. Regardless, we expect modest rent growth ahead if for no other reason that new product built at elevated construction prices will set a new premium Class A rent and move the goalposts.
So with supply (new deliveries) outpacing demand (net absorption) in 2022 and multifamily rent growth slowing after years of recordsetting trending, where does this leave us for 2023? Development levels are going to remain elevated at least through the remainder of this year. However, due to the lifting of eviction moratoriums, we don’t think 2022’s net absorption tallies are a good indicator of what will happen in the coming year. In anything, this was the market finally clearing its books of a challenging issue—especially for mom-and-pop landlords or smaller property investors.
With interest rates on the typical 30-year home loan now effectively double where they stood one year ago, SFR activity has plummeted, though high population growth and lower cost of living markets have been spared the worst impacts. According to a January 2023 report from the technology-powered residential brokerage RedFin, 24.6% of the service’s users were looking to relocate to lower cost of living markets in Q4 2022. Their top relocation markets were Sacramento, Las Vegas, Tampa and Phoenix. Assuming this plays out, it will mean continued in-migration will have a mitigating impact on local price declines, even if much of the SFR deal activity will be driven by buyers relocating to the region. That is positive news for current owners and their existing equity. It’s bad news for renters—it means there won’t be a major reset in SFR pricing here and that with interest rates likely to be raised again
The real challenge ahead may be on the investment side. Demand for multifamily and industrial product has driven investment activity for the past five years. Cap rate compression has left little room for yield and a lack of available quality properties means that would-be sellers have little to trade into. Though we see underlying leasing fundamentals as remaining strong, we also see a disconnect between buyer and seller pricing that will likely continue for the short-term.
Select Multifamily Sales 2022 - Sacramento Metro Market
28 | GALLELLI REAL ESTATE
Building Name/Address Submarket Total Units Total Price Price Per Unit The Falls at Willow Creek Folsom 426 $148.6M $349K The Core Natomas Natomas 300 $147.3M $491K The Eleven Hundred Apts. Arden/Howe/Watt 565 $119.0M $211K Vue at the Lake South Sacramento 200 $68.3M $341K Aspire Arden Arden/Howe/Watt 250 $63.5M $254K Legends at Willow Creek Folsom 208 $61.4M $295K Capitol Place Apartments Downtown/ Midtown 192 $58.2M $305K 1430 Q Street Downtown/ Midtown 75 $57.1M $761K H16 Apartments Downtown/ Midtown 95 $34.0M $358K Northwood Apartments Arden/Howe/Watt 156 $31.3M $201K
GALLELLI TEAM BROKER SHEET
Gary Gallelli CEO - Partner gary@gallellire.com

Pat Ronan Vice President pat@gallellire.com
Aman Bains Associate Vice President abains@gallellire.com

Adam Rainey Associate Vice President arainey@gallellire.com


Kevin Soares Executive Vice President | Partner ksoares@gallellire.com

Bob Berndt Executive Vice President | Partner bberndt@gallellire.com


Jeff Hagan Senior Vice President | Partner jhagan@gallellire.com
Phillip Kyle Senior Vice President pkyle@gallellire.com
Matt Goldstein Vice President mgoldstein@gallellire.com
Kurt Conley Senior Associate kconley@gallellire.com
Robb Osborne Partner rosborne@gallellire.com
Brandon Sessions Senior Vice President bsessions@gallellire.com
Kannon Kuhn Associate kkuhn@gallellire.com
Kristopher Krise Capital Markets Advisor kkrise@gallellire.com

SACRAMENTO ECONOMIC AND COMMERCIAL REAL ESTATE FORECAST | 29
JKG
JKG 3005 Douglas Blvd., Suite 200 Roseville, CA 95661 916-772-1700
FINAL CREDITS
Gary Gallelli, Jr. President
CA DRE #01099383
gary@gallellire.com
Garrick H. Brown
garrickhbrown@gmail.com
(279) 202-5405

I’ve had a long and varied career with numerous commercial real estate firms since the 1990s in multiple markets. In 2002, I moved to the Sacramento region where I worked for Colliers International. It was there that I developed deep friendships with Gary and Jason Gallelli. While I may be primarily known as a retail real estate economist today, most of my career was spent as a generalist—observing, reporting, and forecasting every commercial real estate type. The reason for my shift to specializing in retail was Jason Gallelli. Yes, I had had a history in retail, as many of us have had. And yes, I had an innate curiosity in retail because (like all of you) I am a shopper and consumer. Retail is inherently interesting to everyone—not just those of us in the commercial real estate landscape. Jason mentored me on the kind of research his clients (whether landlord or tenant) desired, wanted or needed. It was when I began focusing on retail that my career really took off. That would not have happened but for my dear friend, Jason Gallelli. Incidentally, I got along great with Gary too!
I was heartbroken to learn of his premature passing a couple of years ago. But it has been a great joy to reconnect with all my old friends at Gallelli Real Estate, especially with Gary and with one of the best managers of people I have ever had the privilege to know and work for, Carolyn Aufranc. If you’re lucky in your career, you get to revisit working with colleagues that feel a whole lot more like family and friends than coworkers.
I hope you all find these insights useful and actionable.
Sincerely,
Garrick H. Brown
30 | GALLELLI REAL ESTATE
“
The 2023 Gallelli Real Estate Sacramento Economic and Commercial Real Estate Forecast has been brought to you by Gallelli Real Estate in conjunction with Sacramentobased real estate economist, Garrick H. Brown, of Brown Consulting.