ity. This also allows the biological reactors to be run at elevated MLSS levels, similar to membrane bioreactor (MBR) processes, and enables additional biological plant capacity.
Full-Scale Demonstration Methodology A demonstration program was undertaken that involved temporary full-scale integration of the treatment process at the WPCP during a three-month period. This was accomplished by removing one secondary treatment train from operation, adding magnetite (ballast) to the online treatment train, and temporarily installing a magnetite recovery system housed in a trailer. A process flow diagram of the full-scale demonstration is presented in Figure 3. The demonstration system was operated at projected future operating conditions to confirm the design parameters associated with biological treatment. Secondary clarifier stress testing was also conducted to confirm clarifier performance and peak flow capacity.
During Day 1 testing, flows were increased incrementally at one-hour intervals to attempt to reach the hydraulic capacity of the clarifier and a maximum influent flow rate of approximately 2 mgd was reached. During Day 2 testing, a target flow value of approximately 2.64 mgd was chosen and was held over a three-hour period. A summary of the secondary clarifier operating conditions and secondary effluent quality during the two days of stress testing are presented in Table 1. It should be noted that the
solids loading rate (SLR) values were calculated based on the solids loading from the MLSS without magnetite so that they could be compared to typical SLR values for nitrifying CAS facilities. It was determined that the existing secondary clarifier can be operated at sustained surface overload rate (SOR) and SLR values of 945 gal per day per sq ft (gpd/sf) and 67 lb/da/sf, respectively, and peak SOR and SLR values of Continued on page 36
Results Long-Term Testing Long-term testing began on July 15, 2013, and the demonstration period ended on Sept. 30, 2013. The treatment system operated at an average MLSS concentration (without magnetite) of 6,945 mg/L. With magnetite, the total MLSS concentration was 20,036 mg/L. The average sludge volume index (SVI) values reached a steady state value of approximately 50 mL/g by the end of the demonstration period, indicating a very well settling sludge. The SVI values were calculated based on the MLSS concentration without magnetite so that it could be compared to the SVI of other activated sludge facilities. Over the study period, the average rate of magnetite recovery from the WAS was approximately 95 percent. Magnetite remaining in the WAS accounted for approximately 9 percent of the average WAS mass flow rate. Secondary Clarifier Stress Testing Clarifier stress testing took place over two days. In order to provide added flow for stress testing, two pumps were used to recirculate secondary effluent from the tertiary flocculation tanks, which were located downstream of the test secondary clarifier to the head of the on-line aeration tank to simulate peak flows. Samples of mixed liquor, secondary effluent, and tertiary effluent were collected throughout testing. Sludge blanket levels were also monitored throughout testing.
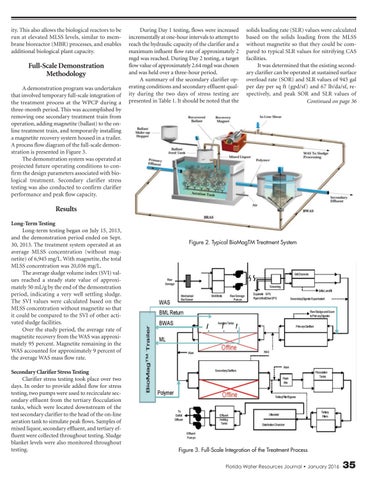
Figure 2. Typical BioMagTM Treatment System
Figure 3. Full-Scale Integration of the Treatment Process Florida Water Resources Journal • January 2016
35