
4 minute read
Racial Disparities in Homeownership and Housing Instability

home sold for compared to the previous time(s) it was sold. Because the home is the same, this allows an easy assessment of how quickly already built homes are appreciating without relying on expensive assessments and in a way that does not factor in newly built homes until they have been sold twice.
Since 2012, home prices in Florida have grown steadily. While growth over the last eight years has been slower than the frenzied build-up that preceded the 2008 Great Recession, it has also gone on far longer. Because of this, home prices are at an all-time high in Florida. Homes peaked at 2.21 times their December 2000 value in 2006, before dropping between 2007 and 2011. Now, homes in Florida are selling for almost 2.5 times their value in 2000. While the COVID-19 pandemic has sent renters scrambling and forced homeowners into forbearance, it has done nothing to slow home prices, which have continued their pre-COVID-19 trend42 .
Advertisement
Racial Disparities in Homeownership and Housing Instability
In 2020, Black and Hispanic households increasingly bore the burden of COVID-related housing instability that illuminated and exacerbated existing racial housing disparities. According to public opinion polling by Opportunity Starts at Home, 72% of African Americans and 76% of Hispanics expressed concern that they will lose their housing during the pandemic without additional assistance43 .
These concerns come on the heels of a decade in which Black Americans continued to trail whites in overall homeownership rates. This lack of ownership coupled with the increasing cost of housing has resulted in significant challenges for Black and Hispanic households in Florida: 44% of Blacks and 43% of Hispanics are cost-burdened, compared to 26% of whites. This cost-burdened figure increases to more than half of Blacks and Hispanics when looking solely at renters44 .
This lack of affordable housing exacerbates existing segregation. Due to a legacy of discrimination, Black families and families of color have lower net wealth and incomes than white families. The lower net wealth creates large differences in purchasing power, which, in concert with policies and practices in both the public and private sectors, often results in housing for low-income households being sited in areas that perpetuate racial residential segregation45 .
Private-sector discrimination was a direct consequence of a partnership between the federal government and local bankers and real estate brokers and contributed significantly to our residential segregation patterns today. Federal housing policy gave official sanction to discriminatory real estate sales and bank lending practices through the practice of redlining. Through the Home Owners’ Loan Corporation, the Federal Home Loan Bank Board developed Residential Security Maps and Surveys used by brokers and lenders to determine eligibility for mortgages and home loans.
Freddie Mac House Price Index
Figure 11. Freddie Mac's House Price Index between 2000 and October 2020
(Source: Freddie Mac)
The maps divided and ranked areas in American cities from A to D, with corresponding colors, considering factors such as building conditions, amenities and infrastructure, and— most importantly—the neighborhoods’ racial, ethnic, and economic composition. Areas with even small populations of Black Americans were deemed “hazardous” and colored red – hence the term “redlining.”
These inequitable practices perpetuated a vicious cycle of neighborhood decline, a legacy that continues to have lingering effects in American cities. Most of the neighborhoods the HOLC graded as “hazardous” eight decades ago are low-to-moderate income today, and nearly 64% are still predominately minority neighborhoods today46 .
This legacy has also had a lingering impact on financing Black homeownership: The Federal Housing Administration regularly refused loans to Black homebuilders while underwriting the construction of homes by whites and refusing to back Black residential development in or near white neighborhoods. To this day, Black buyers face difficulties finding high quality financing and are often targed by predatory lending efforts, including those that led to the subprime mortgage crisis. White Floridians are more likely to own a home either free and clear or with a mortgage than any other racial/ethnic group. At the same time, Black Florida families have the lowest homeownership rates in the state, and more than half of households are renters47 .
Unfortunately, there have been only small improvements in housing equity over the last 50 years. In 1970, two years after the passage of the Fair Housing Act, the African American homeownership rate was 41.6%. Black homeownership would rise over the following decades to an all-time high in Florida in 2007 at just over 50% (though it remained 20% lower than the state as a whole and 30% lower than white residents). Since 2007, and particularly after the 2008 Great Recession, the black homeownership rate fell to 43% in 2015, less than 2% higher than the black homeownership rate in 1970, when African Americans had only just been allowed to buy homes in most parts of the US. Since 2015, the homeownership rates for all racial and ethnic groups have grown, with black homeownership rising to just under 48%, Hispanic homeownership at 52%, the other, nonHispanic group (which includes Asian American, people of multiple races, native Americans, and Hispanics and Latino who do not identify as Hispanic or Latino) at 65%, and the white homeownership rate at 76%.
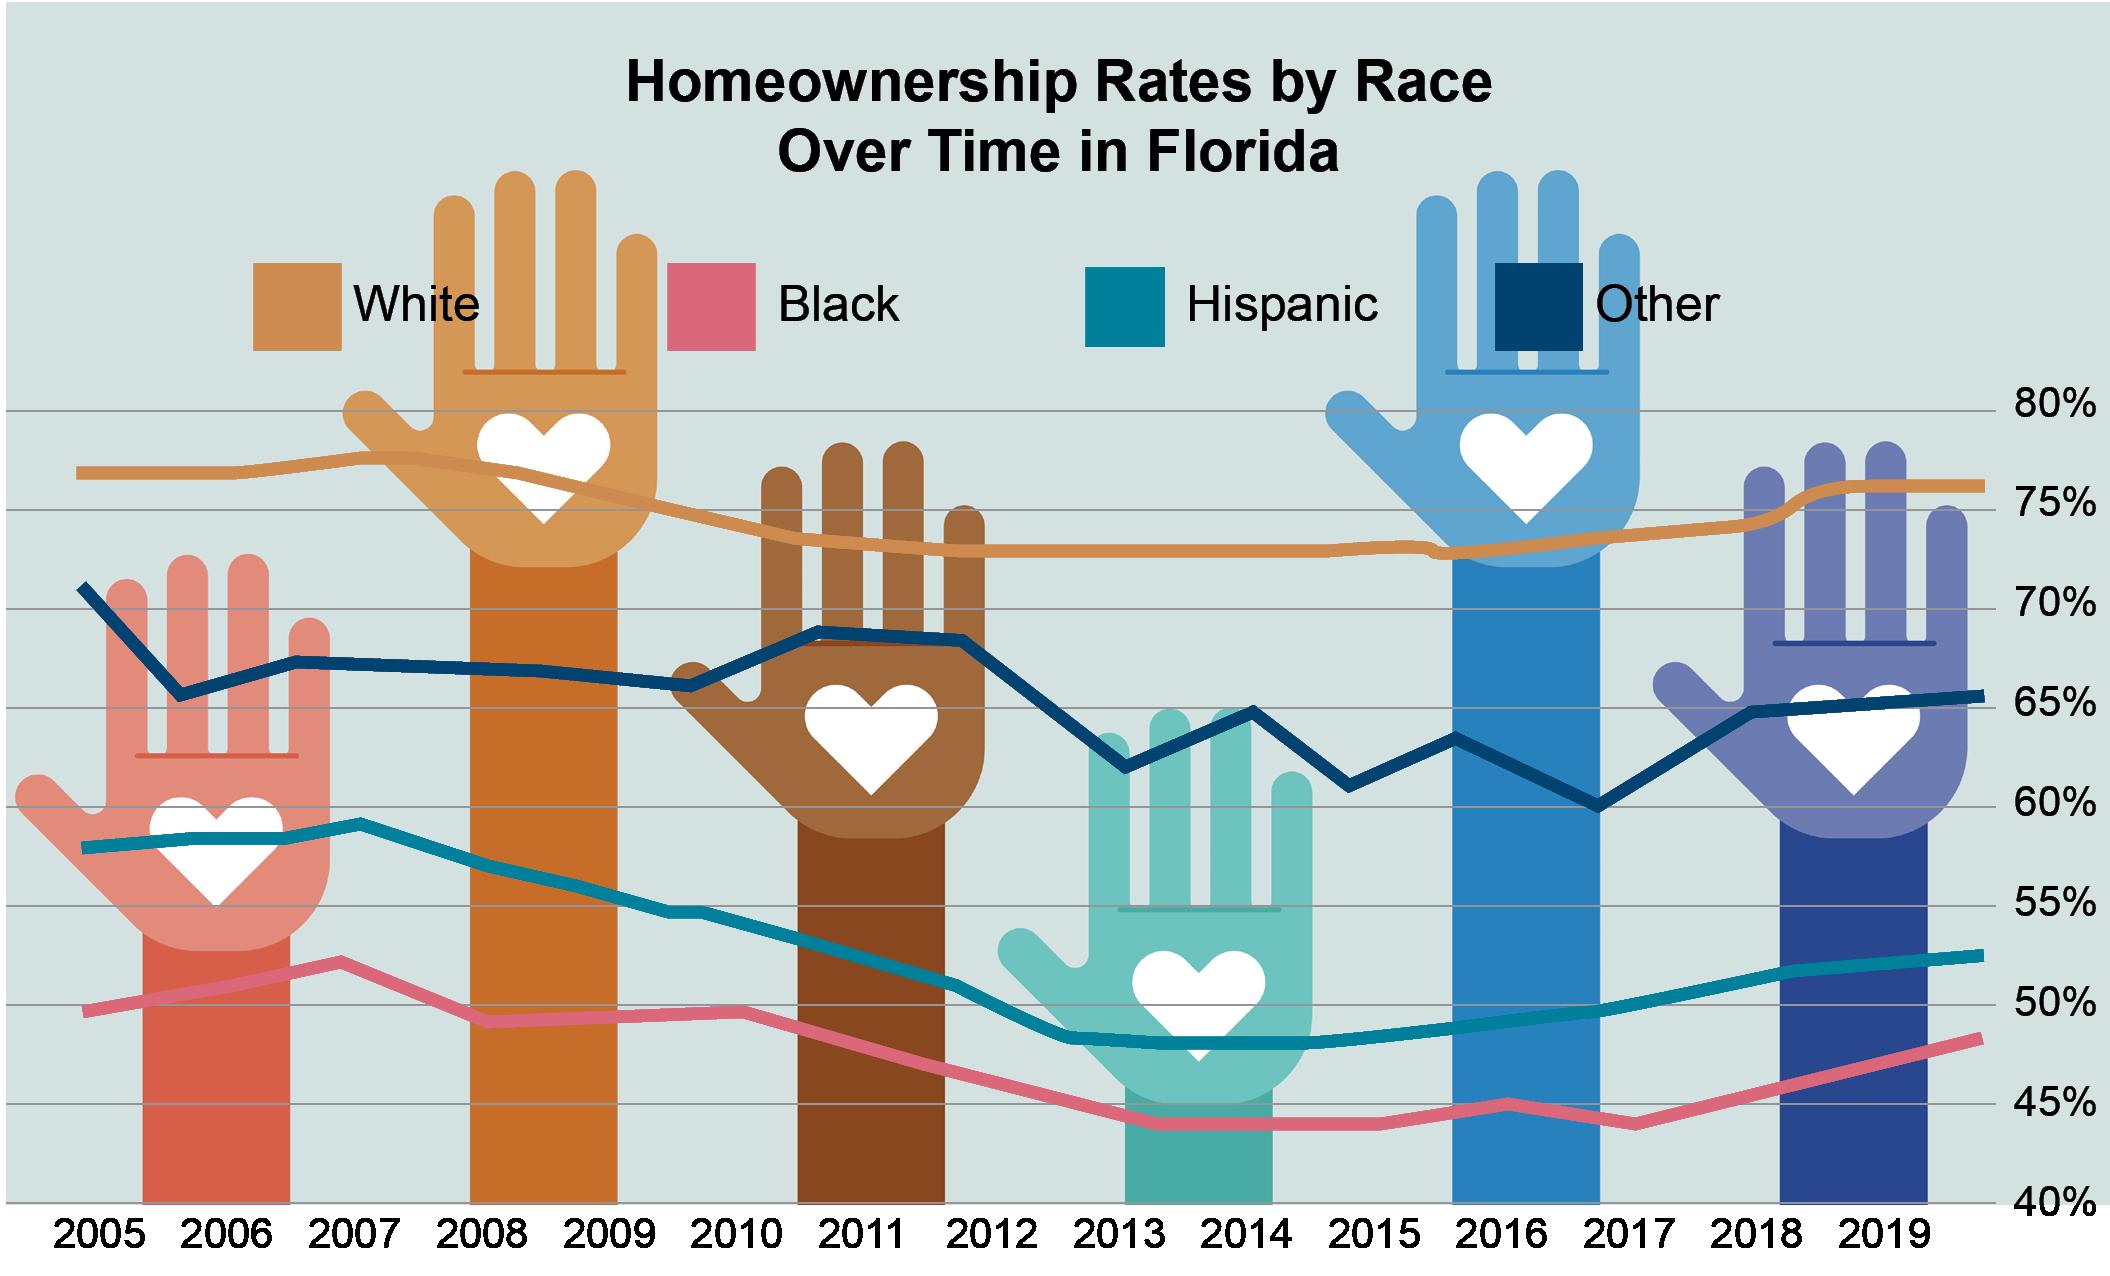
Figure 12. Home Ownership Rate by Race Since 2005 (Source: Shimberg Center 2020a)
