3 minute read
Housing Cost Burden and Tenure


Housing Cost Burden and Tenure
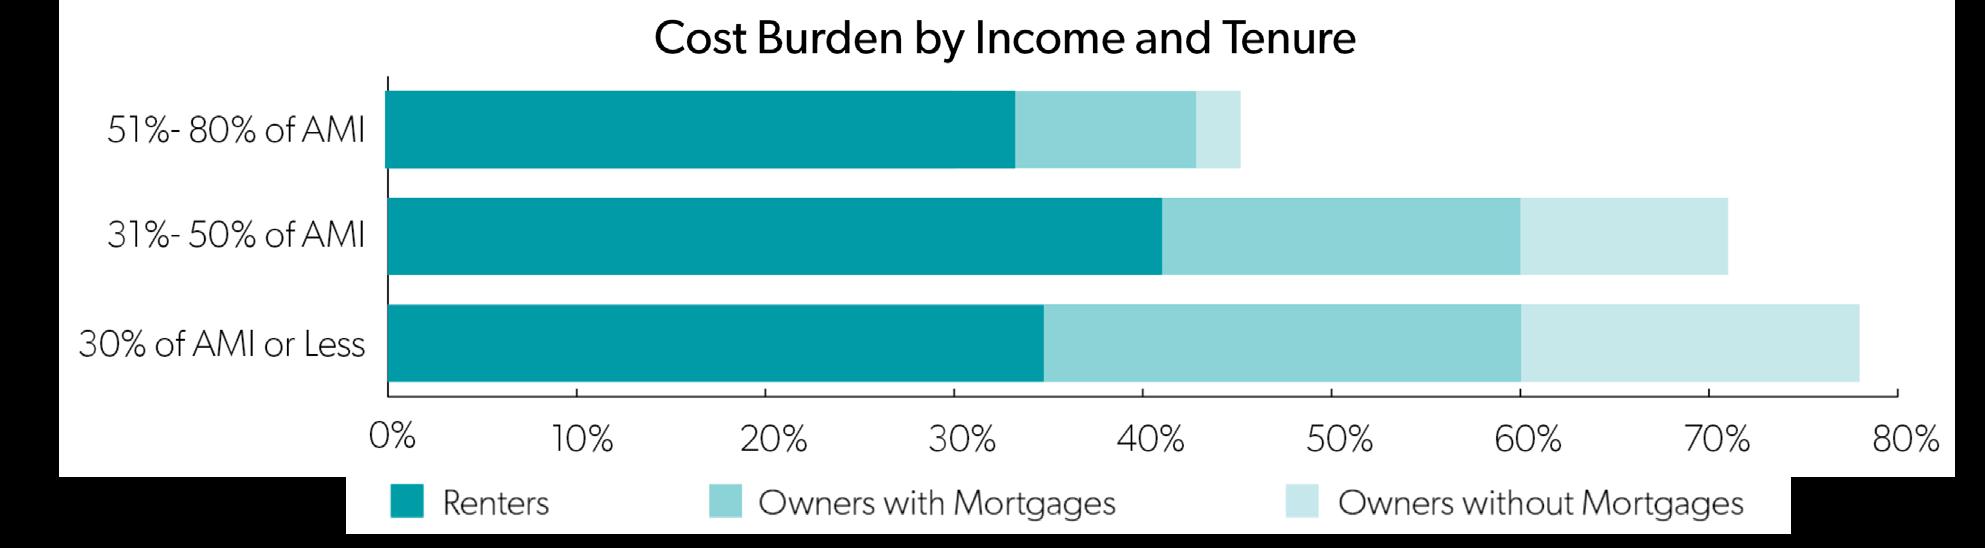
Figure 2 shows the distribution of cost-burdened households by income bracket and tenure in Florida. Not surprisingly, the share of cost-burdened households for each tenure type increases as income decreases. Costburden is widespread among low-income renters. In the extremely low-income (ELI) and > 30-50% AMI brackets, 77% and 70% of all households are cost-burdened, respectively.
Advertisement
Black and Hispanic households have far higher cost burden at lower incomes than white households and households of other races. At the very low income level (between 30% AMI and 50% AMI), Black and Hispanic households are almost 20% more likely to be cost burdened than white households. As shown in figure 4, this disparity seems to be primarily driven by the far lower rate of homeownership (and particularly homes owned “free and clear”) for Black and Hispanic households.
While Black/African American households and Hispanic households have lower income than white and other races households and would thus face higher cost burden in any case, the vastly lower homeownership rates for Black and Hispanic households leads to higher cost burden for these households, even at comparable incomes.
There was a slight increase in the number of low-income, cost-burdened households in Florida between 2005 and 2019, from 1,794,568 to 1,985,321 but a slight decline in the share of low-income households that are costburdened, from 66% to 63%. However, not all tenure types saw a decrease in severe cost burden (Table 1). Severe cost burden increased by 36.3% among renters in the 30%-50% AMI bracket and 58.6% among low-income renters between 50% and 80 % AMI. These numbers are consistent with findings from other sources, which show that the renter cost burden has crept up the income ladder in recent years 22, 23 .
Since 2005, there has been a sharp increase in the number of cost-burdened renters but a decrease in the number of cost-burdened homeowners, except for extremely lowincome cost-burdened owners without a mortgage. The share of cost-burdened homeowners with a mortgage has decreased for people in the below 330% AMI, 30%50% AMI, and 50%-80% AMI brackets and remained meaningfully flat for even homeowners making 30% or less of the AMI.
The 58.6% growth in severely cost-burdened renter households making between 50% and 80% AMI is troubling. This trend suggests that while lower interest rates since the Great Recession have made homes more affordable for new buyers, renters do not enjoy these benefits. This trend is likely to continue and even worsen as the COVID-19 pandemic damages the low wage job market while driving interest rates even lower.
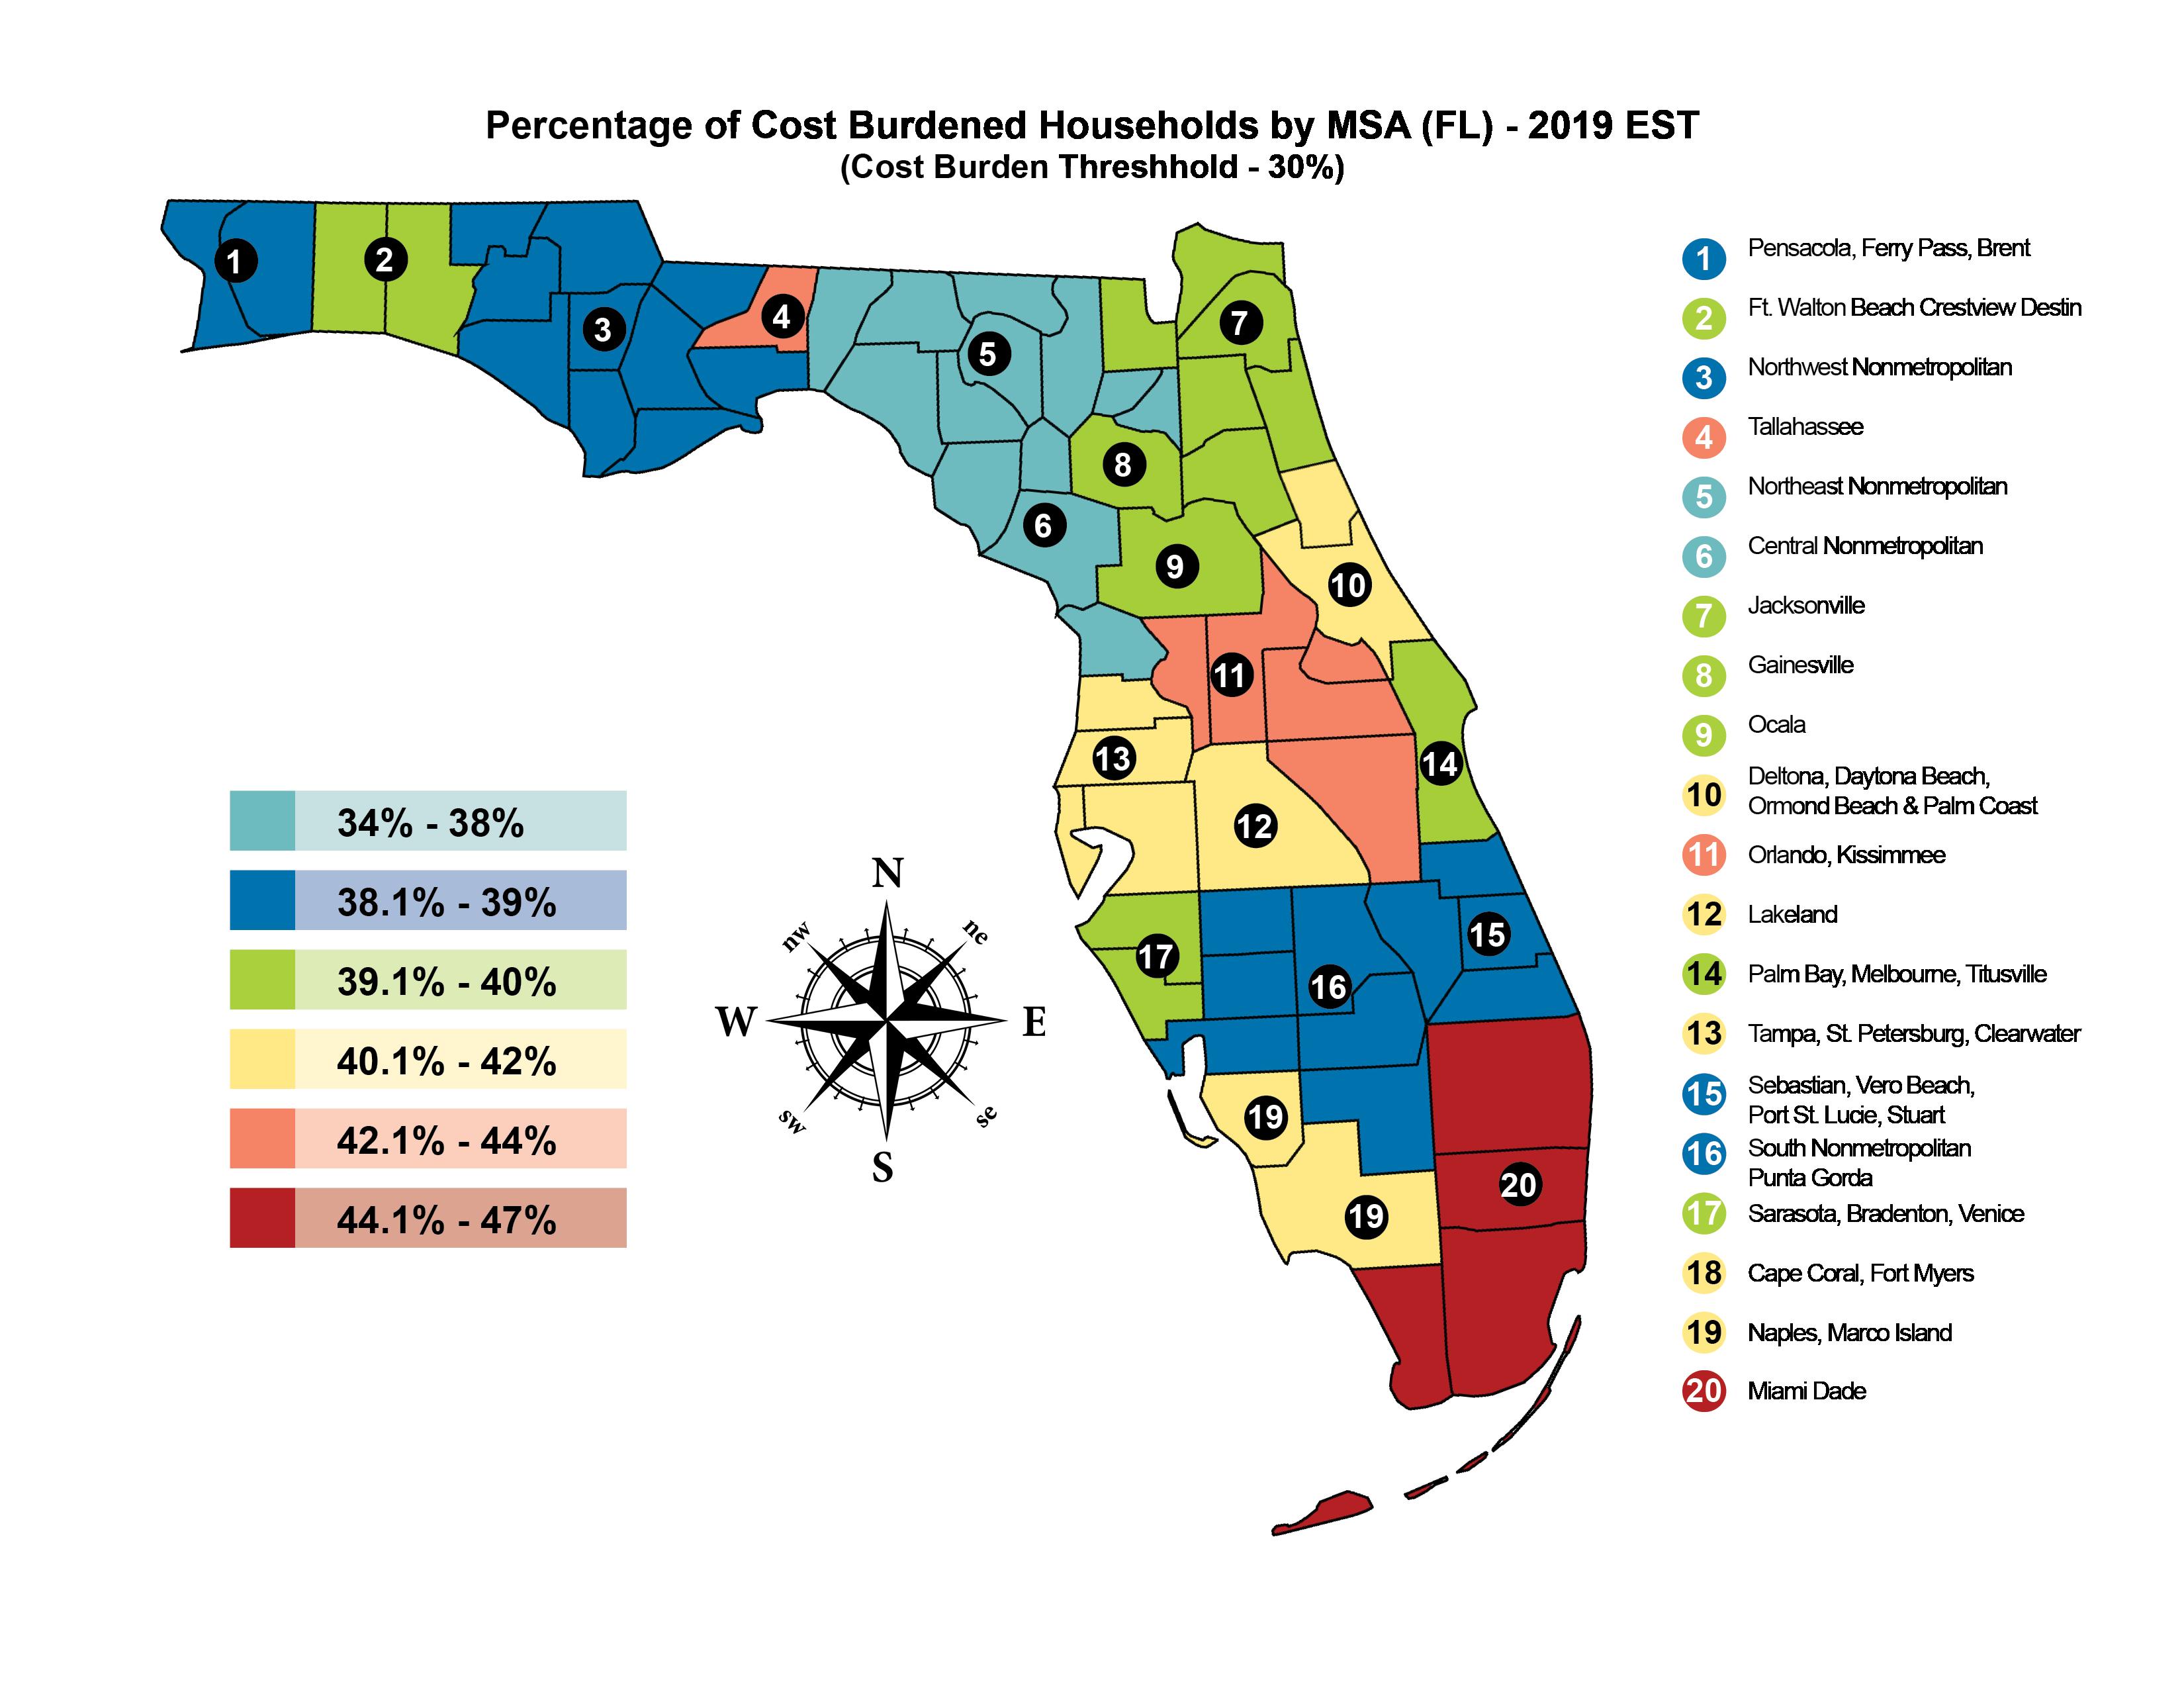
Of course, cost-burdened households are not evenly spread across the state. Cost-burden is concentrated in South Florida, with the Miami-Dade, Fort Lauderdale, and West Palm Beach metropolitan statistical areas (MSAs) topping the list of most cost-burdened urban areas. They are followed by Tallahassee, where low housing costs are balanced by large low-income and student populations. At the bottom of the list, rural areas across the state are far less likely to be cost-burdened than urban areas. However, this is somewhat complicated by transportation costs that often lead to higher overall costs than in urban areas (discussed in more detail in Figure 6).
Figure 2. Severely Cost Burdened Florida Households by Tenure.
(Source: Shimberg Center 2020a.)
Figure 3. Cost Burden by income and race.
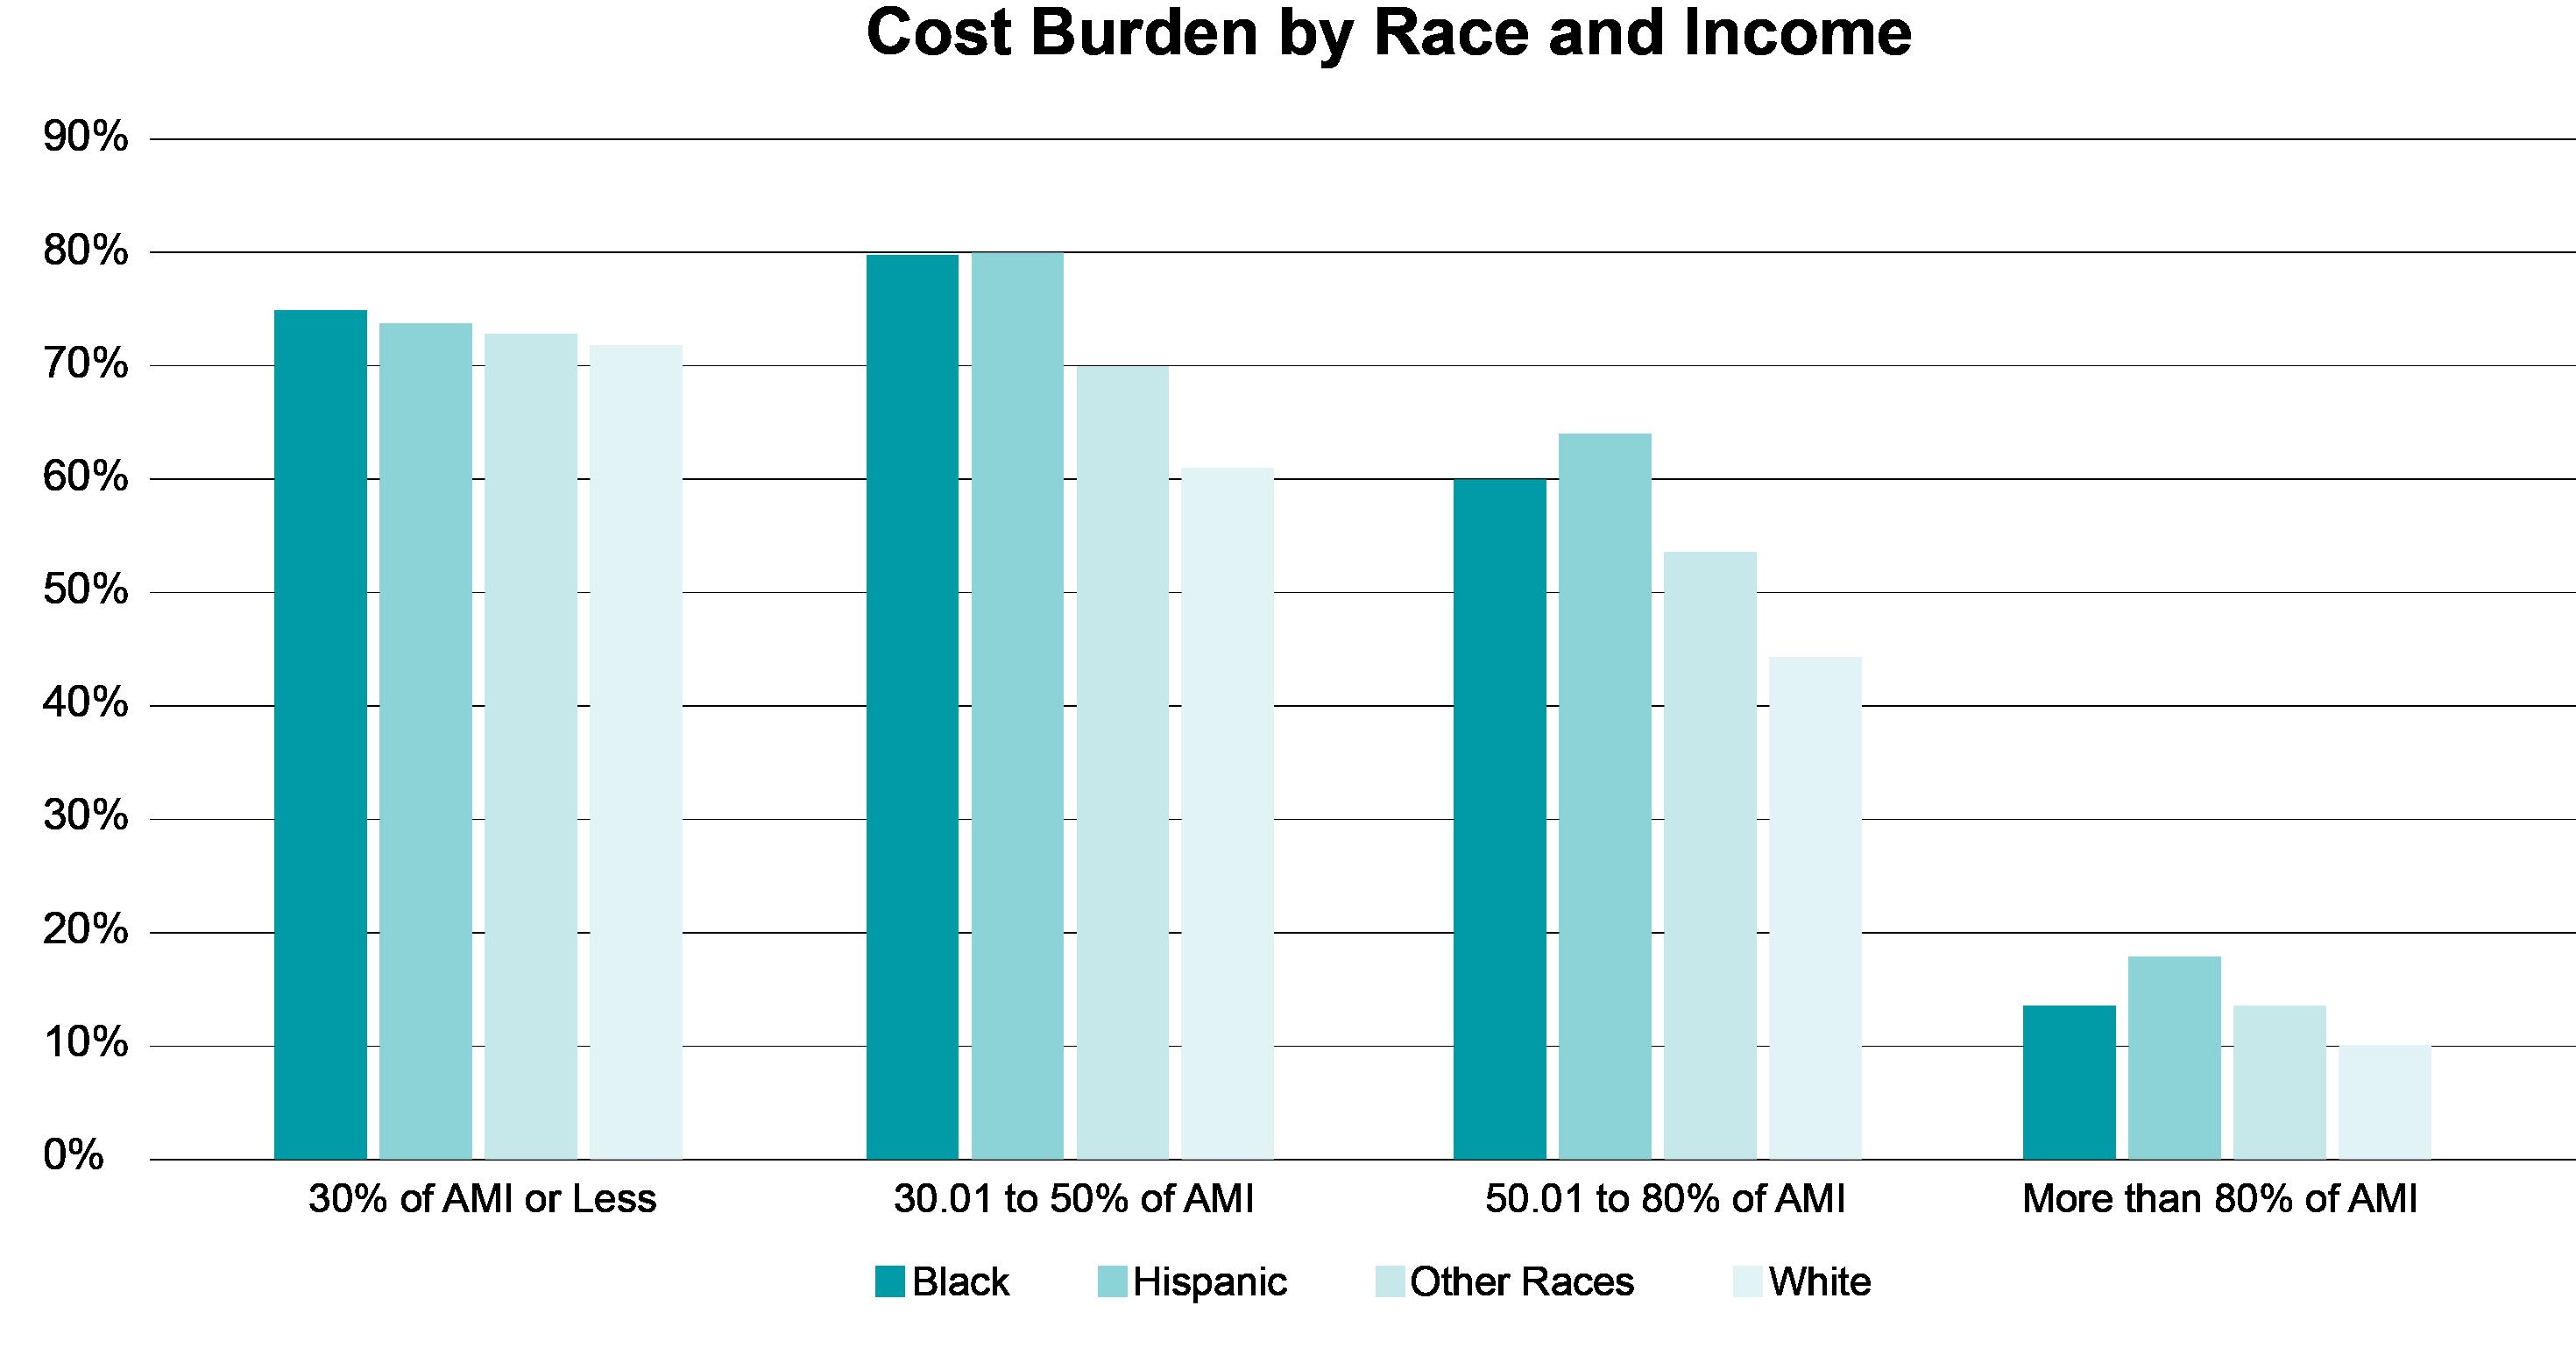
(Source: Shimberg Center 2020a.)

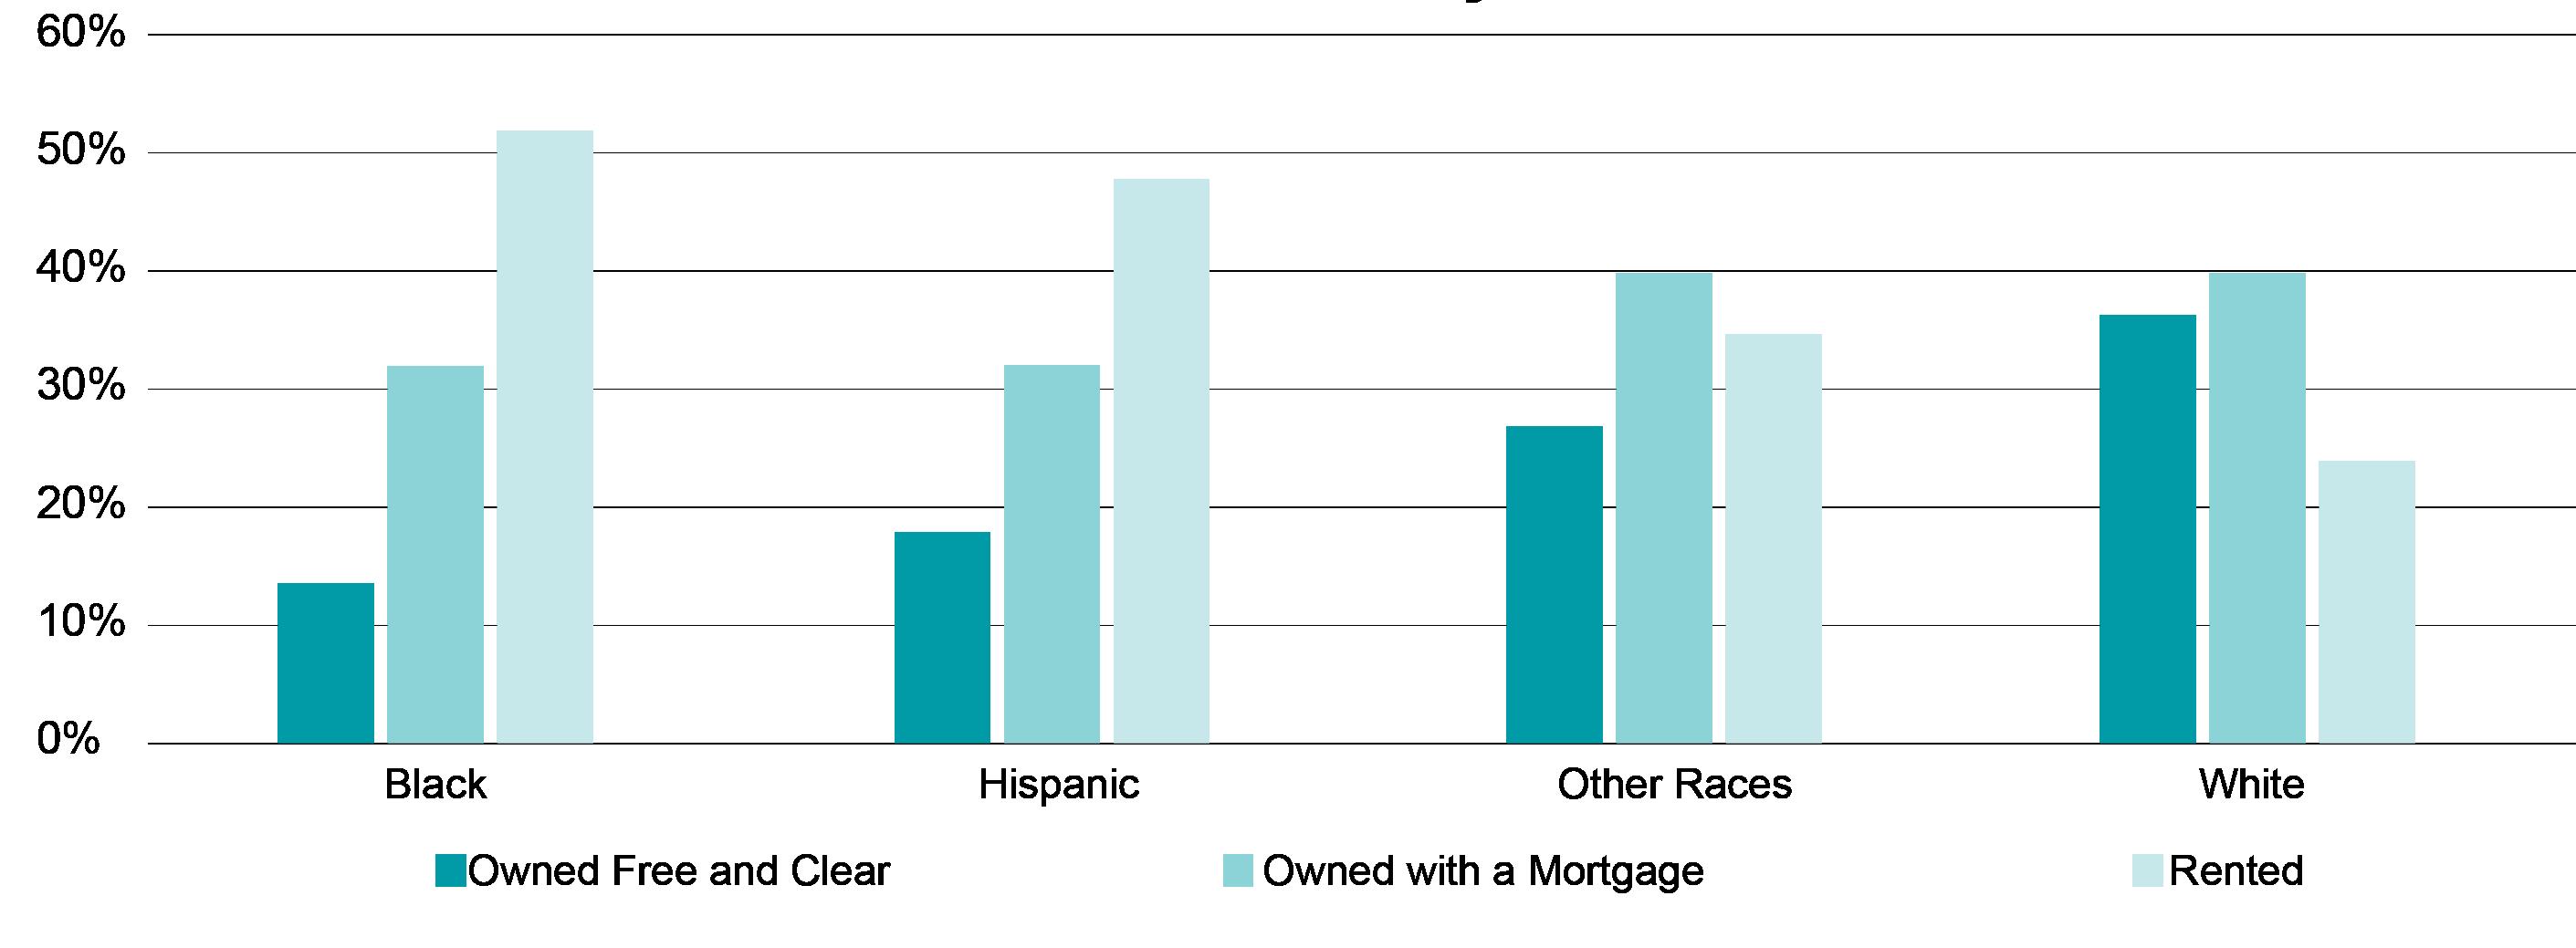
Figure 4. Tenure by Race (Source: Shimberg Center 2020a.)
Table 1. Changes in Severe Cost Burden Among Florida Households by Tenure and Income Bracket.
(Source: Shimberg Center 2020a.)
Severe Cost Burden Percentage Point Change 2005 - 2018 30% AMI or Less >30% to 50% AMI >50% to 80% AMI
Owner Households with Mortgage Owner Households without Mortgage Renter Households -4.9% 41.9% 21.2% -19% -18.3% 36.3% -38.7% -2.3% 58.6%