Florida’s Nursing Workforce Characteristics:
An Analysis of Florida’s 2023–2024 Licensure Data
Florida Center for Nursing
Headquartered at the University of South Florida College of Nursing Tampa, FL
Report Citation Information:
Florida Center for Nursing (2026). Florida’s Nursing Workforce Characteristics:
An Analysis of Florida’s 2023-2024 Licensure Data. Tampa, FL.

Report prepared by: Rayna Letourneau, PhD, RN, FAAN
Executive Director, Florida Center for Nursing
Associate Professor, University of South Florida College of Nursing
Acknowledgements
The Florida Center for Nursing (FCN) extends its appreciation to the many individuals and organizations whose support made this report possible. We sincerely thank Florida’s LPNs, RNs, and APRNs for completing the FCN Nursing Workforce Survey during licensure renewal; their participation provides the essential data that underpin this analysis.
A special thanks to the University of South Florida College of Nursing Communications and Marketing team for their contributions to the editing, layout, and design of this technical report, and for their support in preparing it for publication.
We gratefully acknowledge the Florida Department of Health, Division of Medical Quality Assurance, and the Florida Board of Nursing for their continued partnership and for facilitating access to licensure and renewal data that enable FCN to fulfill its statutory mandate. FCN also recognizes the contributions of the University of South Florida IT Department and the University of South Florida College of Nursing, whose technical and institutional support strengthen our data systems and operations.
We appreciate the assistance of the GlobalData Health Workforce Modeling team for their work in supporting data management and infrastructure, with specific thanks to Clark Ruttinger and Patrick Zarek. Finally, we acknowledge the efforts of Jo Serpico, FCN Data Analyst, for his contributions to the preparation and management of the datasets used in this report.
Executive Summary
Purpose & Mandate
Purpose & Mandate
The Florida Center for Nursing (FCN), under §464.0195, Florida Statutes, monitors and reports on the supply, demand, and educational capacity of Florida’s nursing workforce. This report provides an updated analysis based on data collected during the 2023–2024 licensure renewal cycle, oKering actionable insights for policymakers, educators, health care employers, and industry stakeholders.
The Florida Center for Nursing (FCN), under §464.0195, Florida Statutes, monitors and reports on the supply, demand, and educational capacity of Florida’s nursing workforce. This report provides an updated analysis based on data collected during the 2023–2024 licensure renewal cycle, oKering actionable insights for policymakers, educators, health care employers, and industry stakeholders.
Data & Methods
Data & Methods
FCN analyzed responses from its biennial nursing workforce survey administered at license renewal for LPNs, RNs, and APRNs. After validation and cleaning, FCN applied a standard rule to avoid double counting nurses with multiple active licenses (counting each nurse once at the highest license level). Analyses included descriptive statistics, trend comparisons, and selected regional assessments. A key limitation is potential misclassification when nurses practice below their highest active license.
FCN analyzed responses from its biennial nursing workforce survey administered at license renewal for LPNs, RNs, and APRNs. After validation and cleaning, FCN applied a standard rule to avoid double counting nurses with multiple active licenses (counting each nurse once at the highest license level). Analyses included descriptive statistics, trend comparisons, and selected regional assessments. A key limitation is potential misclassification when nurses practice below their highest active license.
Workforce Size & Participation
Workforce Size & Participation
• Florida reported 497,311 active nursing licenses in 2023–2024 (LPN: 63,758; RN: 375,882; APRN: 57,671), an increase of 55,950 since 2020–2021, largely due to RN growth (+49,213).
• Florida reported 497,311 active nursing licenses in 2023–2024 (LPN: 63,758; RN: 375,882; APRN: 57,671), an increase of 55,950 since 2020–2021, largely due to RN growth (+49,213).
• 61.4% of nurses completed the survey, down from 83% in 2020–2021, signaling a need to strengthen engagement to support planning accuracy.
• 61.4% of nurses completed the survey, down from 83% in 2020–2021, signaling a need to strengthen engagement to support planning accuracy.
Licensure & Mobility
Licensure & Mobility
• Florida nurses are less likely to hold multistate licenses than U.S. averages (LPNs: 21.4% vs. 32.6%; RNs: 21% vs. 35.9%), potentially aKecting workforce flexibility and cross-jurisdictional responsiveness.
• Florida nurses are less likely to hold multistate licenses than U.S. averages (LPNs: 21.4% vs. 32.6%; RNs: 21% vs. 35.9%), potentially aKecting workforce flexibility and cross-jurisdictional responsiveness.
Demographics
• Florida’s nursing workforce is more racially and ethnically diverse than national benchmarks (higher representation of Black and Hispanic nurses).
• The workforce is older overall: only 7.2% of nurses are under age 30, indicating pipeline risk as retirements rise.
Education & Trends
• Among RNs, BSN is the most common highest degree (46.5%), with associate/diploma preparation declining from 56% (2017) to 40% (2023).
• Graduate degree-prepared RNs increased from 7% to 13% (2017–2023).
• A gap persists in doctorally prepared RNs (PhD in nursing: 0.3% in Florida vs. 1.6% U.S.), which may constrain faculty recruitment and nursing education program expansion.
Practice Characteristics
• Setting: LPNs are concentrated in elderly care (37.9%); RNs practice primarily in hospitals (64%); APRNs are split across hospitals (33.6%) and physician occes (26.4%). Academic roles remain one of the smallest employment categories across all license types, challenging eKorts to grow educational capacity.
• Specialties: LPNs most commonly practice in geriatrics; RNs are more widely dispersed; APRNs concentrate in adult/family health (27.1%).
• Hours & Status: Most RNs and APRNs work 21–40 hours/week; a majority of LPNs report ≤20 hours/week, suggesting some rely on multiple roles. Full-time status predominates across all groups.
• Years Licensed: LPNs and RNs skew more long-tenured; APRNs are newer cohorts, reflecting recent growth.
Intentions & Outlook (Five-Year Horizon)
• Most nurses plan to work the same amount (LPNs: 46.7%; RNs: 54.8%; APRNs: 65.9%).
• Roughly one-third of LPNs and RNs plan to advance education, signaling continued upskilling.
• 12.2% of RNs intend to leave or retire, elevating near-term replacement needs.
Implications for Florida
• Sustained RN growth is positive, but aging demographics, lower multistate licensure, and limited academic stacng pose strategic risks to workforce stability, training capacity, and access.
• Declining survey response rates reduce visibility into real-time workforce dynamics, warranting targeted outreach and streamlined data collection.
• 12.2% of RNs intend to leave or retire, elevating near-term replacement needs.
Implications for Florida
• Sustained RN growth is positive, but aging demographics, lower multistate licensure, and limited academic stacng pose strategic risks to workforce stability, training capacity, and access.
• Declining survey response rates reduce visibility into real-time workforce dynamics, warranting targeted outreach and streamlined data collection.
Recommendations
1. Reinforce pipeline & retention: Expand clinical placements, transition-to-practice supports, and targeted retention initiatives in high-need settings (elderly care, hospital medical-surgical settings, behavioral health).
2. Expand educator capacity: Invest in faculty recruitment/retention (doctoral pathways, compensation incentives) to sustain program growth.
3. Enhance mobility: Encourage multistate licensure uptake to improve surge capacity and regional responsiveness.
4. Strengthen data quality: Improve survey participation through integrated renewal prompts, reminders, and stakeholder partnerships to restore response rates.
Conclusion
Florida’s nursing workforce is larger and more diverse than in prior cycles, but aging trends, faculty shortages, and participation gaps present material risks. Consistent with FCN’s statutory mission, these findings inform evidence-based policies and investments to ensure a succient, well-prepared nursing workforce for Florida’s growing and aging population.
List of Acronyms & Abbreviations
Acronym/ Abbreviation
U.S.
WC
Definition
Associate Degree in Nursing
Advanced Practice Registered Nurse
Bachelor of Science in Nursing
Doctor of Nursing Practice
East Central
Florida Center for Nursing
Licensed Practical Nurse
North Central
Northeast
Northwest
Registered Nurse
Southeast
Southwest
United States
West Central
Introduction
The Florida Center for Nursing (FCN) is statutorily mandated under Section 464.0195, Florida Statutes, to monitor and report on the supply, demand, and educational capacity of Florida’s nursing workforce. This mandate underscores the state’s commitment to developing a sustainable nursing workforce capable of meeting the health care needs of Florida’s growing and aging population. In alignment with this charge, FCN conducts ongoing analyses of workforce data to identify emerging trends, understand regional variations, and provide timely and actionable information to policymakers, educators, health care employers, and industry stakeholders.
This report contributes to that statutory mission by presenting an updated analysis of Florida’s nursing workforce based on data collected during the licensure renewal process. The findings offer insight into employment patterns, workforce participation, educational progression, and other key indicators essential for projecting future nursing supply. By consolidating and examining these data at regular intervals, FCN supports evidence-informed decision-making that strengthens the state’s health care system and helps ensure Floridians have access to a sufficient and well-prepared nursing workforce.
Methods
Methods
Data for this report were obtained from the Florida Center for Nursing’s biennial nursing workforce survey, administered in conjunction with the license renewal process for all licensed practical nurses (LPNs), registered nurses (RNs), and advanced practice registered nurses (APRNs) in Florida. Because Florida nurses renew their licenses every two years, this method provides a regular and comprehensive dataset aligned with the requirements outlined in Section 464.0195, Florida Statutes, which directs FCN to collect, analyze, and report information on the supply of nurses in the state.
Data for this report were obtained from the Florida Center for Nursing’s biennial nursing workforce survey, administered in conjunction with the license renewal process for all licensed practical nurses (LPNs), registered nurses (RNs), and advanced practice registered nurses (APRNs) in Florida. Because Florida nurses renew their licenses every two years, this method provides a regular and comprehensive dataset aligned with the requirements outlined in Section 464.0195, Florida Statutes, which directs FCN to collect, analyze, and report information on the supply of nurses in the state.
The workforce survey collected self-reported information on employment status, practice setting, work hours, geographic location, educational attainment, and other characteristics relevant for assessing the current and future availability of nurses. After data extraction, FCN performed validation, cleaning, and categorization to ensure consistency and analytic reliability.
The workforce survey collected self-reported information on employment status, practice setting, work hours, geographic location, educational attainment, and other characteristics relevant for assessing the current and future availability of nurses. After data extraction, FCN performed validation, cleaning, and categorization to ensure consistency and analytic reliability.
To avoid double counting individuals who hold more than one nursing license (e.g., RN + APRN or LPN + RN), FCN applied a standard classification rule across the dataset. When a respondent holds multiple active nursing licenses, we assumed the nurse was practicing at the highest level of licensure and counted them once, categorized under the license type with the highest scope of practice (e.g., APRN > RN > LPN). This assumption aligns with common workforce analytic approaches; however, it represents an important limitation. The survey does not validate the licensure level at which the nurse is practicing, nor does it confirm whether the nurse splits time across roles. As a result, it is possible that some individuals may be misclassified if they are actively employed in a lower level role despite holding a higher level license. This limitation should be considered when interpreting workforce counts, role distributions, and capacity estimates.
To avoid double counting individuals who hold more than one nursing license (e.g., RN + APRN or LPN + RN), FCN applied a standard classification rule across the dataset. When a respondent holds multiple active nursing licenses, we assumed the nurse was practicing at the highest level of licensure and counted them once, categorized under the license type with the highest scope of practice (e.g., APRN > RN > LPN). This assumption aligns with common workforce analytic approaches; however, it represents an important limitation. The survey does not validate the licensure level at which the nurse is practicing, nor does it confirm whether the nurse splits time across roles. As a result, it is possible that some individuals may be misclassified if they are actively employed in a lower level role despite holding a higher level license. This limitation should be considered when interpreting workforce counts, role distributions, and capacity estimates.
Descriptive statistics, trend analysis, and comparative assessments by region and nurse type were used to evaluate workforce capacity characteristics. When available and applicable, local and statewide findings were compared to national nursing workforce data1 and U.S. Census estimates2 to contextualize Florida’s workforce trends within broader national patterns.
Descriptive statistics, trend analysis, and comparative assessments by region and nurse type were used to evaluate workforce capacity characteristics. When available and applicable, local and statewide findings were compared to national nursing workforce data1 and U.S. Census estimates2 to contextualize Florida’s workforce trends within broader national patterns.
Findings from this aggregated dataset inform the FCN’s technical nursing reports, which are published every two years and inform state workforce planning, educational investments, and policy development.
1 Smiley, R. A., Kaminski-Ozturk, N., Reid, M., Burwell, P., Oliveira, C. M., Shobo, Y., Allgeyer, R., Zhong, E., O’Hara, C., Volk, A., & Martin, B. (2025). The 2024 National Nursing Workforce Survey. Journal of Nursing Regulation, 16(1), S1-S88.
2 U.S. Census Bureau, Population Division. (2024). Annual estimates of the resident population for selected age groups. https://www.census.gov
1 Smiley, R. A., Kaminski-Ozturk, N., Reid, M., Burwell, P., Oliveira, C. M., Shobo, Y., Allgeyer, R., Zhong, E., O’Hara, C., Volk, A., & Martin, B. (2025). The 2024 National Nursing Workforce Survey. Journal of Nursing Regulation, 16(1), S1-S88.
2 U.S. Census Bureau, Population Division. (2024). Annual estimates of the resident population for selected age groups. https://www.census.gov
Findings
During the 2023–2024 license renewal cycle, Florida had 497,311 active nursing licenses, including 63,758 LPNs, 375,882 RNs, and 57,671 APRNs, as shown in Table 1. This represents an increase of 55,950 licenses compared with the 2020–2021 cycle, driven primarily by growth in RN licensure. Between the 2020–2021 and 2023–2024 cycles, the number of RN licenses increased by 49,213.
A total of 305,247 nurses in Florida (61.4%) responded to the FCN Nursing Workforce Survey during the 2023–2024 cycle. In comparison, 366,235 nurses (83%) responded in the 2020–2021 cycle. Although the number of nurses in the workforce increased, the survey response rate decreased by 21.6 percentage points since the 2020–2021 licensure cycle.
Table 1
Active Licenses and Survey Response Rates by Nursing License Type, 2023–2024 Licensure Cycle
Multistate Licensure
Table 2 compares the share of nurses holding a multistate license in Florida with U.S. averages for the 2023–2024 license cycle. Florida’s rates are lower across both license types, LPNs: 21.4% vs. 32.6% (–11.2 percentage points) and RNs: 21% vs. 35.9% (–14.9 percentage points).
Table 2
Multistate Licensure by Nursing License Type, 2023–2024 Licensure Cycle
Florida’s Nursing Workforce Demographic Characteristics
Age
Table 3 compares the age distribution of Florida’s nursing workforce with the national nursing workforce, as well as Florida and U.S. population demographics. Younger nurses remain underrepresented: only 7.2% of Florida nurses are 29 or younger. Mid-career nurses dominate the workforce, with the 30–49 age range accounting for most of Florida’s LPNs, RNs, and APRNs, and Florida APRNs showing the highest concentration in the 40–49 age group (30.9%). These patterns indicate a maturing workforce with a relatively narrow pipeline of younger entrants, raising long -term concerns for workforce sustainability.
Table 3
Age Distribution by Nursing License Type, Florida vs. U.S., 2023–2024 Licensure Cycle
Sex
Florida continues to have a higher proportion of male nurses compared with the national average. As shown in Table 4, male nurses constitute 12.8% of the nursing workforce in Florida, compared with 10.4% nationally. The proportion of male nurses in Florida is even higher within advanced practice roles, where men represent 15.8% of APRNs.
Table 4
Sex Distribution by Nursing License Type, Florida vs. U.S., 2023–2024 Licensure Cycle
Florida, compared with 10.4% nationally. The proportion of male nurses in Florida is even higher within advanced practice roles, where men represent 15.8% of APRNs.
Table 4
Sex Distribution by Nursing License Type, Florida vs. U.S., 2023–2024 Licensure Cycle
Race and Ethnicity
The racial and ethnic composition of Florida’s nursing workforce differs notably from national patterns. Florida has a significantly lower proportion of White nurses (45.4 % LPNs, 52.9% RNs, 54% APRNs) compared with the U.S. (64.8% LPNs, 76.6% RNs), and a higher representation of Black nurses (30.7% LPNs vs. 20.1% nationally, 14.4% RNs vs. 8.6% nationally). Hispanic nurses also make up a larger share of the workforce in Florida (13.4% LPNs, 19.6% RNs, 21.4% APRNs) relative to the national nursing workforce (11.7% LPNs, 7.2% RNs), reflecting the broader demographics of the state population. These data indicate that Florida’s nursing workforce is more racially and ethnically diverse than the U.S. nursing workforce overall.
Table 5
Race and Ethnicity Distribution by Nursing License Type, Florida vs. U.S., 2023–2024 Licensure Cycle
Table 6 compares the highest nursing education levels of LPNs, RNs, and APRNs in Florida with those of the national workforce. Among Florida RNs, the most common highest degree is the baccalaureate (46.5%), followed by the associate degree (36.6%), consistent with national trends toward BSN preparation. Notably, only 0.3% of Florida’s RN workforce hold a PhD in Nursing, compared with 1.6% nationally, indicating a smaller pipeline of doctorally prepared nurses in the state. This gap may have implications for Florida’s ability to recruit and retain qualified nursing faculty, particularly as demand for academic educators continues to grow.
Table 6 compares the highest nursing education levels of LPNs, RNs, and APRNs in Florida with those of the national workforce. Among Florida RNs, the most common highest degree is the baccalaureate (46.5%), followed by the associate degree (36.6%), consistent with national trends toward BSN preparation. Notably, only 0.3% of Florida’s RN workforce hold a PhD in Nursing, compared with 1.6% nationally, indicating a smaller pipeline of doctorally prepared nurses in the state. This gap may have implications for Florida’s ability to recruit and retain qualified nursing faculty, particularly as demand for academic educators continues to grow.
Table 6
Table 6
Highest Level of Education by License Type, Florida vs. U.S., 2023–2024 Licensure Cycle Highest
Highest Level of Education by License Type, Florida vs. U.S., 2023–2024 Licensure Cycle
The educational composition of Florida’s RN workforce has shifted notably over time. Between 2017 and 2023, the proportion of RNs whose highest degree was an associate degree or diploma declined from 56% to 40%, reflecting a steady decrease in entry-level associate degree preparation. During the same period, the percentage of RNs holding a BSN increased from 36% to 47%, indicating continued progress toward a more highly educated nursing workforce. Additionally, the share of RNs with a graduate degree rose from 7% to 13%, suggesting growth in advanced education attainment and potential expansion of the pool eligible for advanced practice roles.
The educational composition of Florida’s RN workforce has shifted notably over time. Between 2017 and 2023, the proportion of RNs whose highest degree was an associate degree or diploma declined from 56% to 40%, reflecting a steady decrease in entry-level associate degree preparation. During the same period, the percentage of RNs holding a BSN increased from 36% to 47%, indicating continued progress toward a more highly educated nursing workforce. Additionally, the share of RNs with a graduate degree rose from 7% to 13%, suggesting growth in advanced education attainment and potential expansion of the pool eligible for advanced practice roles.
Florida’s Nursing Workforce Practice Characteristics
Workplace Settings
Table 8 summarizes the primary workplace settings of Florida’s nursing workforce by licensure type. Over one-third of LPNs work in elderly care (37.9%), while nearly two-thirds of RNs are employed in hospital settings (64%). Among APRNs, 33.6% practice in hospitals and 26.4% in physician offices. Across all licensure groups, academic settings represent the smallest share of employment, highlighting a limited supply of nurses working in education roles. This may pose challenges for maintaining and expanding nursing program capacity in the state.
Table 8
Workplace Settings of Florida’s Nursing Workforce, 2023–2024 Licensure Cycle
Specialty Distribution
Table 9 presents the distribution of Florida nurses across clinical specialties by licensure type. Among LPNs, geriatric/gerontology is the most common specialty (25.5%). RN specialties are more widely dispersed. APRNs are most concentrated in adult/family health (27.1%).
Specialty Distribution of Florida’s Nursing Workforce, 2023–2024 Licensure Cycle
Employment
Table 10 shows notable variation in weekly work hours across license types in Florida’s nursing workforce. Most LPNs (60.1%) work up to 20 hours per week, compared with 24.4% of RNs and 26% of APRNs, indicating that many LPNs may rely on multiple part-time roles to achieve full-time employment. In contrast, most RNs (65%) and APRNs (58.7%) work 21–40 hours per week, with APRNs showing the highest share working more than 40 hours (15.4%). Across all license types, full-time employment is the predominant status (LPNs 70.2%, RNs 75.9%, APRNs 76.5%), though LPNs continue to have the highest proportion of per-diem work (18.5%).
Table 10
Employment Status and Work Hour Patterns by License Type, Florida’s Nursing Workforce, 2023–2024 Licensure Cycle
Number of Years Licensed
Table 11 summarizes participants’ self-reported number of years since they were first licensed in Florida, highlighting distinct patterns across licensure types. Among LPNs and RNs, the largest share report being licensed for 20 or more years (26.8% and 24.3%, respectively), indicating a substantial cohort of long-tenured nurses in these groups. In contrast, APRNs are more concentrated in earlier licensure periods, with 31.3% licensed for 2–4 years and 32.7% licensed for 5–9 years. This reflects continued growth and the recent expansion of the APRN workforce. Overall, these data suggest a more experienced LPN and RN workforce alongside a younger and rapidly developing APRN workforce.
Table 11
Number of Years Licensed by License Type, Florida’s Nursing Workforce, 2023–2024 Licensure Cycle
Intention for Future Work
Table 12 summarizes nurses’ self-reported intentions for future employment over the next five years. Across all licensure types, most respondents plan to continue working the same amount, ranging from 46.7% of LPNs to 65.9% of APRNs. Approximately one-third of LPNs and RNs indicate plans to advance their education, suggesting potential increases in enrollment in higher-degree nursing programs. Notably, 12.2% of RNs report intentions to leave or retire, representing a large potential reduction in the state’s RN workforce.
Table 12
Intention for Future Work by License Type, Florida’s Nursing Workforce, 2023–2024 Licensure Cycle
Regional Nursing Workforce in Florida
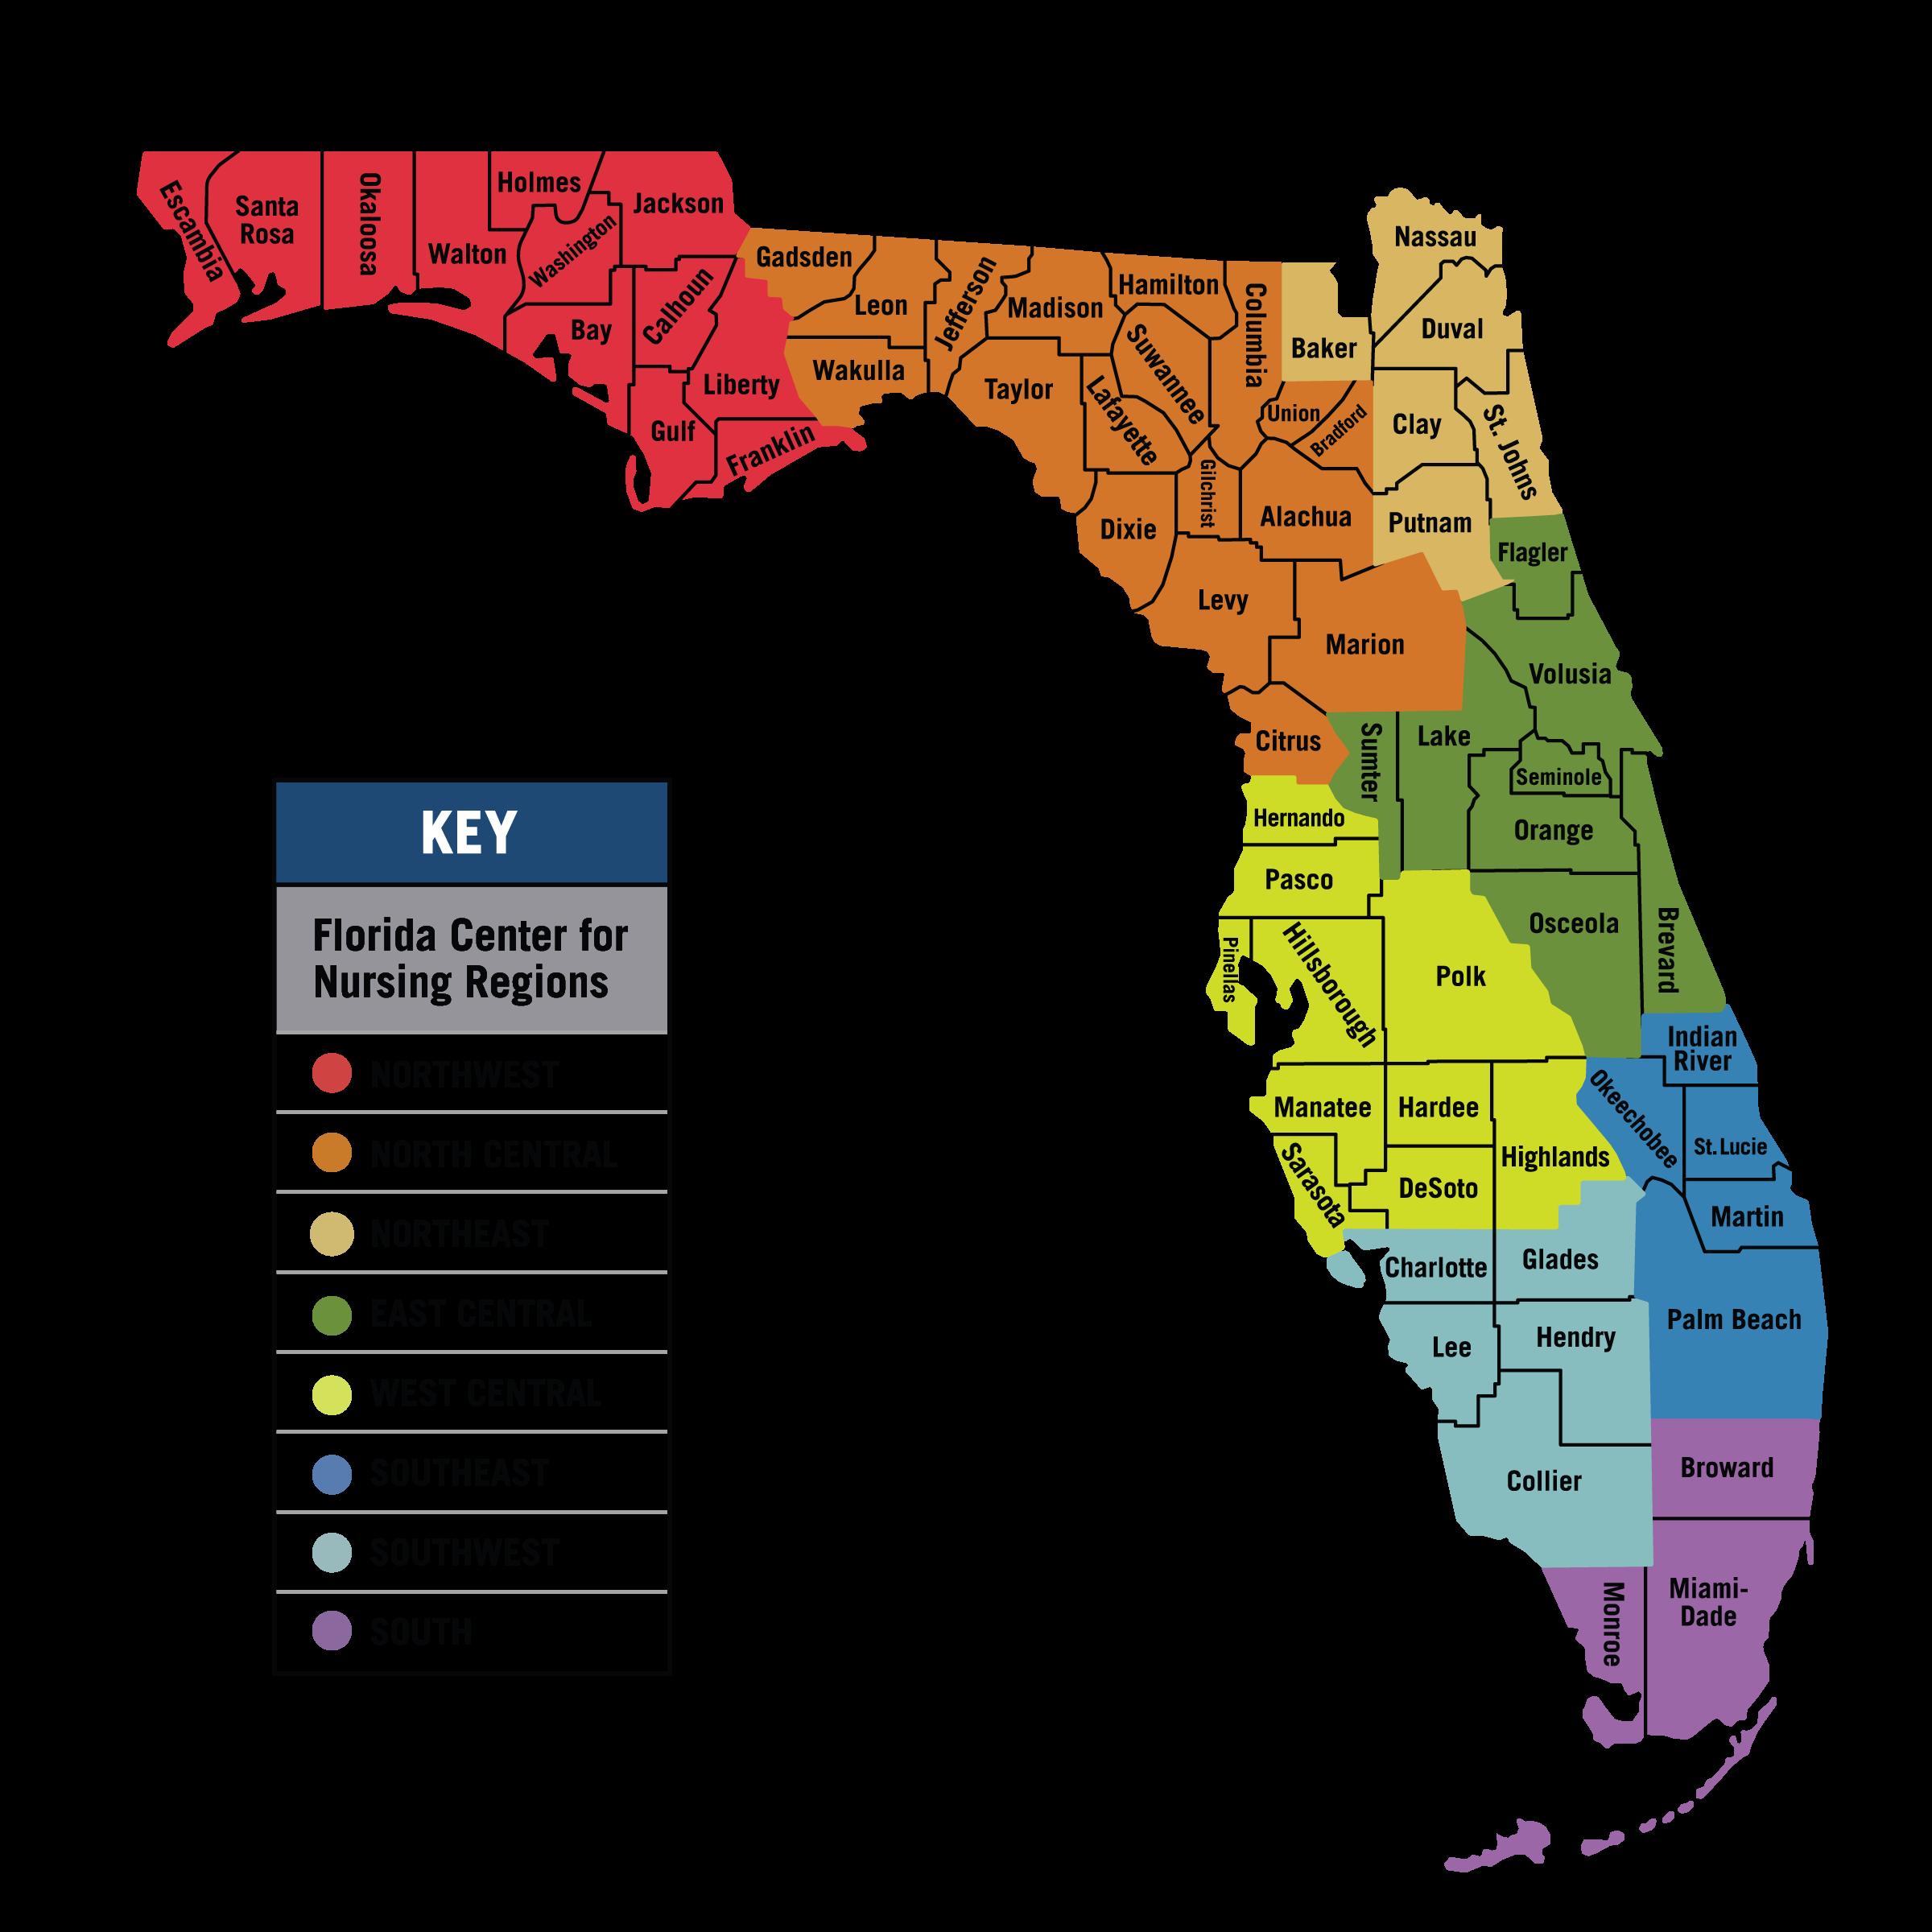
The Florida Center for Nursing aggregates statewide and regional data. Regions are identified as Northwest, North Central, Northeast, East Central, West Central, Southeast, Southwest, and South.
The Northwest region covers Bay, Calhoun, Escambia, Franklin, Gulf, Holmes, Jackson, Liberty, Okaloosa, Santa Rosa, Walton, and Washington counties.
The North Central region covers Alachua, Bradford, Citrus, Columbia, Dixie, Gadsden, Gilchrist, Hamilton, Jefferson, Lafayette, Leon, Levy, Madison, Marion, Suwannee, Taylor, Union, and Wakulla counties.
The Northeast region covers Baker, Clay, Duval, Nassau, Putnam, and St. Johns counties.
The East Central region covers Brevard, Flagler, Lake, Orange, Osceola, Seminole, Sumter, and Volusia counties.
The West Central region covers DeSoto, Hardee, Hernando, Highlands, Hillsborough, Manatee, Pasco, Pinellas, Polk, and Sarasota counties.
The Southeast region covers Indian River, Martin, Okeechobee, Palm Beach, and St. Lucie counties.
The Southwest region covers Charlotte, Collier, Glades, Hendry, and Lee counties.
The South region covers Broward, Miami-Dade, and Monroe counties.
The following map demonstrates the eight geographic regions of Florida.
Geographic Distribution
Geographic Distribution
Figure 2 displays the geographic distribution of Florida’s nursing workforce across the eight FCN regions. The West Central (WC) region accounts for the largest share of nurses (25.87%), followed by the South (S) region at 20.74% and the East Central (EC) region at 18.74%. In contrast, the Northwest (NW) and Southwest (SW) regions represent the smallest proportions of the workforce, at 5.81% and 6.21%, respectively. These data indicate a concentration of nurses in Florida’s more densely populated regions, reflecting population patterns and regional health care service demand.
Figure 2 displays the geographic distribution of Florida’s nursing workforce across the eight FCN regions. The West Central (WC) region accounts for the largest share of nurses (25.87%), followed by the South (S) region at 20.74% and the East Central (EC) region at 18.74%. In contrast, the Northwest (NW) and Southwest (SW) regions represent the smallest proportions of the workforce, at 5.81% and 6.21%, respectively. These data indicate a concentration of nurses in Florida’s more densely populated regions, reflecting population patterns and regional health care service demand.
Figure 2
Figure 2
Regional Distribution of Florida’s Nursing Workforce, 2023-2024 Licensure Cycle
Regional Distribution of Florida’s Nursing Workforce, 2023-2024 Licensure Cycle
Figure 3 displays the number of actively licensed LPNs, RNs, and APRNs across Florida’s eight FCN regions. RNs represent the largest proportion of the nursing workforce in every region, with the greatest concentrations observed in the West Central, South, and East Central regions. LPN and APRN counts follow similar geographic patterns, with higher numbers located in these more densely populated regions and substantially smaller numbers in the North Central, Northeast, Southwest, and Northwest regions.
Figure 3 displays the number of actively licensed LPNs, RNs, and APRNs across Florida’s eight FCN regions. RNs represent the largest proportion of the nursing workforce in every region, with the greatest concentrations observed in the West Central, South, and East Central regions. LPN and APRN counts follow similar geographic patterns, with higher numbers located in these more densely populated regions and substantially smaller numbers in the North Central, Northeast, Southwest, and Northwest regions.
Figure 3
Regional Distribution of Nurses by License Type, Florida’s Nursing Workforce, 2023–2024
Licensure Cycle
Northwest Region
During the 2023-2024 license renewal cycle, the Northwest (NW) region, including Bay, Calhoun, Escambia, Franklin, Gulf, Holmes, Jackson, Liberty, Okaloosa, Santa Rosa, Walton, and Washington counties, was home to 23,059 active nursing licenses, up 5.8% from last reporting cycle.
There were 15,638 nurses from the NW region (67.8%) who responded to the FCN Nursing Workforce Survey.
Table 13
Average Age and Active Licenses in the Northwest Region, 2023–2024 Licensure Cycle
Age
In the Northwest (NW) region, the nursing workforce is concentrated in the mid-career age ranges, with RNs (23.8%) and APRNs (26.2%) between 30–39, and LPNs (25.1%) and APRNs (28.8%) between 40–49. Early-career nurses are underrepresented, with only 7.8% of LPNs, 9.4% of RNs, and 1.1% of APRNs under age 30. This is comparable to the Florida nurse workforce (7.2%) but well below the national share. Nurses aged 50 or older make up roughly 44–46% of the NW workforce across licensure groups, aligning closely with statewide and national nursing age distributions. Overall, the region’s age profile reflects a mature workforce with limited representation of younger nurses entering practice.
Table 14
Ages of Nurses in the Northwest Region, 2023–2024 Licensure Cycle
Sex
In the Northwest region, the nursing workforce is predominantly female across all licensure types, with 92.7% of LPNs, 88.8% of RNs, and 83% of APRNs identifying as female. The proportion of male nurses in the Northwest, particularly among APRNs (17%), is higher than the national average for male nurses.
Table 15
Sex Ratios of Nurses in the Northwest Region, 2023-2024 Licensure Cycle
Race/Ethnicity
Race/Ethnicity
In the Northwest region, the nursing workforce is predominantly White across all licensure types, with 71% of LPNs, 78.8% of RNs, and 84.2% of APRNs identifying as White, compared with 73.9% of the region’s population. Black nurses are notably overrepresented among LPNs (17%) relative to the regional population (13.6%), while Hispanic nurses are underrepresented across all licensure groups compared with both the state (28.3%) and national (19.5%) populations. Asian nurses also make up a smaller share of the regional workforce than seen nationally.
In the Northwest region, the nursing workforce is predominantly White across all licensure types, with 71% of LPNs, 78.8% of RNs, and 84.2% of APRNs identifying as White, compared with 73.9% of the region’s population. Black nurses are notably overrepresented among LPNs (17%) relative to the regional population (13.6%), while Hispanic nurses are underrepresented across all licensure groups compared with both the state (28.3%) and national (19.5%) populations. Asian nurses also make up a smaller share of the regional workforce than seen nationally.
Table 16
Table 16
Race and Ethnicity of Nurses in The Northwest Region, 2023–2024 Licensure Cycle
Race and Ethnicity of Nurses in The Northwest Region, 2023–2024 Licensure Cycle
Education
Education
In the Northwest region, RN educational attainment is primarily at the baccalaureate level (49.1%), followed by the associate degree (31.2%). APRNs in the region hold predominantly master’s degrees (82%), with additional representation at the doctoral level, including 14.7% with a DNP and 1.3% with a PhD in Nursing. These patterns reflect a traditionally certificate-based LPN workforce, a largely BSN-prepared RN workforce, and a highly educated APRN workforce aligned with national advanced practice requirements.
In the Northwest region, RN educational attainment is primarily at the baccalaureate level (49.1%), followed by the associate degree (31.2%). APRNs in the region hold predominantly master’s degrees (82%), with additional representation at the doctoral level, including 14.7% with a DNP and 1.3% with a PhD in Nursing. These patterns reflect a traditionally certificate-based LPN workforce, a largely BSN-prepared RN workforce, and a highly educated APRN workforce aligned with national advanced practice requirements.
Table 17
Highest Nursing Degrees Earned by Nurses in the Northwest Region, 2023–2024 Licensure Cycle
North Central Region
During the 2023-2024 licensure renewal cycle, the North Central (NC) region, including Alachua, Bradford, Citrus, Columbia, Dixie, Gadsden, Gilchrist, Hamilton, Jefferson, Lafayette, Leon, Levy, Madison, Marion, Suwannee, Taylor, Union, and Wakulla counties, was home to 31,650 active nursing licenses, meaning licensure in this county is up 7.1% from last reporting cycle.
There were 21,344 respondents from the NC region (67.4%) to the FCN Nursing Workforce Survey.
Table 18
Average Age and Active Licenses in the North Central Region, 2023–2024 Licensure Cycle
Age
In Florida’s North Central region, the nursing workforce skews mid- to late-career: roughly 45%–47% of LPNs, RNs, and APRNs are 50 years or older (LPN 47.2%, RN 45.1%, APRN 47.2%), comparable to Florida overall (46.3%) and above the U.S. nursing share (43.1%). Early-career representation is limited: 8.6% of LPNs, 9.2% of RNs, and 1.2% of APRNs are under 30, slightly above Florida’s overall nurse share for LPNs/RNs (7.2%) but below the U.S. benchmark (10.9%). Mid-career cohorts are prominent, with 30–39 comprising 22.9%–25.1% across groups, and APRNs most concentrated in 40–49 (26.7%). These patterns indicate a mature workforce with a relatively narrow pipeline of younger nurses entering practice.
Table 19
Ages of Nurses in the North Central Region, 2023–2024 Licensure Cycle
Sex
In the North Central region, the nursing workforce is predominantly female across all licensure types, with 91.4% of LPNs, 87% of RNs, and 85.9% of APRNs identifying as female. Male representation ranges from 8.6% to 14.1%, closely aligning with statewide proportions for RNs and APRNs but slightly lower for LPNs compared with the Florida average (9.8%). Overall, the region reflects a gender distribution consistent with statewide patterns, with modestly greater male participation in advanced practice roles.
Table 20
Sex Ratios of Nurses in the North Central Region, 2023–2024 Licensure Cycle
Race/Ethnicity
Race/Ethnicity
In the North Central region, the nursing workforce is predominantly White across all licensure types, with 58.9% of LPNs, 67.5% of RNs, and 73% of APRNs identifying as White, closely mirroring the regional population (66%). Black nurses are notably overrepresented among LPNs (26.4%) compared with the North Central population (18.5%), while Hispanic nurses are underrepresented across all licensure groups relative to both the Florida (28.3%) and U.S. (19.5%) populations. Asian nurses represent a small share of the regional workforce, particularly among LPNs (1.5%) and APRNs (4.2%), remaining below national levels.
In the North Central region, the nursing workforce is predominantly White across all licensure types, with 58.9% of LPNs, 67.5% of RNs, and 73% of APRNs identifying as White, closely mirroring the regional population (66%). Black nurses are notably overrepresented among LPNs (26.4%) compared with the North Central population (18.5%), while Hispanic nurses are underrepresented across all licensure groups relative to both the Florida (28.3%) and U.S. (19.5%) populations. Asian nurses represent a small share of the regional workforce, particularly among LPNs (1.5%) and APRNs (4.2%), remaining below national levels.
Table 21
Table 21
Race and Ethnicity of Nurses in the North Central Region, 2023–2024 Licensure Cycle
Race and Ethnicity of Nurses in the North Central Region, 2023–2024 Licensure Cycle
Education
Education
In the North Central region, RNs are primarily BSN-prepared (49.1%), followed by those with an associate degree (31.2%). APRNs in the region are highly educated, with 82% holding a master’s degree and an additional 16% holding a doctoral degree (DNP, PhD, or other doctoral degree). These patterns reflect a certificate-based LPN workforce, a largely baccalaureate-prepared RN workforce, and a predominantly graduate-educated APRN workforce.
In the North Central region, RNs are primarily BSN-prepared (49.1%), followed by those with an associate degree (31.2%). APRNs in the region are highly educated, with 82% holding a master’s degree and an additional 16% holding a doctoral degree (DNP, PhD, or other doctoral degree). These patterns reflect a certificate-based LPN workforce, a largely baccalaureate-prepared RN workforce, and a predominantly graduate-educated APRN workforce.
Table 22
Highest Nursing Degree Earned by Nurses in the North Central Region, 2023–2024 Licensure Cycle
Northeast Region
During the 2023-2024 license renewal cycle, the Northeast (NE) region, including Baker, Clay, Duval, Nassau, Putnam, and St. John’s counties, was home to 27,613 active nursing licenses, which is a 14.4% drop in licensure since last reporting cycle.
There were 18,077 nurses from the NE region (65.5%) who responded to the FCN Nursing Workforce survey.
Table 23
Average Age and Active Licenses in the Northeast Region, 2023–2024 Licensure Cycle
Age
In the Northeast region, early-career nurses are underrepresented: 6.5% of LPNs, 8.6% of RNs, and 1.3% of APRNs are under age 30, below the U.S. nursing benchmark (10.9%) and near or slightly above Florida overall (7.2%). The workforce is concentrated in mid-career ages, especially among APRNs, where 30–49 accounts for 60% (30–39: 25.7%; 40–49: 34.3%). Late-career nurses remain substantial, with approximately 47% of LPNs, 42% of RNs, and 39% of APRNs aged 50 or older. Overall, the NE region reflects a predominantly mid- to late-career workforce with limited representation of younger entrants.
Table 24
Ages of Nurses in the Northeast Region, 2023–2024 Licensure Cycle
Sex
In the Northeast region, the nursing workforce is predominantly female across all licensure types, with 90.8% of LPNs, 88.1% of RNs, and 85.8% of APRNs identifying as female. Male representation in the Northeast’s nursing workforce is highest among APRNs (14.1%).
Table 25
Sex Ratios of Nurses in the Northeast Region, 2023–2024 Licensure Cycle
Race/Ethnicity
In the Northeast region, the nursing workforce is majority White across licensure types (LPNs 40.8%, RNs 59.8%, and APRNs 64.7%), broadly consistent with the regional population (61.8%). Black nurses are notably overrepresented among LPNs (40.7%) relative to the regional population (21.2%), while RNs (17.3%) and APRNs (13.9%) are closer to population levels. Asian representation is higher among RNs (8.9%) and APRNs (7.1%) than in the regional (4.5%) and state (3.3%) populations. Hispanic nurses are underrepresented across all licensure groups (6–6.6%) compared with the Northeast population (11.8%), Florida (28.3%), and the U.S. (19.5%).
Table 26
Race and Ethnicity of Nurses in the Northeast Region, 2023–2024 Licensure Cycle
Education
In the Northeast region, RNs are primarily baccalaureate-prepared (49.1%), followed by those with an associate degree (31.2%). APRNs in the region are highly educated, with the vast majority holding a master’s degree (82%) and an additional 16% holding a doctoral degree (DNP, PhD, or other doctoral degree). These data reflect a certificate-based LPN workforce, a largely BSN-prepared RN workforce, and a predominantly graduate-prepared APRN workforce in the region.
Table 27
Highest Nursing Degree Earned by Nurses in the Northeast Region, 2023–2024 Licensure Cycle
East Central Region
During the 2023-2024 licensure period, the East Central (EC) region, including Brevard, Flagler, Lake, Orange, Osceola, Seminole, Sumter, and Volusia counties was home to 77,216 active nursing licenses, which is an 8.6% increase from the last reporting cycle.
There were 50,457 respondents from the EC region (65.3%) who participated in the FCN Nursing Workforce Survey.
Table 28
Average Age and Active Licenses in the East Central Region, 2023–2024 Licensure Cycle
Age
In the EC region, early-career nurses are limited: 5.2% of LPNs, 8.1% of RNs, and 1% of APRNs are under age 30, below the U.S. nursing benchmark (10.9%) and at or below the Florida overall share (7.2%). The workforce is concentrated in mid-career ages, especially among APRNs, where 30–49 accounts for 59.3% (30–39: 26.2%; 40–49: 33.1%). Older nurses comprise a substantial share, with LPNs 50+ at 53.3% and RNs 50+ at 45.2% (APRNs 39.7%), indicating a mature workforce and a relatively narrow pipeline of younger entrants. Overall, the EC age profile suggests continued reliance on mid- to late-career clinicians, particularly in advanced practice roles.
Table 29
Ages of Nurses in the East Central Region, 2023–2024 Licensure Cycle
Sex
In the East Central region, the nursing workforce is predominantly female across all licensure types, with 90.8% of LPNs, 87.6% of RNs, and 86.4% of APRNs identifying as female. Male representation among nurses in the region remains low (9.2%–13.6%).
Table 30
Sex Ratios of Nurses in the East Central Region, 2023–2024 Licensure Cycle
Race/Ethnicity
In the East Central region, the nursing workforce is predominantly White, representing 45.4% of LPNs, 55.1% of RNs, and 55.4% of APRNs, closely aligning with the regional population (53.7%). Black nurses are significantly overrepresented among LPNs (30%) compared with the regional population (14%), while their representation among RNs and APRNs (13%) aligns more closely with state and national averages. Hispanic nurses are underrepresented across all licensure types, 14.1%–17.4% compared with 27.3% of the regional population and 28.3% of the Florida population. Asian nurses account for a small share of the workforce (2.5%–8.6%) but are proportionally higher among RNs and APRNs relative to the regional population (4.2%).
Table 31
Race and Ethnicity of Nurses in the East Central Region, 2023–2024 Licensure Cycle
Education
In the East Central region, RNs are chiefly BSN-prepared (49.1%), followed by associate degrees (31.2%) and master’s degrees (14.8%). APRNs are overwhelmingly master’s prepared (82%) with 14.7% holding a DNP and 1.3% holding a PhD in Nursing.
Table 32
Highest Nursing Degree Earned by Nurses in the East Central Region, 2023–2024 Licensure Cycle
West Central Region
During the 2023-2024 license renewal cycle, the West Central (WC) region, including DeSoto, Hardee, Hernando, Highlands, Hillsborough, Manatee, Pasco, Pinellas, Polk, and Sarasota counties, was home to 103,830 active nursing licenses, which is a 6.7% increase in licensure since last reporting cycle.
There were 69,639 respondents from the WC region (67.1%) who participated in the FCN Nursing Workforce Survey.
Table 33
Average Age and Active Licenses in the West Central Region, 2023–2024 Licensure Cycle
Age
In the West Central region, early-career nurses remain limited across licensure types, with only 6.2% of LPNs, 8.4% of RNs, and 1.2% of APRNs under age 30, findings similar to the statewide nurse workforce (7.2%) but below the national benchmark (10.9%). The workforce is concentrated in the 30–49 age range, especially among APRNs, where 57.6% fall within this mid-career span. Late-career representation is substantial: 27.7% of LPNs, 24.5% of RNs, and 18.2% of APRNs are aged 60 or older, slightly above state and national averages. Overall, the WC region reflects a predominantly mid- to late-career nursing workforce with limited representation of younger entrants.
Table 34
Ages of Nurses in the West Central Region, 2023–2024 Licensure Cycle
Sex
In the West Central region, the nursing workforce is overwhelmingly female across all licensure types, with 89.4% of LPNs, 87.3% of RNs, and 86.9% of APRNs identifying as female. Male representation in the WC nursing workforce remains low (10.6%–13.1%).
Table 35
Sex Ratios of Nurses in the East Central Region, 2023–2024 Licensure Cycle
Race/Ethnicity
In the West Central (WC) region, the nursing workforce is majority White across licensure types (53.9% of LPNs, 63.3% of RNs, and 65.4% of APRNs), generally aligning with the regional population (61.2%). Black nurses are notably overrepresented among LPNs (22.3%) relative to the WC population (11.6%), while their representation among RNs (9.9%) and APRNs (10.1%) is closer to population levels. Hispanic nurses are underrepresented across all groups (12.4%–14.2%) compared with the WC (22.8%) and Florida (28.3%) populations. Asian representation is higher among RNs (6.1%) and APRNs (5.8%) than in the regional population (3.6%), approximating the national share (6.4%).
Race and Ethnicity of Nurses in the West Central Region, 2023–2024 Licensure Cycle
Education
In the West Central region, RNs are primarily BSN-prepared (49.1%), followed by those with an associate degree (31.2%) and a smaller share with graduate degrees. APRNs are predominantly master’s prepared, with 82% holding a master’s degree and approximately 16% holding a doctoral degree (DNP, PhD, or other doctoral degree).
Table 37
Highest Nursing Degree Earned by Nurses in the West Central Region, 2023–2024 Licensure Cycle
Southeast Region
During the 2023-2024 license renewal cycle, the Southeast (SE) region, including Indian River, Martin, Okeechobee, Palm Beach, and St. Lucie counties, was home to 32,905 active nursing licenses, which is a 21.4% drop in licensure since last reporting cycle
There were 21,512 respondents from the SE region (65.4%) who participated in the FCN Nursing Workforce Survey.
Table 38
Average Age and Active Licenses in the Southeast Region, 2023–2024 Licensure Cycle
Age
In the Southeast region, early-career nurses are underrepresented: 5.5% of LPNs, 7.1% of RNs, and 0.9% of APRNs are under age 30, below the U.S. nursing benchmark (10.9%) and at or below the Florida share (7.2%). The workforce is concentrated in mid-career ages, especially among APRNs, where 30–49 accounts for 54.4% (30–39: 24.4%; 40–49: 30%). Late-career representation is substantial, with LPNs 60+ at 32.3%, RNs 60+ at 28.7%, and APRNs 60+ at 21.1%, all exceeding or near national levels. Overall, the SE region reflects a predominantly mid- to late-career workforce with limited younger entrants.
Table 39
Ages of Nurses in the Southeast Region, 2023–2024 Licensure Cycle
Sex
In the Southeast region, the nursing workforce is predominantly female across all licensure types (91.3% of LPNs, 89.1% of RNs, and 88.6% of APRNs). Male representation remains low (8.7–11.4%). The highest male share is among APRNs (11.4%).
Table 40
Sex Ratios of Nurses in the Southeast Region, 2023–2024 Licensure Cycle
Race/Ethnicity
In the Southeast (SE) region, the nursing workforce is predominantly White, representing 34.6% of LPNs, 53% of RNs, and 56.6% of APRNs, which is generally consistent with the regional population (55.3%). Black nurses are substantially overrepresented among LPNs (44.2%) compared with the SE population (17.7%), while their representation among RNs (21%) and APRNs (16.7%) remains above regional and state levels. Hispanic nurses are underrepresented across all licensure types (10.4%–14.6%) relative to the SE population (23.4%) and the Florida population (28.3%). Asian nurses account for a small portion of the workforce (1.7%–5.4%) but exceed the local population share (2.8%), especially among RNs and APRNs. Overall, the region reflects considerable racial and ethnic diversity, with notable variation across nursing roles.
Table 41
Race and Ethnicity of Nurses in the Southeast Region, 2023–2024 Licensure Cycle
Education
In the Southeast region, RNs are primarily BSN-prepared (49.1%), followed by those with associate degrees (31.2%) and a smaller share with graduate degrees. Most APRNs (82%) hold a master’s degree and approximately 16% hold a doctoral degree (DNP, PhD, or other doctoral degree), reflecting the advanced education requirements for APRN practice.
Table 42
Highest Nursing Degree Earned by Nurses in the Southeast Region, 2023–2024 Licensure Cycle
Nursing Degree
Southwest Region
During the 2023-2024 license renewal cycle, the Southwest (SW) region, including Charlotte, Collier, Glades, Hendry, and Lee counties, was home to 25,414 active nursing licenses, which is a 27.7% increase from last reporting cycle.
There were 16,732 respondents from the SW region (65.8%) who participated in the FCN Nursing Workforce Survey.
Table 43
Average Age and Active Licenses in the Southwest Region, 2023–2024 Licensure Cycle
Age
In the Southwest region, early-career nurses represent a small portion of the workforce, with 7.5% of LPNs, 8.4% of RNs, and only 1.1% of APRNs under age 30, findings that fall below the national nursing benchmark (10.9%) and align closely with the statewide share (7.2%). The workforce is concentrated in mid-career ages, especially among APRNs, where 25.6% fall within the 40–49 age range and 28.1% within 50–59. Late-career nurses comprise a substantial segment across all licensure types, with 26.9%–30.6% aged 60 or older, exceeding both state and national proportions. This age profile suggests a mature workforce with limited representation from younger cohorts entering nursing practice.
Ages of Nurses in the Southwest Region, 2023–2024 Licensure Cycle
Sex
In the Southwest region, the nursing workforce is predominantly female across licensure types, 90.1% of LPNs, 88.4% of RNs, and 84.5% of APRNs. Male representation ranges from 9.8% to 15.5% (highest among APRNs).
Table 45
Sex Ratios of Nurses in the Southwest Region, 2023–2024 Licensure Cycle
Race/Ethnicity
In the Southwest (SW) region, the nursing workforce is majority White across licensure types (54.5% of LPNs, 66.7% of RNs, and 68% of APRNs), generally aligning with the regional population (64.6%) and exceeding the statewide share (52.1%). Black nurses are substantially overrepresented among LPNs (21%) relative to the SW population (7.6%), while their proportions among RNs (8.8%) and APRNs (6%) are closer to population levels. Hispanic nurses are underrepresented across all licensure types (15.4%–17.1%) compared with both the SW population (25.2%) and Florida overall (28.3%). Asian nurses comprise a small share (2%–3%) but exceed the local population benchmark (1.8%), particularly among RNs and APRNs. Overall, the region shows notable variation by licensure type, with higher Black representation among LPNs and lower Hispanic representation across the workforce.
Table 46
Race and Ethnicity of Nurses in the Southwest Region, 2023–2024 Licensure Cycle
Education
In the Southwest region, RNs are primarily BSN-prepared (49.1%), followed by associate degrees (31.2%) and a smaller proportion with graduate degrees (14.8% master’s; 2.1% doctoral). 82% of APRNs hold a master’s degree, and about 16% hold a doctoral degree (14.7% DNP; 1.3% PhD in Nursing; 0.5% other doctoral degree).
Table 47
Highest Nursing Degree Earned by Nurses in the Southwest Region, 2023–2024 Licensure Cycle
South Region
During the 2023-2024 license renewal cycle, the South (S) region, including Broward, Miami-Dade, and Monroe counties, was home to 88,504 active nursing licenses, which is an 11.9% increase in licensure since the last reporting cycle.
There were 55,831 respondents from the S region (63.1%) who participated in the FCN Nursing Workforce Survey.
Table 48
Average Age and Active Licenses in the South Region, 2023–2024 Licensure Cycle
Age
In the South region, early-career nurses are underrepresented: 6.5% of LPNs, 8.9% of RNs, and 1% of APRNs are under 30, near or below Florida overall (7.2%) and well below the U.S. benchmark (10.9%). APRNs are concentrated in mid-career ages, with 57.4% between 30–49 (30–39: 26.6%; 40–49: 30.8%). Late-career presence is highest among LPNs (31.3% aged 60+), exceeding both the Florida (24.1%) and U.S. (21.7%) nursing shares, while RN (19.7%) and APRN (14%) 60+ proportions are lower. Overall, the South reflects a predominantly mid- to late-career workforce with limited younger entrants, signaling potential succession challenges over the next decade.
Table 49
Ages of Nurses in the South Region, 2023–2024 Licensure Cycle
Sex
In the South region, the nursing workforce is predominantly female across all licensure types, with 87.6% of LPNs, 83% of RNs, and 78.6% of APRNs identifying as female. Male representation increases with licensure level, rising from 12.3% of LPNs to 21.4% of APRNs.
Table 50
Sex Ratios of Nurses in the South Region, 2023–2024 Licensure Cycle
Race/Ethnicity
In Florida’s South region, Hispanic nurses comprise the largest share among RNs (46.6%) and APRNs (58.2%), closely aligning with the regional population (54.4%), while LPNs are lower at 27.8%. Black nurses are markedly overrepresented among LPNs (50%) relative to the regional population (20.1%) and remain substantial among RNs (23.6%) and APRNs (16.7%). White nurses are underrepresented across all licensure types (10.5%–17.5%) compared with the South region (22.3%) and are well below the statewide (52.1%) and national (58.4%) nursing shares. Asian representation is modest (2.3%–6%), with RNs (6%) exceeding the regional population (2.7%) and approximating the national nursing benchmark (6.4%). Native and Other categories remain very small (≤3%), and Not Provided responses account for 3.1%–6.1% across licensure groups.
Table 51
Race and Ethnicity of Nurses in the South Region, 2023–2024 Licensure Cycle
benchmark (6.4%). Native and Other categories remain very small (≤3%), and Not Provided responses account for 3.1%–6.1% across licensure groups.
Table 51
Race and Ethnicity of Nurses in the South Region, 2023–2024 Licensure Cycle
Education
In Florida’s South region, RNs are primarily BSN-prepared (49.1%), followed by associate degrees (31.2%), with a smaller graduate-educated segment (14.8% master’s and ~2.1% doctoral). 82% of APRNs hold a master’s degree and 16.5% hold a doctoral degree (14.7% DNP, 1.3% PhD, 0.5% other doctoral), reflecting a graduate/doctoral-prepared APRN workforce aligned with advanced practice requirements.
Highest Nursing Degree Earned by Nurses in the South Region, 2023–2024 Licensure Cycle
Limitations
While the data presented in this report provide valuable insight into Florida’s nursing workforce, several limitations should be considered when interpreting the findings. First, the workforce survey is completed at the time of licensure renewal, and although participation rates are high, the survey is voluntary; therefore, some degree of non-response bias may be present. Nurses who choose not to complete the survey may differ in meaningful ways from those who do, potentially influencing estimates of employment patterns, geographic distribution, or educational attainment.
Second, all survey responses are self-reported and may be subject to recall error, misinterpretation of questions, or unintentional inaccuracies. While FCN employs datacleaning procedures to improve consistency, some error may remain. Additionally, data reflect workforce characteristics at a specific point in time and may not capture changes in employment status or work setting that occur between renewal cycles. Finally, although the Florida Center for Nursing follows consistent analytic procedures, some variables may shift slightly over time due to corrections in licensure records, updates in coding, or changes in survey structure. These factors can lead to minor yearto-year variations in reported totals or categories.
Despite these limitations, the data provide a robust and reliable foundation for understanding Florida’s nursing workforce and for supporting evidence-informed policy and planning in accordance with Section 464.0195, Florida Statutes