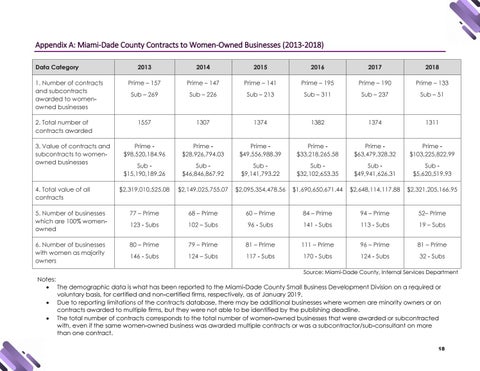
Appendix A: Miami-Dade County Contracts to Women-Owned Businesses (2013-2018) Data Category
2013
2014
2015
2016
2017
2018
Prime – 157
Prime – 147
Prime – 141
Prime – 195
Prime – 190
Prime – 133
Sub – 269
Sub – 226
Sub – 213
Sub – 311
Sub – 237
Sub – 51
1557
1307
1374
1382
1374
1311
Prime $98,520,184.96
Prime $28,926,794.03
Prime $49,556,988.39
Prime $33,218,265.58
Prime $63,479,328.32
Prime $103,225,822.99
Sub $15,190,189.26
Sub $46,846,867.92
Sub $9,141,793.22
Sub $32,102,653.35
Sub $49,941,626.31
Sub $5,620,519.93
$2,319,010,525.08
$2,149,025,755.07
$2,095,354,478.56
$1,690,650,671.44
$2,648,114,117.88
$2,321,205,166.95
5. Number of businesses which are 100% womenowned
77 – Prime
68 – Prime
60 – Prime
84 – Prime
94 – Prime
52– Prime
123 - Subs
102 – Subs
96 - Subs
141 - Subs
113 - Subs
19 – Subs
6. Number of businesses with women as majority owners
80 – Prime
79 – Prime
81 – Prime
111 – Prime
96 – Prime
81 – Prime
146 - Subs
124 – Subs
117 - Subs
170 - Subs
124 - Subs
32 - Subs
1. Number of contracts and subcontracts awarded to womenowned businesses 2. Total number of contracts awarded 3. Value of contracts and subcontracts to womenowned businesses
4. Total value of all contracts
Source: Miami-Dade County, Internal Services Department
Notes: The demographic data is what has been reported to the Miami-Dade County Small Business Development Division on a required or voluntary basis, for certified and non-certified firms, respectively, as of January 2019. Due to reporting limitations of the contracts database, there may be additional businesses where women are minority owners or on contracts awarded to multiple firms, but they were not able to be identified by the publishing deadline. The total number of contracts corresponds to the total number of women-owned businesses that were awarded or subcontracted with, even if the same women-owned business was awarded multiple contracts or was a subcontractor/sub-consultant on more than one contract. 18
