Global Leadership Forum Q2 2023

Page 1

Measuring the performance of the global infrastructure sector Global Leadership Forum Infrastructure Sentiment Survey Q2 2023

CHAPTER 1 Results summary

Welcome to this first edition of the Global Leadership Forums Infrastructure Sentiment Survey This survey and the subsequent report will be conducted on a quarterly basis to provide the infrastructure sector with metrics on how the market is currently performing and how individuals believe it will be performing in 12 months time.

This first survey acts as a snapshot but, as we progress through the first year, trend analysis and additional sector breakdowns will be included as sample size and data robustness improve.

In this first edition 92 individuals completed the survey across six global regions and multiple sectors. I would like to take this opportunity to thank those that completed the survey and present the key findings below

• Firms overall finances are stable with a positive outlook both currently and 12 months into the future.

• The engineering industry is currently felt to be on a stable but positive outlook and this improves in 12 months. The ability to maintain margins remains a problem currently and into the future.

• Currently, project activity is considered stable with a lean towards positive activity in the public/private sector in 12 months.

• There is significant positive demand for low carbon solutions but funding still remains an issue. It is expected conditions will improve over the next 12 months.

• Bidding time frames and contract conditions are currently and expected to remain a significant issue for projects.

Dr Nelson Ogunshakin OBE CEO, FIDIC

CHAPTER 1

Results summary

• Regionally, Africa had the least positive sentiment and North America the most.

• The energy sector displayed the strongest polarisation of sentiment towards renewables and away from carbon- based generation.

• The water sector had the most positive sentiment across the various sub-sectors.

• Residential, hospitals and data centres were felt to be the main sub-sectors driving the buildings sector.

• Sentiment in the resources sector is most positive in the mining area, which could be a reflection on the use and demand of rare earth minerals for use in batteries and renewables.

Dr Nelson Ogunshakin OBE CEO, FIDIC

Overall picture

Participants were asked to respond to the following in real terms (accounting for inflation) within the following bands. Below is the subsequent positive/negative balance across key areas affecting the infrastructure sector This balance is therefore not the number of responses.

Negative   (< -1% real growth rate)

Stable        (+/- 1% real growth rate)

Positive    (> 1% real growth rate)

Macroeconomic sentiment Current Sentiment Sentiment in 12 months Condition of your firms overall finances 15 - Stable to positive 11 - Stable to positive Condition of the engineering industry 3 - Stable to positive 10 - Stable to positive Ability to maintain current profit margins -2 - Stable to negative -2 - Stable to negative Project activity across client types Current Sentiment Sentiment in 12 months Government projects 5 - Stable to positive 3 - Positive Private sector projects -2 - Stable to Negative 5 - Stable to positive IFI / MDB projects -2 - Stable to negative -3 - Stable to negative Low carbon solutions Current Sentiment Sentiment in 12 months Demand for low carbon solution 19 - Positive 24 - Positive Funds to enable low carbon solution -9 - Negative -1 - Stable to negative Procurement Current Sentiment Sentiment in 12 months Bidding time frames -36 - Negative -33 - Negative Contract conditions -49 - Negative -42 - Negative

Africa

Participants were asked to respond to the following in real terms (accounting for inflation) within the following bands. Below is the subsequent positive/negative balance across key areas affecting the infrastructure sector This balance is therefore not the number of responses.

Negative   (< -1% real growth rate)

Stable        (+/- 1% real growth rate)

Positive    (> 1% real growth rate)

Macroeconomic sentiment Current Sentiment Sentiment in 12 months Condition of your firms overall finances -5 Stable to Negative -4 - Negative Condition of the engineering industry -6 - Negative -6 Stable to negative Ability to maintain current profit margins -5 - Stable to negative -5 Stable to negative Project activity across client types Current Sentiment Sentiment in 12 months Government projects -7 - Negative -8 - Negative Private sector projects -5 - Stable to negative -7 - Negative IFI / MDB projects -2 Stable to negative -3 - Negative Low carbon solutions Current Sentiment Sentiment in 12 months Demand for low carbon solution 1 - Positive 2 - Stable to positive Funds to enable low carbon solution -8 - Negative -5 - Negative Procurement Current Sentiment Sentiment in 12 months Bidding time frames -5 - Negative -6 - Negative Contract conditions -7 - Negative -7 - Negative

Asia Pacific

Participants were asked to respond to the following in real terms (accounting for inflation) within the following bands. Below is the subsequent positive/negative balance across key areas affecting the infrastructure sector This balance is therefore not the number of responses.

Negative   (< -1% real growth rate)

Stable        (+/- 1% real growth rate)

Positive    (> 1% real growth rate)

Macroeconomic sentiment Current Sentiment Sentiment in 12 months Condition of your firms overall finances 0 - Stable to positive -2 Stable to negative Condition of the engineering industry -4 - Stable to negative 1 - Stable to positive Ability to maintain current profit margins -3 - Stable to negative -1 - Negative Project activity across client types Current Sentiment Sentiment in 12 months Government projects 1 - Stable to positive 4 - Stable to positive Private sector projects -1 - Stable to negative 7 - Stable to positive IFI / MDB projects 4 - Stable to positive 4 - Positive Low carbon solutions Current Sentiment Sentiment in 12 months Demand for low carbon solution 9 - Positive 10 - Positive Funds to enable low carbon solution -3 - Negative 2 - Positive Procurement Current Sentiment Sentiment in 12 months Bidding time frames -11 - Negative -8 - Stable to Negative Contract conditions -15 - Negative -13 - Negative

Europe

Participants were asked to respond to the following in real terms (accounting for inflation) within the following bands. Below is the subsequent positive/negative balance across key areas affecting the infrastructure sector This balance is therefore not the number of responses.

Negative   (< -1% real growth rate)

Stable        (+/- 1% real growth rate)

Positive    (> 1% real growth rate)

Macroeconomic sentiment Current Sentiment Sentiment in 12 months Condition of your firms overall finances 9 - Stable to positive 8 - Stable to positive Condition of the engineering industry 4 - Stable to positive 5 - Stable to positive Ability to maintain current profit margins 0 - Stable 1 -Stable to positive Project activity across client types Current Sentiment Sentiment in 12 months Government projects 5 - Stable to positive 2 - Stable to positive Private sector projects 3 - Stable to positive 3 - stable to positive IFI / MDB projects -4 - Stable to negative -4 - Stable to negative Low carbon solutions Current Sentiment Sentiment in 12 months Demand for low carbon solution 6 - Positive 6 - Positive Funds to enable low carbon solution -4 - Negative -2 - Stable to negative Procurement Current Sentiment Sentiment in 12 months Bidding time frames -12 - Negative -9 - Stable to negative Contract conditions -14 - Negative -11 - Stable to negative

Middle East

Participants were asked to respond to the following in real terms (accounting for inflation) within the following bands. Below is the subsequent positive/negative balance across key areas affecting the infrastructure sector This balance is therefore not the number of responses.

Negative   (< -1% real growth rate)

Stable        (+/- 1% real growth rate)

Positive    (> 1% real growth rate)

Macroeconomic sentiment Current Sentiment Sentiment in 12 months Condition of your firms overall finances 2 - Stable to positive 1 - Stable Condition of the engineering industry 2 - Positive 2 - Stable to positive Ability to maintain current profit margins 0 - Stable 0 - Stable Project activity across client types Current Sentiment Sentiment in 12 months Government projects 0 - Stable 0 - Stable Private sector projects -3 - Negative -2 - Negative IFI / MDB projects -5 - Negative -4 - Negative Low carbon solutions Current Sentiment Sentiment in 12 months Demand for low carbon solution -1 - Stable to negative 1 - Stable to positive Funds to enable low carbon solution 2 - Positive 0 - Stable Procurement Current Sentiment Sentiment in 12 months Bidding time frames -3 - Stable to negative -2 - Stable to negative Contract conditions -3 - Stable to negative -2 - Stable to negative

North America

Participants were asked to respond to the following in real terms (accounting for inflation) within the following bands. Below is the subsequent positive/negative balance across key areas affecting the infrastructure sector This balance is therefore not the number of responses.

Negative   (< -1% real growth rate)

Stable        (+/- 1% real growth rate)

Positive    (> 1% real growth rate)

Macroeconomic sentiment Current Sentiment Sentiment in 12 months Condition of your firms overall finances 9 - Positive 8 - Positive Condition of the engineering industry 8 - Positive 7 - Stable to positive Ability to maintain current profit margins 7 - Positive 4 - Positive Project activity across client types Current Sentiment Sentiment in 12 months Government projects 8 - Positive 6 - Stable to positive Private sector projects 3 - Positive 3 - Positive IFI / MDB projects 4 - Stable to positive 3 -Stable to positive Low carbon solutions Current Sentiment Sentiment in 12 months Demand for low carbon solution 3 - Positive 3 - Stable to Positive Funds to enable low carbon solution 3 - Positive 2 - Stable to positive Procurement Current Sentiment Sentiment in 12 months Bidding time frames -4 - Negative -6 - Negative Contract conditions -8 - Negative -7 - Negative

South/Central America

Participants were asked to respond to the following in real terms (accounting for inflation) within the following bands. Below is the subsequent positive/negative balance across key areas affecting the infrastructure sector This balance is therefore not the number of responses.

Negative   (< -1% real growth rate)

Stable        (+/- 1% real growth rate)

Positive    (> 1% real growth rate)

Macroeconomic sentiment Current Sentiment Sentiment in 12 months Condition of your firms overall finances 0 - Stable 0 - Stable 0Condition of the engineering industry -1 - Negative 0 - Stable Ability to maintain current profit margins -1 - Stable to negative -1 - Stable to negative Project activity across client types Current Sentiment Sentiment in 12 months Government projects -2 - Negative -1 - Stable to negative Private sector projects 1 - Stable to positive 1 - Stable to positive IFI / MDB projects 1 - Stable to positive 1 - Stable to positive Low carbon solutions Current Sentiment Sentiment in 12 months Demand for low carbon solution 1 - Stable to positive 2 - Positive Funds to enable low carbon solution 1 - Stable to positive 2 - Positive Procurement Current Sentiment Sentiment in 12 months Bidding time frames -1 - Stable to negative -2 - Negative Contract conditions -2 - Negative -2 - Negative

Sector balances

Participants were asked to respond to the following in real terms (accounting for inflation) within the following bands. Below is the subsequent positive/negative balance across key areas affecting the infrastructure sector This balance is therefore not the number of responses.

Negative   (< -1% real growth rate)

Stable        (+/- 1% real growth rate)

Positive    (> 1% real growth rate)

Transport Waste (solid)
Stable to negative Stable to positive Stable to positive Stable to positive Stable to positive Stable to positive Negative Positive
Water and Sewerage Energy

Sector balances

Participants were asked to respond to the following in real terms (accounting for inflation) within the following bands. Below is the subsequent positive/negative balance across key areas affecting the infrastructure sector This balance is therefore not the number of responses.

Negative   (< -1% real growth rate)

Stable        (+/- 1% real growth rate)

Positive    (> 1% real growth rate)

Telecommunications Resources
to positive
to negative
to negative
Buildings Stable Stable
Stable
Stable
Stable to negative Stable to negative

CHAPTER 2 Transport

Current sentiment in the global transport sector across all sub sectors was on balance contracting by just over 1% in real terms. Looking forward 12 months the outlook became e positiv with the o all balance f oring gr wth of

i. Highways, streets and bridges

ii. Rail and transit

Transport
sentiment Sentiment in 12 months Overall Balance 11 Stable to positive Overall Balance 13 Stable to positive
Current
Sentiment in 12 months Overall Balance 9 Positive Overall Balance 7 Stable to positive
Current sentiment

Transport

iii. Airports

Current

iv. Ports and harbours

Current sentiment

sentiment
in 12 months Overall Balance -10 Stable to negative Overall Balance -2 Stable to negative
Sentiment
Overall Balance -13 Stable to negative Overall Balance -6
Sentiment in 12 months
Stable to negative

CHAPTER 3 Waste (solid)

Current sentiment in the waste sector was felt to be stable with a minor possibility of improvement in the next 12 months.

We should, however, caution that in this quarter of the survey the waste sector has a small sample.

Waste (solid)

i. Solid waste management

ii. Hazardous waste management

Current sentiment Sentiment in 12 months Overall Balance 1 Stable to positive Overall Balance 1 Stable to positive
Current sentiment Sentiment in 12 months Overall Balance 0 Stable Overall Balance 2 Stable to positive

CHAPTER 4 Water and sewerage

Current sentiment in the water and sewerage market was the strongest positive balance of all sectors analysed in this survey. Impressively, in 12 months time the sentiment is expected to be even stronger

All of the sub-sectors (water, sewerage/wastewater, storm water drainage and flood protection) had strong positive balances for growth and these balances all improve when considering sentiment in 12 months time.

Water and sewerage

i. Water

ii. Sewerage/waste water

Current sentiment Sentiment in 12 months Overall Balance 14 Positive Overall Balance 18 Positive
Current sentiment Sentiment in 12 months Overall Balance 12 Stable to positive Overall Balance 17 Stable to positive

Water and sewerage

iii. Storm water drainage

iv. Flood protection

sentiment Sentiment in 12 months Overall Balance 7 Stable to positive Overall Balance 18 Positive
Current
sentiment Sentiment in 12 months Overall Balance 12 Positive Overall Balance 19 Positive
Current

CHAPTER 5 Energy

The overall balance of opinion for the energy sector was slightly one of negative growth but this was predicted to shift to a more stable/positive position in 12 months time.

It should, however, be pointed out that the majority of positive growth is being driven by the renewable (wind, solar and hydro) sector.

i. Carbon-based power generation

ii. Nuclear power generation

Energy
Sentiment in 12 months Overall Balance -8 Negative Overall Balance -7 Negative
Current sentiment
in 12 months Overall Balance -14 Negative Overall Balance -9 Negative
Current sentiment Sentiment
Energy
Current sentiment Sentiment in 12 months Overall Balance 21 Positive Overall Balance 26 Positive
iii. Renewable - Wind, Solar, Hydro

CHAPTER 6 Telecommunications

Current sentiment in the telecommunications sector was felt to be stable with a minor possibility of improvement in the next 12 months.

We should, however, caution that in this quarter of the survey the telecommunications sector has a small sample.

i. Wired broadband

ii. Mobile and satellite

Telecommunications
Current sentiment Sentiment in 12 months Overall Balance 0 Stable Overall Balance 1 Stable to positive

CHAPTER 7

Resources and minerals

Current sentiment in the resource and materials sector was felt to be stable to negative with a minor possibility of improvement in the next 12 months.

We should, however, caution that in this quarter of the survey the resource and minerals sector has a small sample.

Resources and minerals

i. Mining

ii. Forestry

Current sentiment Sentiment in 12 months Overall Balance 1 Stable to positive Overall Balance 2 Stable to positive
Current sentiment Sentiment in 12 months Overall Balance -2 Stable to negative Overall Balance 0 Stable

Resources and minerals

iii. Oil and gas (including pipelines)

Current sentiment Sentiment in 12 months Overall Balance -3 Stable to negative Overall Balance -3 Stable to negative

CHAPTER 8 Buildings

Current sentiment in the buildings sector had a negative overall balance, but with improvement in the next 12 months.

Of the sub-sectors the only areas where there was either zero or a positive overall balance was that of residential, hospitals and data centres.

Buildings

i. State and local government

ii. Convention, sports and cultural

Current sentiment

Sentiment in 12 months

in 12 months Overall Balance -2 Stable to negative Overall Balance -1 Negative
Current sentiment Sentiment
Overall Balance -10 Stable to negative Overall Balance -15 Negative

Buildings

iii. Industrial and manufacturing

iv. Residential

Current sentiment Sentiment in 12 months Overall Balance -5 Negative Overall Balance -2 Stable to negative
Current sentiment Sentiment in 12 months Overall Balance 0 Stable Overall Balance 3 Stable to positive

Buildings

v. Schools (pre-18)

vi. Universities

Current sentiment

Sentiment in 12 months

in 12 months Overall Balance -5 Stable to
Overall Balance -8 Stable
Current sentiment Sentiment
negative
to negative
Overall Balance
Overall Balance
-8 Stable to negative
-9 Stable to negative

Buildings

vii. Hospitals

viii. R&D facilities

Sentiment in 12 months Overall Balance 11 Positive Overall Balance 14 Positive
Current sentiment
Overall Balance -12 Stable to
Overall Balance -9 Stable to negative
Current sentiment Sentiment in 12 months
negative

Buildings

ix. Data Centres

Current sentiment Sentiment in 12 months Overall Balance 4 Stable to positive Overall Balance 4 Stable to positive

CHAPTER 9 Methodology

The results in this document are the result of a survey distributed to FIDICs database of contacts and the members of its Global Leadership Forum.

The results are calculated based on the experiences of individuals primarily located within engineering firms and so represents views on the ground of how activity and performance is occurring.

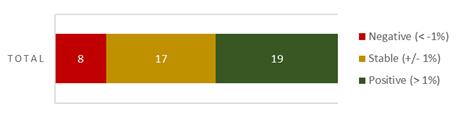
Participants were asked to respond to the areas in this report in real terms (accounting for inflation). Below is the subsequent positive/negative balance across all responses in key areas affecting the infrastructure sector

Negative   (< -1% real growth rate)

Stable        (+/- 1% real growth rate)

Positive    (> 1% real growth rate)

Using the above, a balance of overall sentiment can be calculated to be stable, stable with positive or negative direction, positive or negative.

CHAPTER 10 Response profile

GLF Membership Total responses No 66 Yes 26 Grand Total 92 Regional breakdown Total responses Africa 13 Asia Pacific 32 Europe 22 Middle East 9 North America (Mexico, Caribbean, USA and Canada) 13 South and Central America 3 Grand Total 92

Disclaimer

This document was produced by FIDIC and is provided for informative purposes only. The contents of this document are general in nature and therefore should not be applied to the specific circumstances of individuals. Whilst we undertake every effort to ensure that the information within this document is complete and up to date, it should not be relied upon as the basis for investment, commercial, professional or legal decisions.

FIDIC accepts no liability in respect to any direct, implied, statutory, and/or consequential loss arising from the use of this document or its contents. No part of this report may be copied either in whole or in part without the express permission in writing.

Copyright FIDIC © 2023

Published by International Federation of Consulting Engineers (FIDIC)

World Trade Center II

P.O. Box 311 1215 Geneva 15, Switzerland

Phone +41 22 568 0500

E-mail fidic@fidic.org

Web: www.fidic.org

Issuu converts static files into: digital portfolios, online yearbooks, online catalogs, digital photo albums and more. Sign up and create your flipbook.