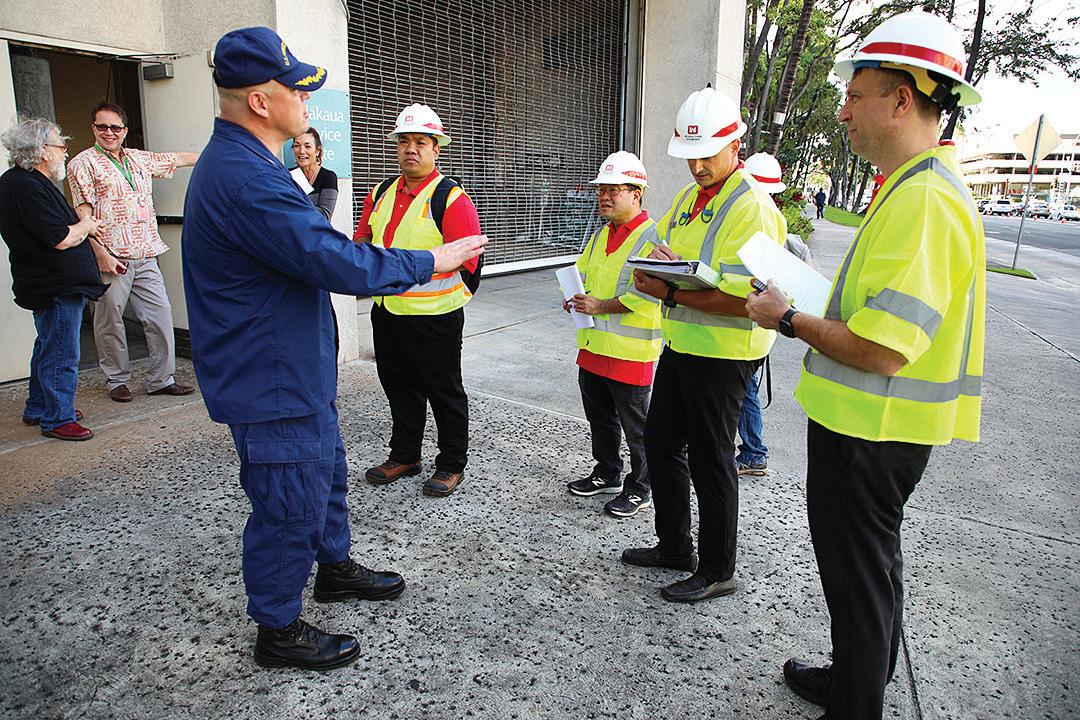
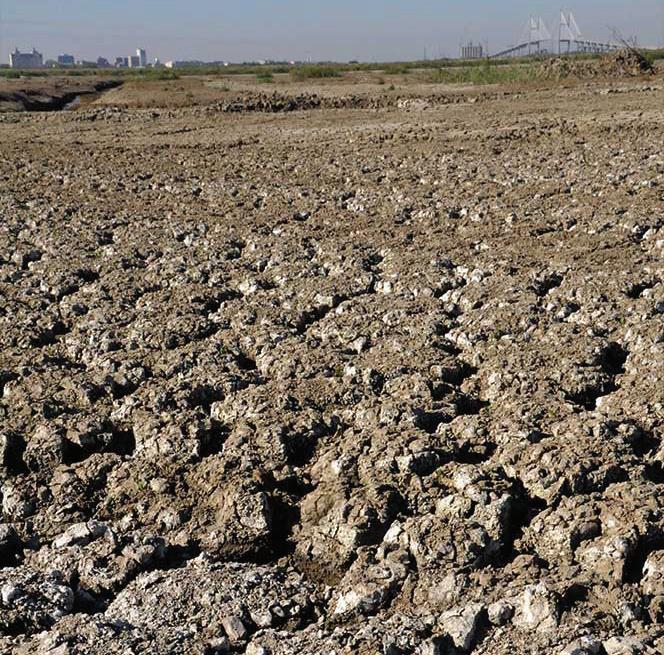
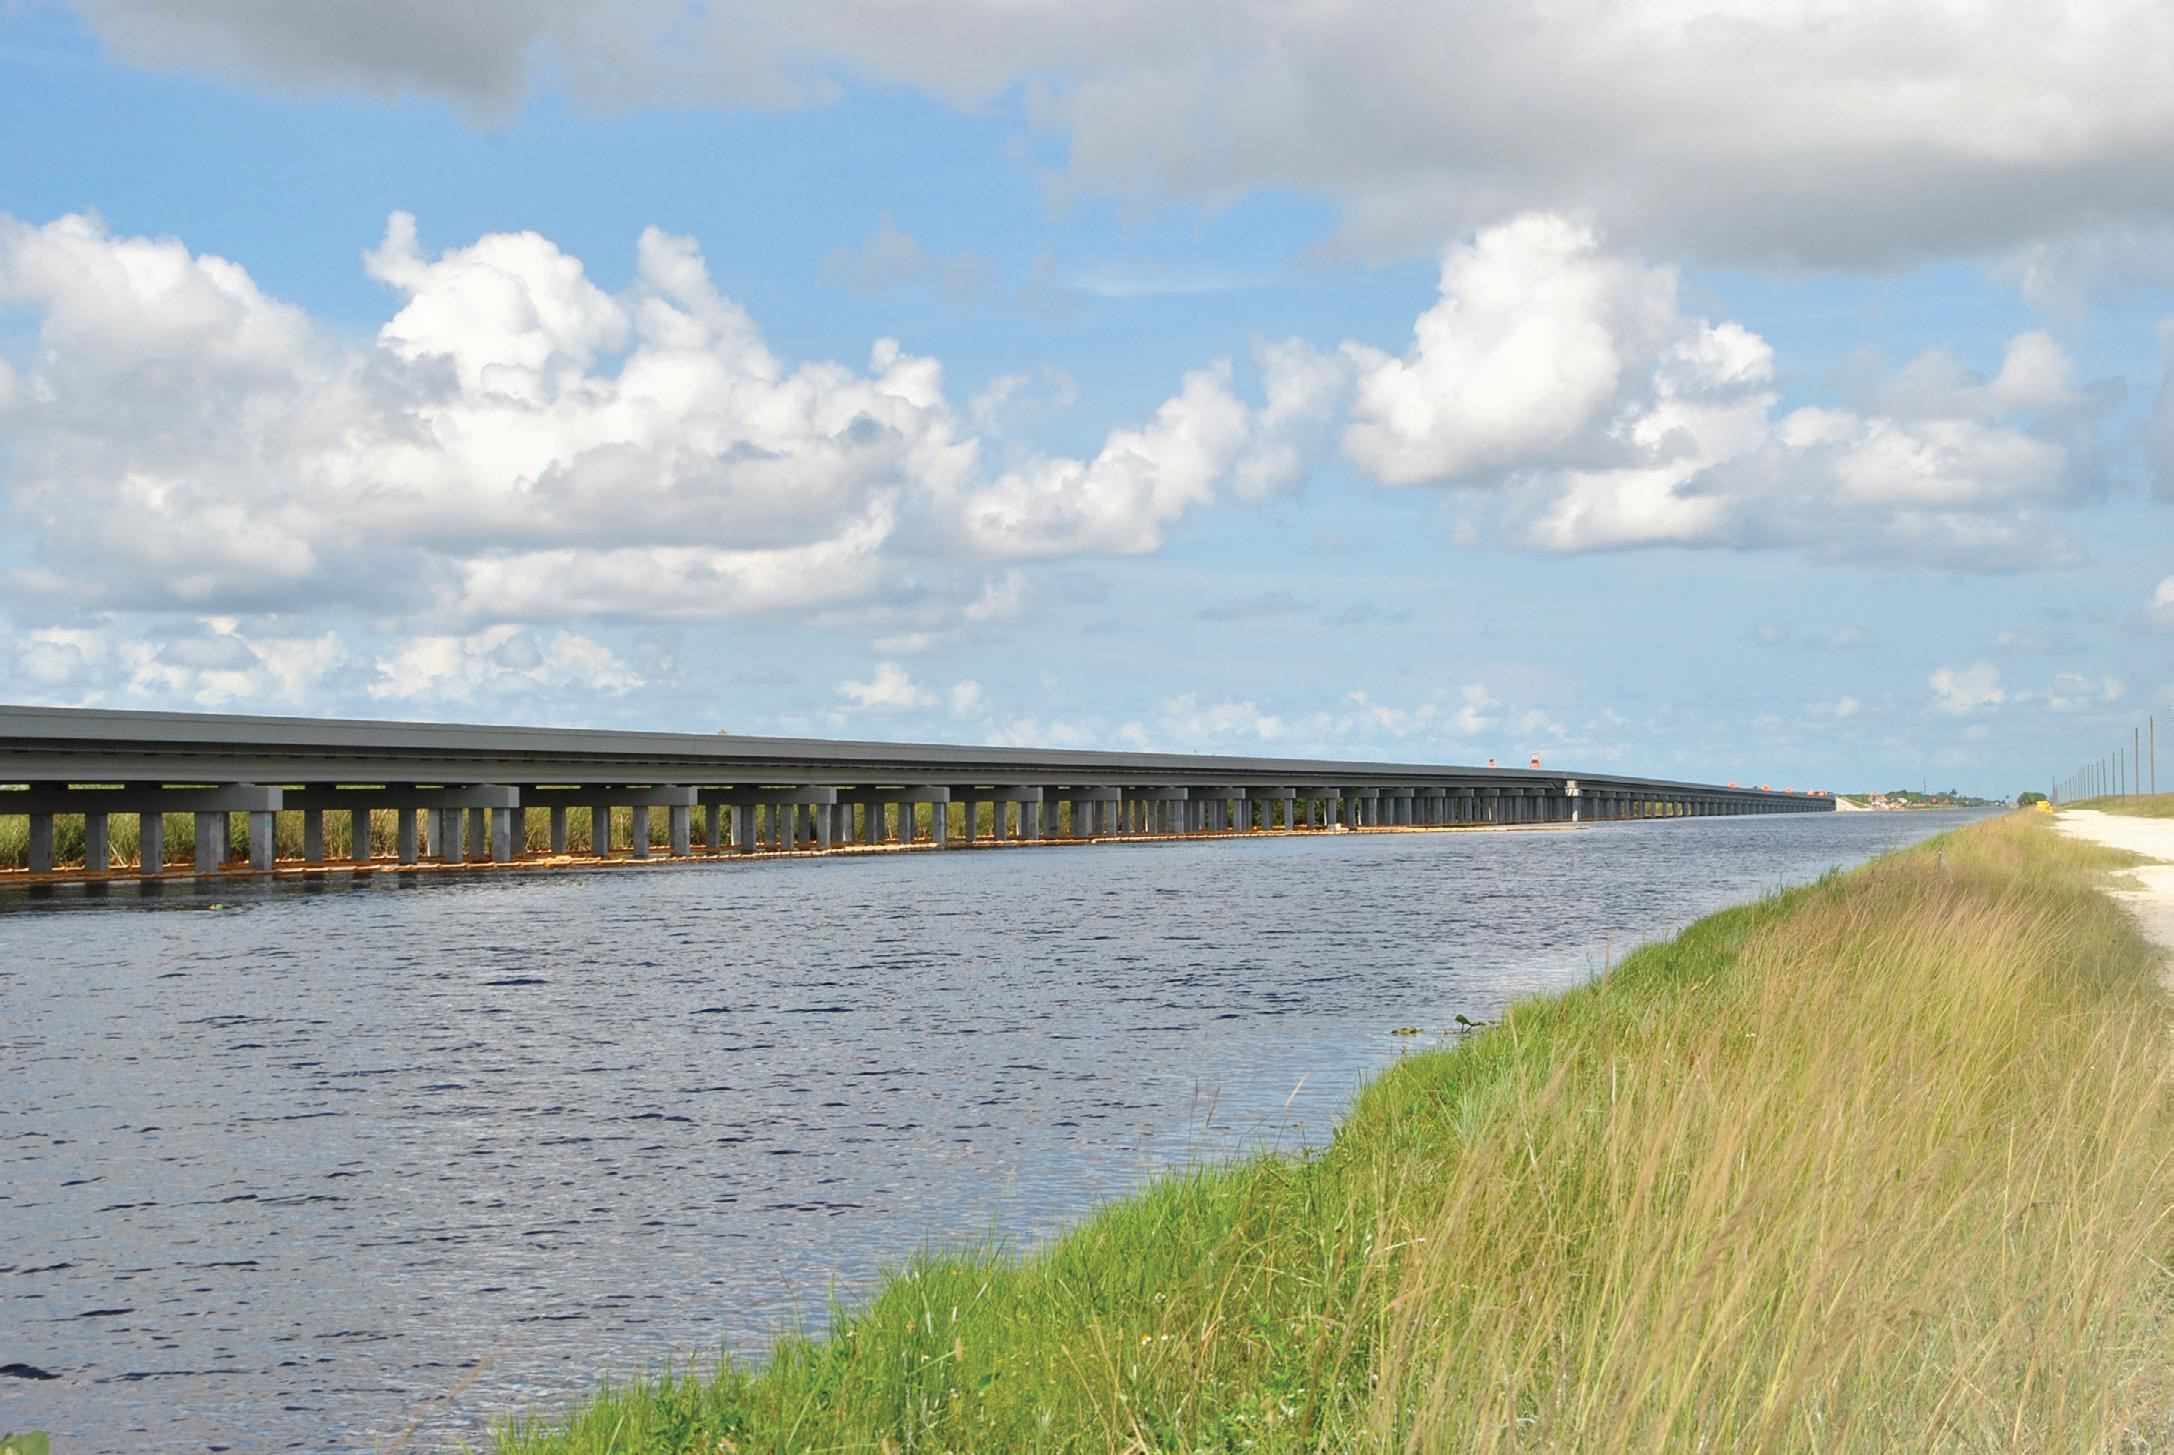
COURTESY GALVESTON DISTRICT
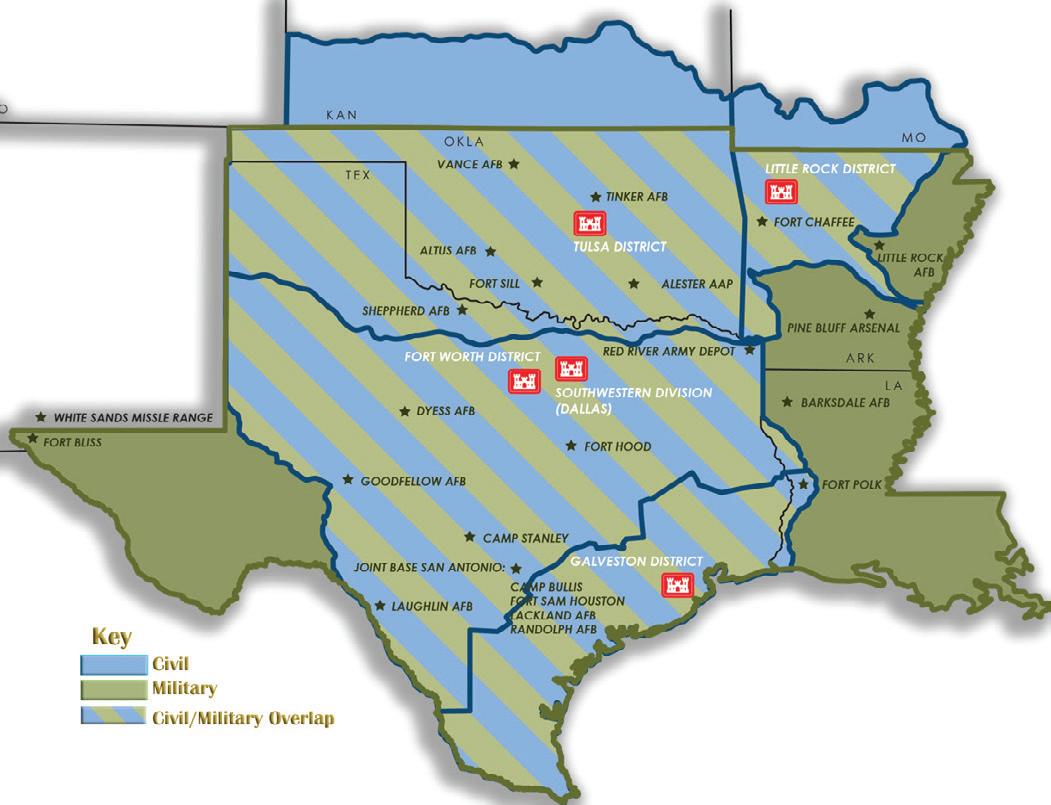
SOUTHWESTERN DIVISION
The modeling map was prepared and maintained by the Geospatial Branch, Galveston District, U.S. Army Corps of Engineers.
Virginia, asking him to join the USACE COVID-19 Modeling Task Force. Vera agreed and selected Jason Jordan, a geographer with the Geospatial Branch, to join him in providing support. “The [Army] Geospatial Center told us that their biggest problem was that they had large amounts of data that they didn’t know what to do with,” said Vera. “USACE Commanding General Lt. Gen. Todd Semonite was looking for a way to visualize COVID-19 infection rates by creating this task force to analyze data from multiple sources and to combine multiple model outputs to better understand the infection trends. Our modeling predicted how COVID-19 could spread over time based on many factors to include social distancing rates.” Prior to assembly of the Modeling Task Force, Columbia University was the only organization attempting to develop models for the spread of COVID-19, but many organizations quickly developed models to analyze different aspects of the pandemic as it spread. USACE leadership wanted a better method of combining information from the various models to aid planning, particularly to support decision-making for development of alternate care facilities (ACFs) – USACE’s primary mission against the COVID-19 threat. USACE field operatives added information to the mix based
on their data collection at each potential ACF site and their own field of expertise. The Modeling Task Force consists of four geospatial engineers who combine data from various models to create hosted dashboards and analyses on USACE’s enterprise geographic information system (GIS) application. The task force gathered model outputs into an ensemble dashboard that allows users to view and analyze the information for their specific needs. These insights are now available to all of USACE, federal partners, and the public. “The models display active COVID-19 cases in the U.S. along with total deaths and other information. Things like a heat map that shows the predicted spread of COVID-19 help agencies predict the number of ventilators and intensive care unit beds that might be needed,” said Vera. “We also track the rate-of-spread, growth-rate, slope, days-of-improvement, and regression trends. The dashboard allows users to filter by state, division, district, metro area, office commuting area, and county, so decision-makers can zoom in on their area of interest.” The modeling has not only been used USACE-wide, but it has also been used by the CDC, the Federal Emergency Management Agency, and is available to the public. USACE is now looking at how such GIS techniques can be used to support other missions such as emergency response to natural disasters. It is hoped that data available from each of USACE’s 52 districts can be combined into a USACE Common Operating Picture that allows for efficient allocation of resources during future emergencies. n 67