6 minute read
Carolin Truckenbrod – First reference curve for refraction in Central Europe created


Advertisement
Reference percentile curves are commonly used in pediatric practice in order to estimate body height and weight development. They are used as a screening tool to assess the development and well-being of children and percentiles are also useful to monitor the development of ametropia in children. Recently, Carolin Truckenbrod and a team of researchers created the first reference curve for refraction in Central Europe and they investigated the extent to which differences exist in refractive development in children in Germany and Central Asia. The researchers published their findings in March 2020. GlobalCONTACT has summarized the key findings and has spoken with researcher Carolin Truckenbrod about the study background. By Hanna Diewald & Rebekka Nurkanovic
GlobalCONTACT: Your analysis is part of the Life Child-study. What was the background to the study? Truckenbrod: LIFE Child is a cohort sequential design study that was established in 2011 as part of the Leipzig Research Centre for Civilization Diseases (LIFE). The measurements are carried out by the LIFE Child ambulance. The study by Prof. Dr. Wieland Kiess and Prof. Dr. Antje Körner has set the goal of examining healthy child development from pregnancy to early adulthood. The questions to answer are which factors influence child development positively or negatively. In this context, a large amount of data is collected, which can be analyzed by scientists worldwide via a project agreement.
GlobalCONTACT: How can interested parties benefit from these data sets? Truckenbrod: Anyone interested in evaluating data from the LIFE Child Study can contact the study clinic team via the following website: home.unileipzig.de/lifechild/project-request/ GlobalCONTACT: What were the challenges in data collection and how did you solve them? Truckenbrod: With small children it is always a challenge to encourage them to participate. It is important to find an approach to the children and to make sure that they are not afraid of the technical devices and then sit still for a short time. However, I was only partly involved in the data collection provided by LIFE Child.
GlobalCONTACT: Were there any limitations to the comparability of the data? Truckenbrod: Unfortunately, the refraction data were collected without cycloplegia. Since this is not a pure eye study, but the development of the child in general is the focus at LIFE Child, cycloplegia would influence the subsequent tests too much. In order to achieve better comparability with other studies, we tried to approximate data collected with cycloplegia with the help of a formula.
GlobalCONTACT: What is your involvement in the study? Truckenbrod: As a doctoral candidate at the University of Leipzig, I may analyze data from the Life Child cohort via a project agreement. I also participated in the collection of the data for a while. GlobalCONTACT: Why are centile charts for refractive development important? What is the benefit for pediatricians? Truckenbrod: Pediatricians already use percentile curves for weight and height to assess the child's development. They allow a simple risk factor analysis for the occurrence of certain developmental abnormalities. More and more pediatricians are also performing automated refraction measurements on children. The percentile curves of the refraction allow pediatricians to assess the measurement results more quickly.
Carolin Truckenbrod GlobalCONTACT: What is the main conclusion from your findings? Truckenbrod: At the age of five, the refraction percentiles between Asian countries and our data are still very similar. Thereafter, the refraction developed significantly differently, with the upper percentiles developing in parallel with the hyperopic children. In the lower percentiles we can generally see an increase in myopia, but this is much more pronounced in the Asian countries. GlobalCONTACT: What questions should be explored next? Truckenbrod: Our next project is the observation of axial length growth in children. GlobalCONTACT: Thank you for the interview. The study is presented on the following page. >>
STUDY DESIGN
The researchers measured non-cycloplegic refraction in 1999 children, of which 1046 were male and 953 female, aged 3 to 18 years. The autorefraction without cycloplegia was carried out with the wavefront aberrometer Zeiss i. Profiler plus, which is based on a Hartmann-Shack sensor. The refractive error was analyzed at a 3 mm pupil and a vertex distance of 12 mm. Three measurements of each eye were carried out for each patient. After autorefraction the uncorrected visual acuity (UCVA) and the best corrected visual acuity (BCVA) were obtained using the Zeiss i.Polatest1 with the spherocylindrical combination measured with the Zeiss i.Profiler plus. For children from 3 to 6 years and older children who were not able to read, Colt Symbols were used, for the older children letters. According to the WHO guidelines for attained growth curves, the refraction is presented as a continuous function of age. This results in smoother curves than using age intervals and provides better comparableness. The GAMLSS model allows for creating such reference curves from continuous variables. For statistical analysis, the software R[1], by the R foundation, with the additional package “gamlss” was used.
RESULTS AND CONCLUSION
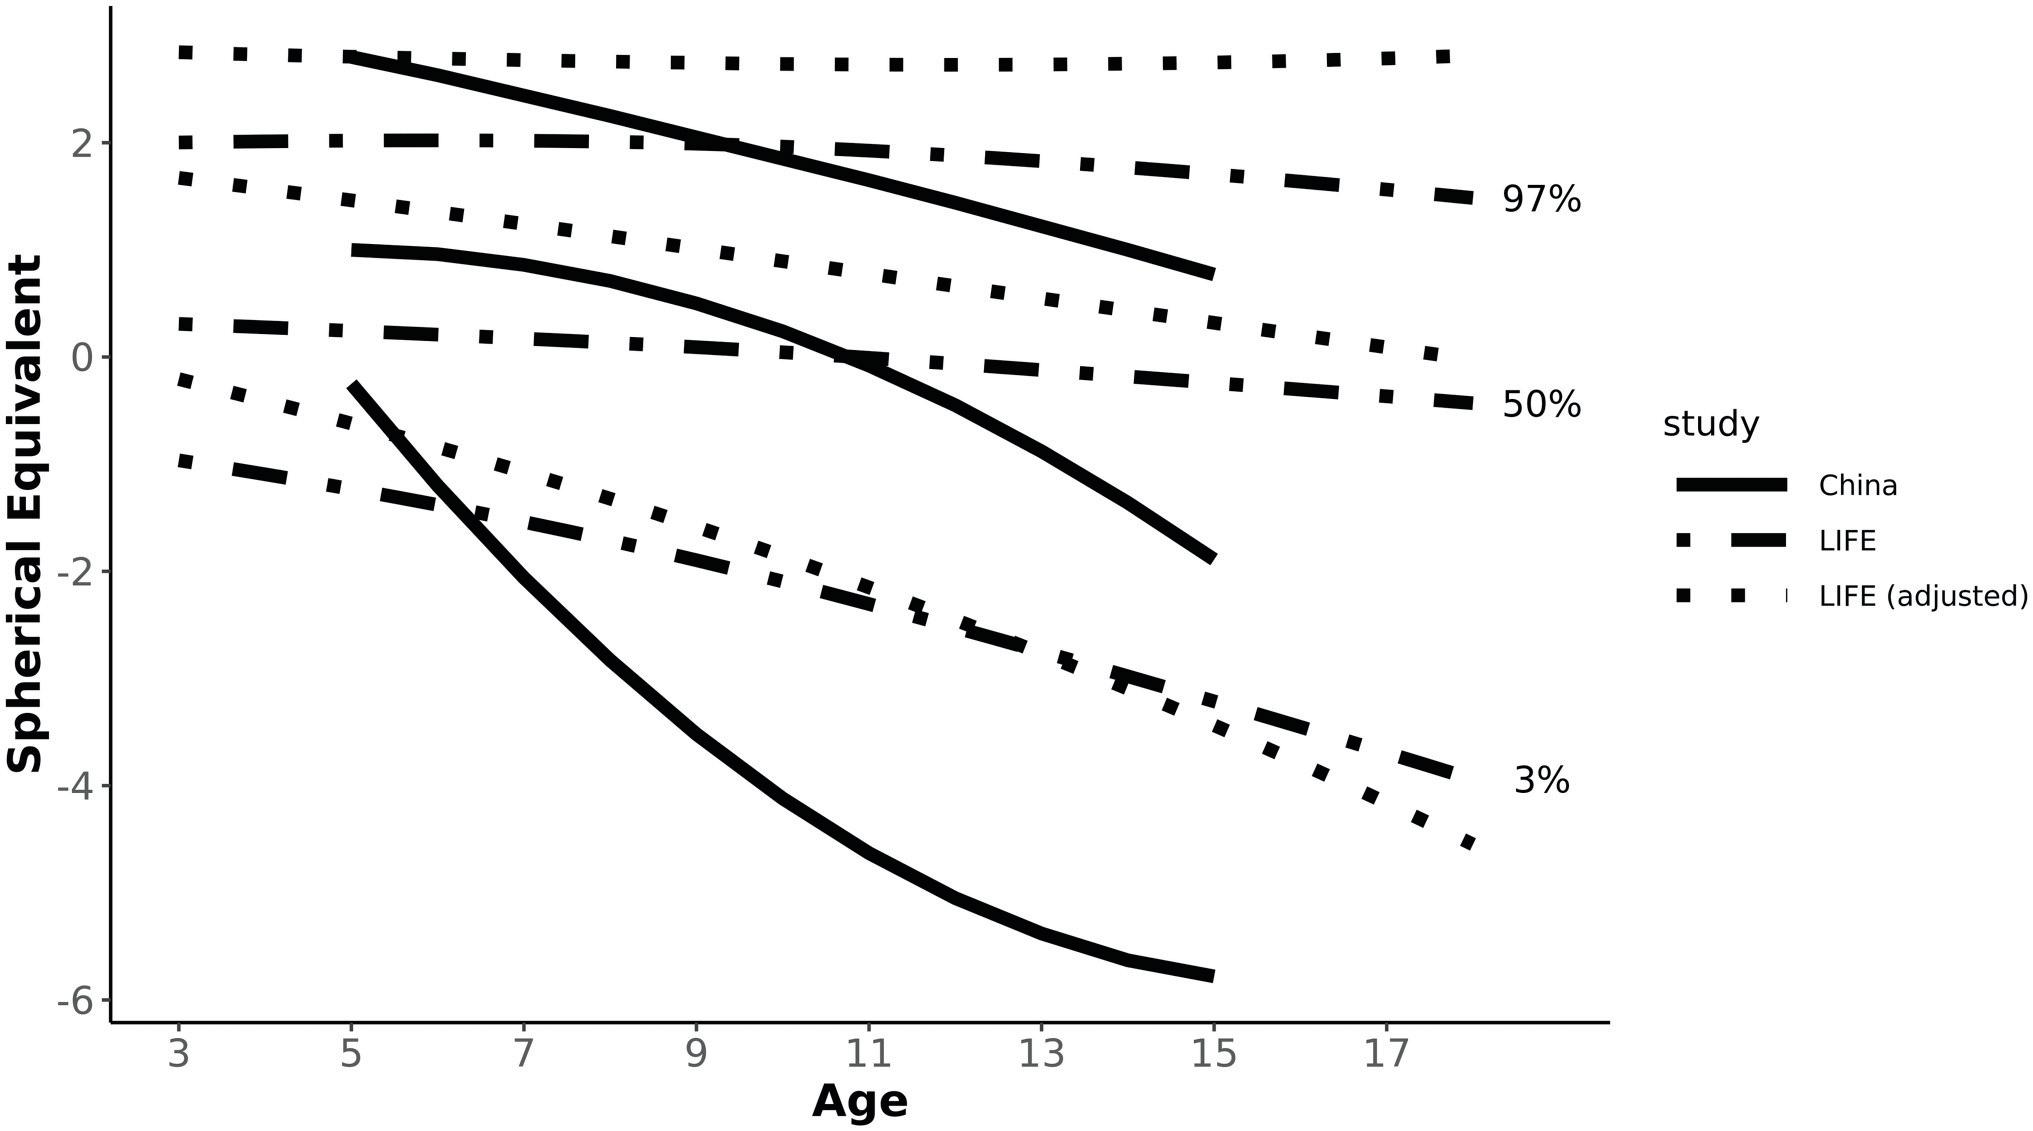
The results showed that there were only little differences for all centiles between the genders at 3 years and a general trend towards more myopia with increasing age. For the 97th centile and the 3rd centile, girls showed higher myopia/ less hyperopia than boys. Between the age of 3 and 18, the median refraction became -0.68D and -0.74D more myopic for boys and girls, respectively. At the same time, the 97th centile for boys changed +0.29D towards hyperopia and in girls -0.52D towards myopia. A general myopic trend was seen in the 3rd centile, which was -2.46D for boys and -2.98D for girls. For both genders, the median became less than zero at the age of 10 years but did not become myopic (less than -0.5D) up to the age of 18. The analysis presents the first reference curve for refraction in Central Europe. In comparison to data from China and Korea, there is only little difference at the age of 5 years in all centiles which then increases continuously. For all ethnicities, a trend towards myopia with increasing age could be observed, but myopia progression is much higher in China and Korea than in Germany. The most marked differences can be seen in the lower centiles.
The complete study was first published on: journals.plos.org/plosone/ article?id=10.1371/journal.pone.0230291
References:
• Chen Y, Zhang J, Morgan IG, He M (2016) Identifying Children at Risk of High Myopia Using Population Centile Curves of
Refraction. PloS one 11 (12): e0167642. https://doi.org/10.1371/ journal.pone.0167642 • Sankaridurg P, He X, Naduvilath T, Lv M, Ho A et al. (2017)
Comparison of noncycloplegic and cycloplegic autorefraction in categorizing refractive error data in children. Acta ophthalmologica 95 (7): e633– e640. https://doi.org/10.1111/aos.13569 • Truckenbrod C, Meigen C, Brandt M, Vogel M, Wahl S, Jurkutat
A, et al. (2020) Reference curves for refraction in a German cohort of healthy children and adolescents. PLoS ONE 15 (3): e0230291. https://doi.org/10.1371/journal.pone.0230291
Footnote:
[1] For further information please visit: www.r-project.org/about.html
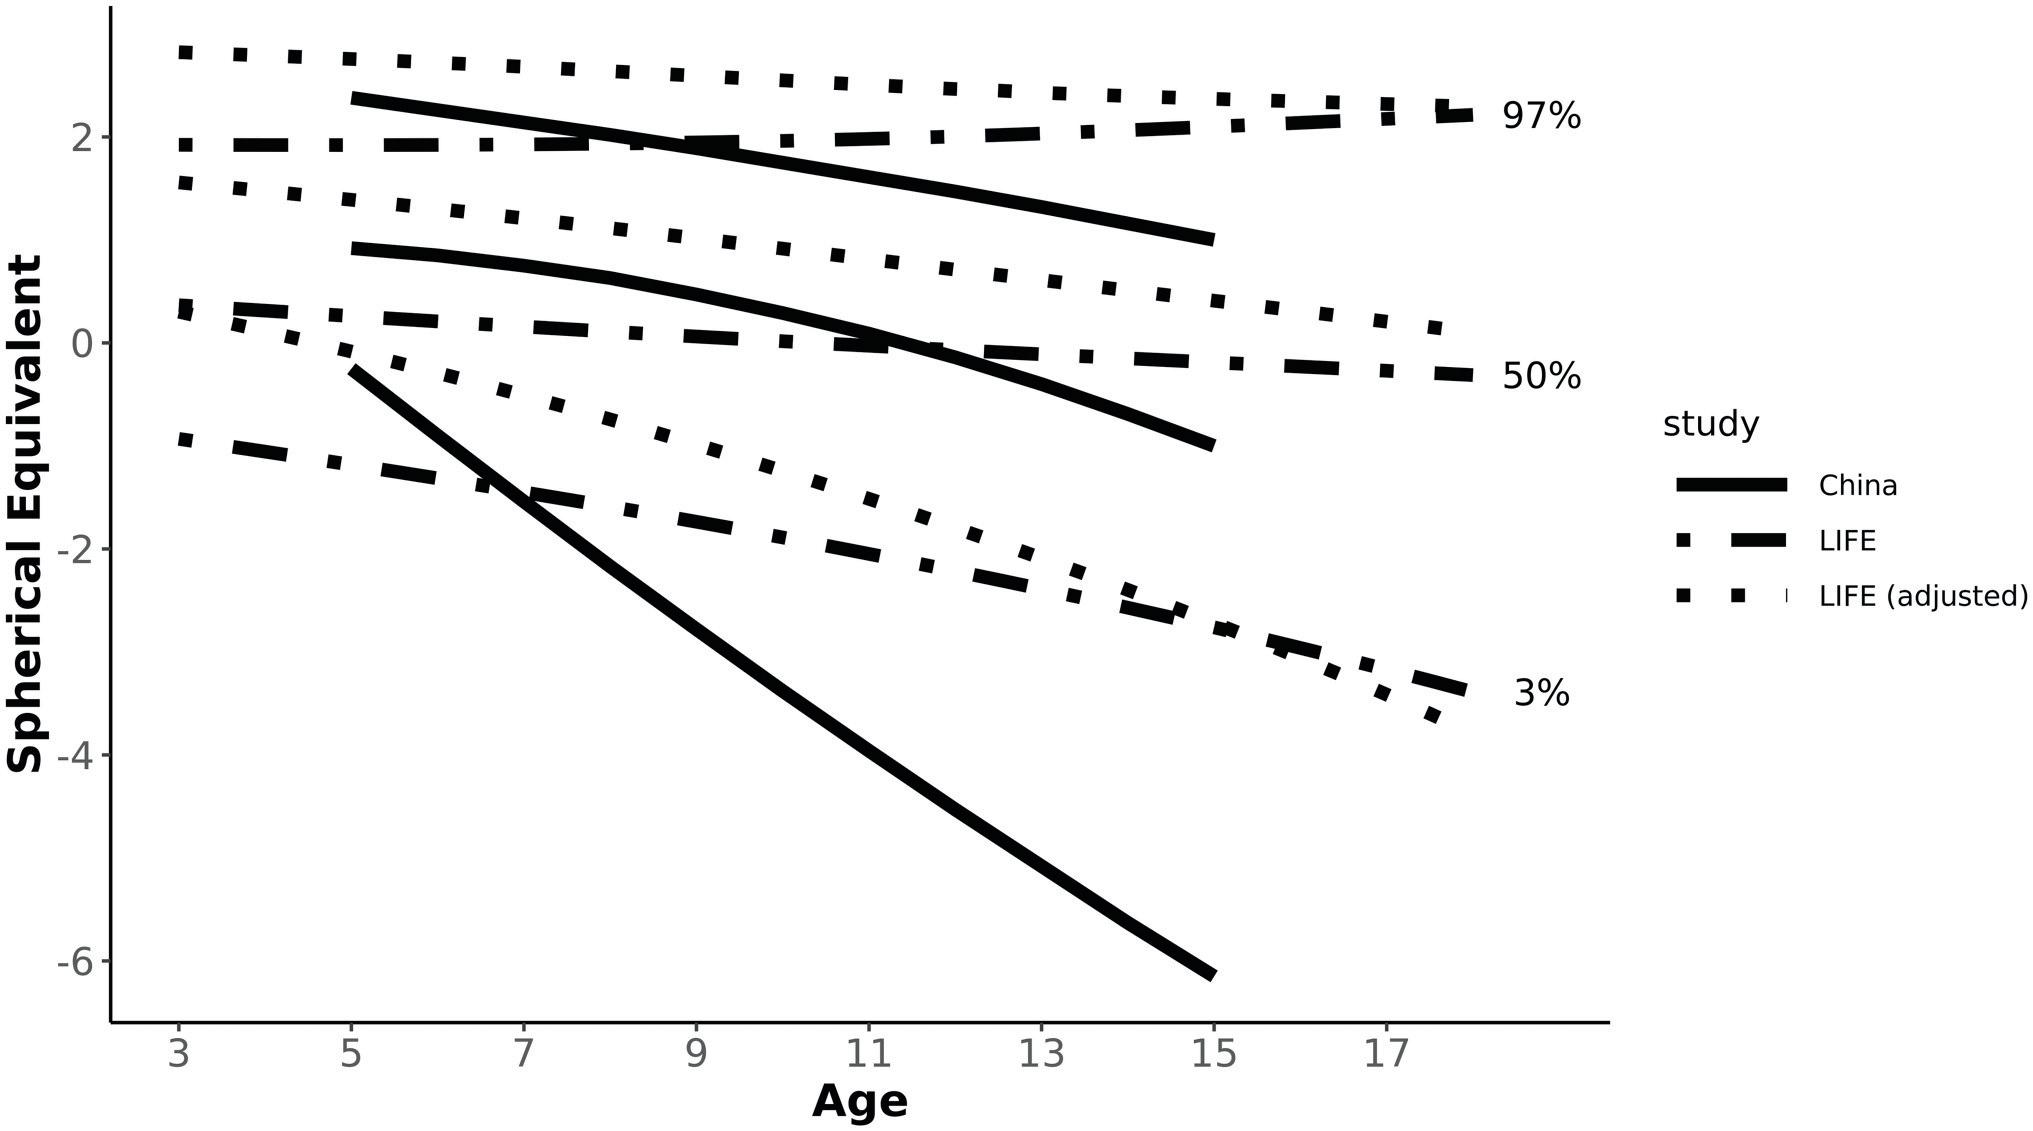
3rd, 50th, 97th centile reference curves of refraction over age for boys. The dashed lines represent the data of the LIFE Child study, the dotted lines the data of the LIFE Child study transferred by the calculation of Sakaridurg et al. into comparable data for cycloplegia and the continous lines show the results of the RESC study from a city in China. Source: PLOS ONE 3rd, 50th, 97th centile reference curves of refraction over age for girls. The dashed lines represent the data of the LIFE Child study, the dotted lines the data of the LIFE Child study transferred by the calculation of Sakaridurg et al. into comparable data for cycloplegia and the continous lines show the results of the RESC study from a city in China. Source: PLOS ONE