15 minute read
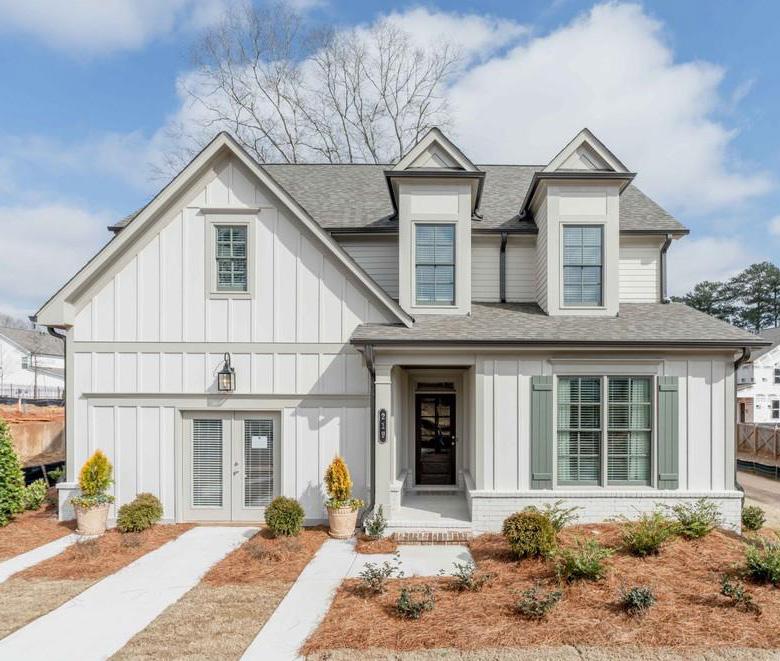
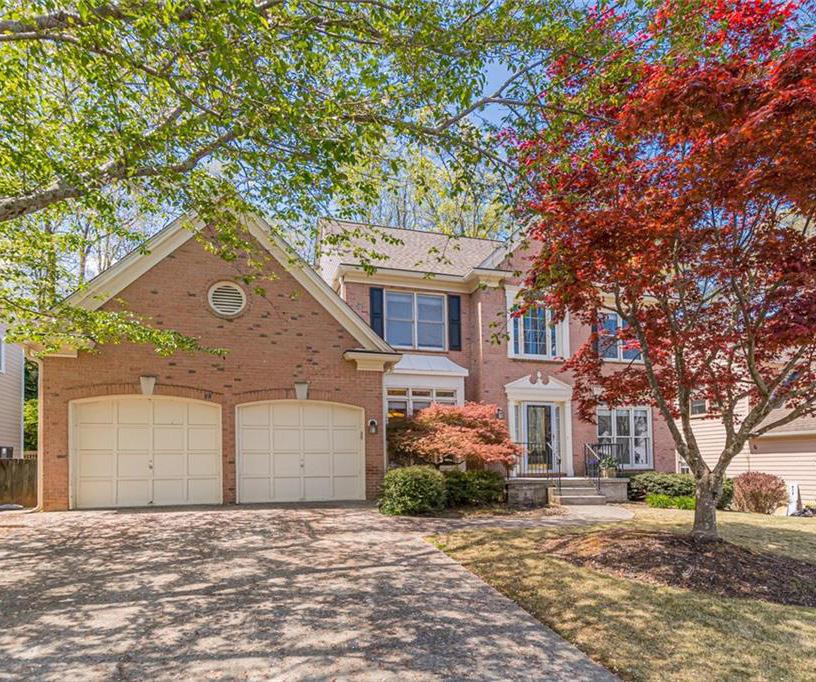
Single-Family Homes


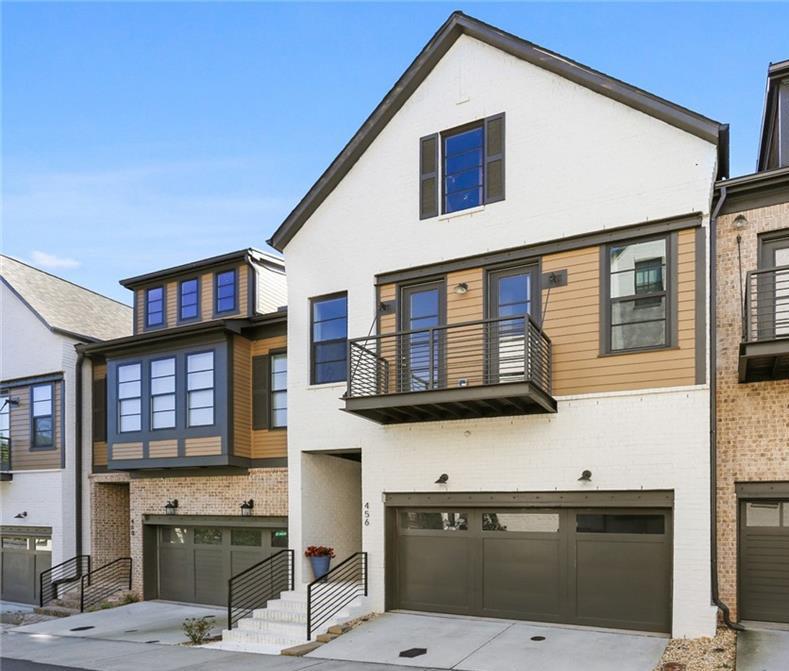
In 2022, most homes sold in Metro Atlanta were detached single-family homes (77%). There were 51,855 single-family homes sold last year, the fewest of any 12-month period since 2015. Like the market overall, there were about 30% fewer singlefamily homes sold in the second half of 2022 (23,169 homes) compared to the same period in 2021, a trend related to higher mortgage interest rates.
The average single-family home in Metro Atlanta sold for $509,136 in Q3 and Q4 2022, up 10% year-
Metro Atlanta Single-Family Home Summary (Q3 & Q4 2022) over year. Since the same period in 2019, the average sale price was 49% ($167,570), resulting in significant equity for existing homeowners. While negotiation and some seller concessions became more common than early in the year, sellers continued to get close to
Source: FMLS InfoSparks, Greater Atlanta Area, Single-family homes, Rolling 6-months as of December 2022 (year-over-year change compared to rolling 6-months as of December 2021) their asking price in late 2022, with an average sale price to original list price of 97.2%.
The tight inventory of single-family homes for sale (2.2 months of inventory) is a key reason prices have continued to rise even as higher interest rates dampened demand.
Single-family home sales under $500,000 (-36.9%) were down more than higher priced homes in late 2022. This is in part because rising home prices overall pushed more homes into higher price brackets.
Source: FMLS InfoSparks, Greater Atlanta Area, Single-family homes, Rolling 6-months as of December 2022 (year-over-year change compared to rolling 6-months as of December 2021)
Source: FMLS InfoSparks, Greater Atlanta Area, Single-family homes, Rolling 6-months as of December 2022 (year-over-year change compared to rolling 6-months as of December 2021)
Single-Family Homes - Inside the Perimeter
Homebuyers looking for a singlefamily home ITP paid an average of $682,681 in the second half of 2022, up 7.3% from the same period in 2021. Intown living commanded a substantial premium compared to more suburban locations, with an average price $173,545 (34%) higher for ITP homes compared to the metro average.
Although prices continued to grow year-over-year, the market was quieter in the second half of 2022, with 32.6% fewer single-family homes sold ITP compared to the same period last year. Homes priced between $700,000 and $1 million kept the closest pace to 2021 (-4.8% fewer sales), likely because these more affluent buyers may be less sensitive to interest rates, more homes were priced in this range, and buyers previously looking at homes priced over $1 million may have shifted their search to this range.
Continued price growth has reduced the number of single-family homes available at an entry level price point in Metro Atlanta. In the second half of 2022, just 65% of single-family homes sold for less than $500,000. This is down from the same period in 2021, when 72% of homes sold for less than $500,000. In 2019, it was 86%. This trend was even more pronounced ITP. In the second half of 2022, less than half of all singlefamily homes (47%) ITP sold for less than $500,000.
Fewer homes have been listed in Metro Atlanta each month since summer 2022, reflecting seasonal trends and rising interest rates that have made current homeowners hesitant to move. In the ITP singlefamily home market, this trend held up for homes under $500,000. There were 14% fewer new listings in the second half of 2022 compared to the same period in 2021, a decline that outpaced the dwindling share of homes sold for less than $500,000. Homeowners in this price range may be more sensitive to rising interest rates, less willing to move, or may be listing their homes at higher prices. At higher price points, the number of listings rose compared to the same period in 2021, with 20% to 22% more homes for sale in 2022.
Key Stats ITP Single-Family Homes
(Q3 & Q4 2022)
• $682,681 average sale price (+7.3% YOY)
• 14% of all single-family home sales were ITP
• 18% of all single-family home listings were ITP
• ITP homes sold at the same pace as the metro average (26 days on market)
• Homes sold for 97.9% of the original list price on average
Inventory levels remained relatively low at 2.1 months of supply for homes between $500,000 and $999,999 and 3.3 months of supply for homes over $1 million.
Q3 + Q4 2022 ITP Single-family Home Superlatives
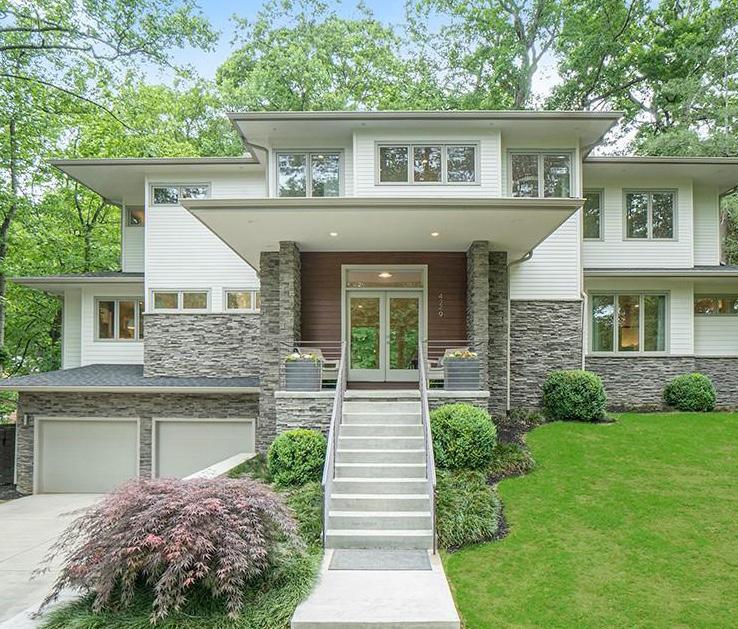
Most Expensive Area to Buy a Single-Family Home ITP Chastain Park (Average sale price of $2,281,660)
Fastest Growing Average Single-Family Home Prices ITP
Brookwood Hills (+29.9% Q3/Q4 average closed sale price in 2022 vs. 2021)
Highest Price Per Square Foot for Single-Family Homes ITP Cabbagetown (Average $449/SF)
Shortest Average Days on Market ITP Inman Park (Average 10 days on market)
Where Can You Buy the Typical Single-Family Home for...
Less than $499,999
Cascade East
Cascade West
College Park
East Atlanta
East Point
Hapeville
Summerhill
West End/
Capitol View
$500,000 to $699,999 $700,000 to $1 million Over $1 million
Avondale Estates
Cabbagetown
Chamblee
East Lake
Edgewood
Grant Park/ Glenwood Park
Kirkwood
Ormewood Park
Reynoldstown
West Midtown/ Underwood Hills
Brookhaven
Collier Hills/ Ardmore Park
Decatur
Druid Hills/ Emory
Lake Claire/Little
Five Points
Oakhurst
Old Fourth Ward
Peachtree Hills
Vinings
Ansley Park/ Sherwood Forest
Brookwood Hills
Buckhead
Chastain Park
Garden Hills
Inman Park
Virginia
Highlands/ MorningsideLenox Park
ITP Single-Family Home Summary by Neighborhood - Q3 & Q4 2022
Source: FMLS InfoSparks,Single-family homes, Rolling 6-months as of December 2022 (year-over-year change compared to rolling 6-months as of December 2021)
ITP Single-Family Home Summary by Neighborhood - Q3 & Q4 2022 (Continued)
New Construction Single-Family Homes ITP
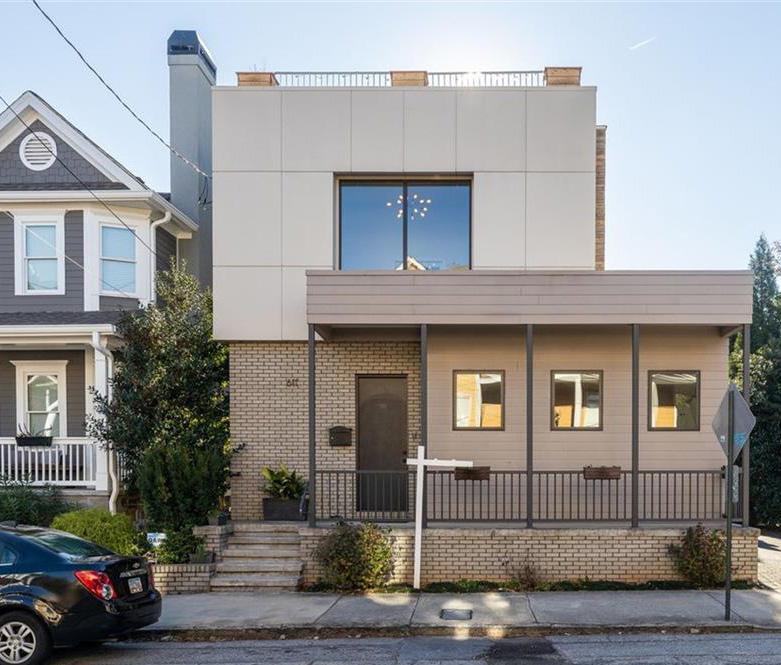
Almost all the single-family homes sold ITP were resale. Of the 3,297 detached single-family homes sold ITP in the second half of 2022, only 160 were new construction, representing just 4.9% of sales. Most were “infill” homes built on a lot in an established neighborhood, rather than as new subdivisions as seen in many OTP areas. They ranged from $279,000 for a 2-bedroom, 742-square-foot home in English Avenue to $5,779,000 for a custom 7-bedroom home with more than 11,000 square feet in Mount Paran.
Most were priced under $600,000 (59%); however, a significant number of homes priced over $1 million (23%) brought the average sale price for a new home ITP to $931,134. New homes priced under $600,000 were typically located on the south and west sides in places like Pittsburgh, Oakland City, Mozley Park, Bankhead, and Hapeville. Homes over $1 million were typically located on the north and east sides of town in places like Oakhurst, Buckhead, and Brookhaven.
Single-Family Homes - Outside the Perimeter
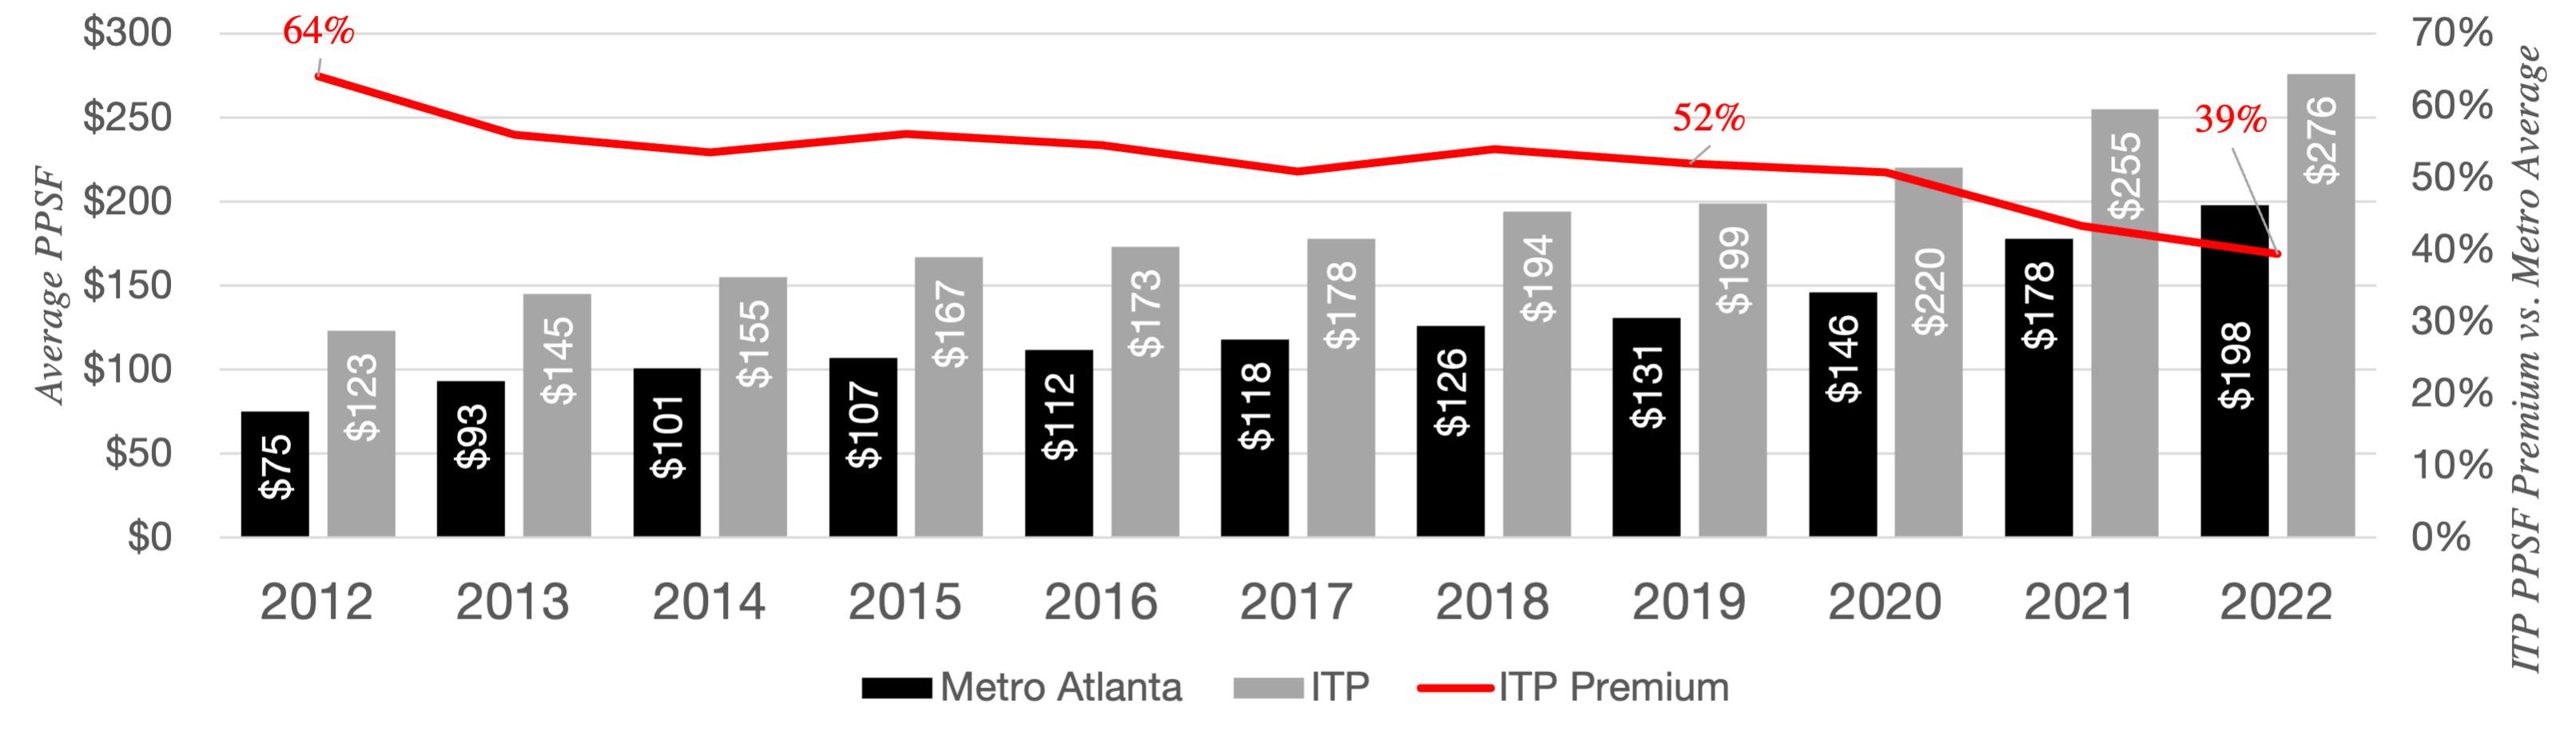
Single-family homes continue to be the primary type of housing outside the perimeter. Homes in suburban areas tend to offer more space at a lower cost per square foot, an appealing option for families and other buyers looking to get more for their money. However, the relative savings of OTP living has been declining in recent years. A decade ago, ITP homes cost 64% more per square foot (PPSF) than the average home in Metro Atlanta ($123/SF ITP compared to $75/SF on average). In late 2022, that premium had declined to 39% ($276/SF ITP compared to $198/SF on average). This may reflect factors like an increase in the share of homes built OTP since 2012 (which tend to be smaller than those built in previous decades), an increasing share of new homes in the suburbs (which tend to cost more per square foot than resale), rising property values as suburban cities have developed their own town centers and amenities, or shifting preferences toward suburban living since the COVID-19 pandemic, which accelerated the shrinking gap between intown and suburban PPSF.
Still, homes in suburban Atlanta remain relatively affordable, and many places have average home prices below the national average.
Key Stats
OTP
SingleFamily Homes
(Q3 & Q4 2022)
• 86% of all single-family home sales were OTP
• 82% of all single-family home listings were OTP
Metro Atlanta vs. ITP Price Per Square Foot - Single-Family Homes (Q3 & Q4, 2012 to 2022)
Q3 + Q4 2022 OTP Single-family Home Superlatives
Most Expensive Area to Buy a Single-Family Home OTP
Fastest Growing Average Single-Family Home Prices OTP
Highest Price Per Square Foot for Single-Family Homes OTP
Shortest Average Days on Market OTP
Milton (Average Q3/Q4 sale price $1,315,685)
Milton (+24.3% Q3/Q4 average closed sale price in 2022 vs. 2021)
Chattahoochee Hills (Average $397/SF)
Tied between Dunwoody, McDonough, and Tucker (Average 19 days on market)
Where Can You Buy the Typical Single-Family Home for...
Less than $499,999 $500,000 to $699,999 $700,000 to $1 million Over $1 million
Acworth
Clarkston
Douglasville
Fairburn
Fayetteville
Kennesaw
Lawrenceville
Mableton
McDonough
Norcross
Snellville
South Fulton
Sugar Hill
Tucker
Union City
Woodstock
Canton
Cumming
Duluth
Dunwoody
East Cobb
Marietta
Peachtree City
Peachtree
Corners
Smyrna
Suwanee
Alpharetta
Chattahoochee Hills
Johns Creek
Roswell
Milton Sandy Springs
OTP Single-Family Home Summary by Area - Q3 & Q4 2022
Source: FMLS InfoSparks, Single-family homes, Rolling 6-months as of December 2022 (year-over-year change compared to rolling 6-months as of December 2021)
OTP Single-Family Home Summary by Area - Q3 & Q4 2022 (Continued)
New Construction SingleFamily Homes OTP
There were 1,891 new construction single-family homes sold in Metro Atlanta in Q3 and Q4 2022. They sold for an average of $638,025, or $216 per square foot. Most single-family home construction in Atlanta is happening in the suburbs, particularly those north of Atlanta. Although some of these new homes were built as infill on lots in existing neighborhoods as is typical ITP, many were constructed as part of new subdivisions in suburban areas.

Gwinnett County had the most new construction single-family homes sold in late 2022 (393 homes), followed by Fulton (327), Cobb (224), Cherokee (219), and Forsyth (218) Counties.
The top cities for new singlefamily construction sales OTP were in the outer ring of the metro: Cumming, Canton, Loganville, and Fairburn. Marietta had the most new construction sales of closer in cities, with an average sale price of nearly $1 million for new single-family homes.
About 10% of new construction single-family homes sold in late 2022 were luxury homes priced at $1 million or higher. Most were in Fulton (45%), Cobb (21%), or DeKalb (16%) Counties. The most popular OTP cities for new homes over $1 million were Marietta (32 homes), Milton (20 homes), Alpharetta (16 homes), Canton (10 homes), and Johns Creek (10 homes).
The most affordable cities for new construction homes were all located south of Atlanta: Jonesboro ($290,000 average sale price), South Fulton ($312,495), Lovejoy ($379,066), East Point ($379,066), and Villa Rica ($382,463).
Top
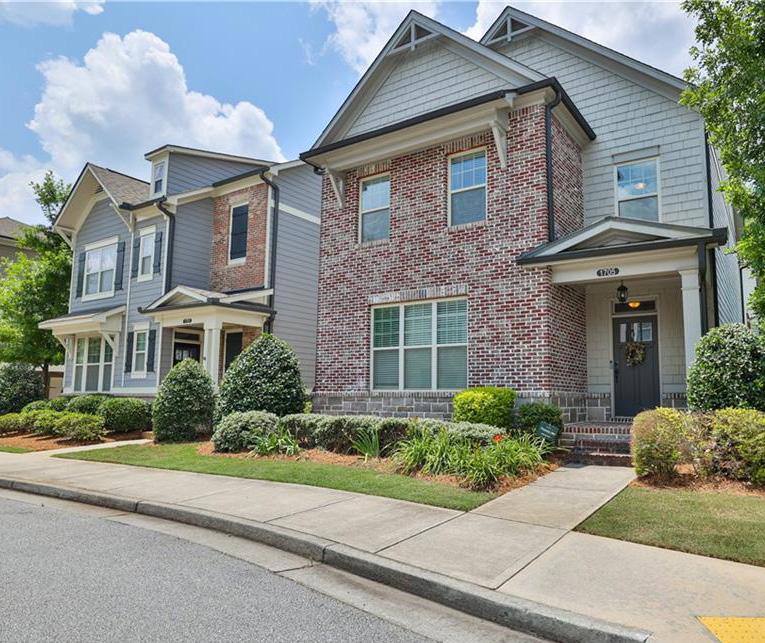
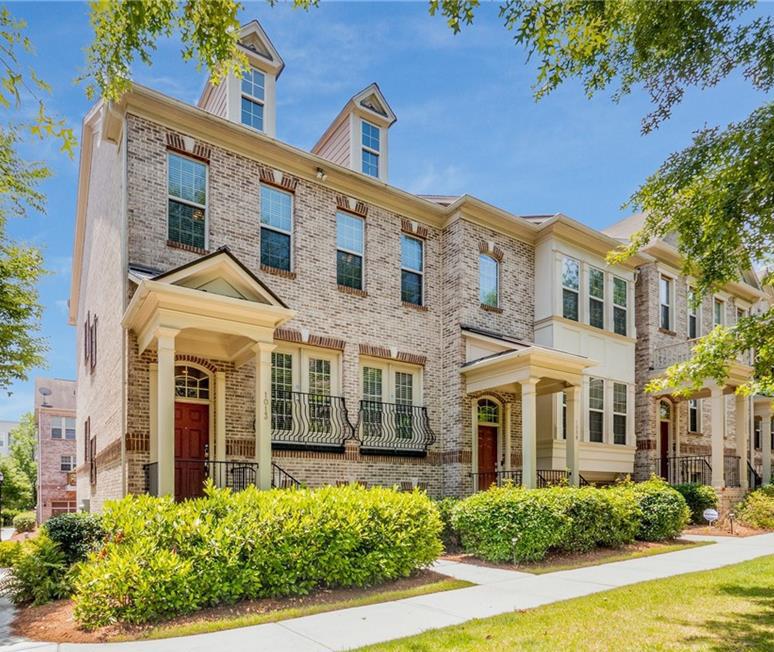
Townhomes
There were 9,689 townhomes sold in Metro Atlanta in 2022, lower than the record sales of the pandemic era due to a slower second half of the year, but still 1% higher than in 2019.
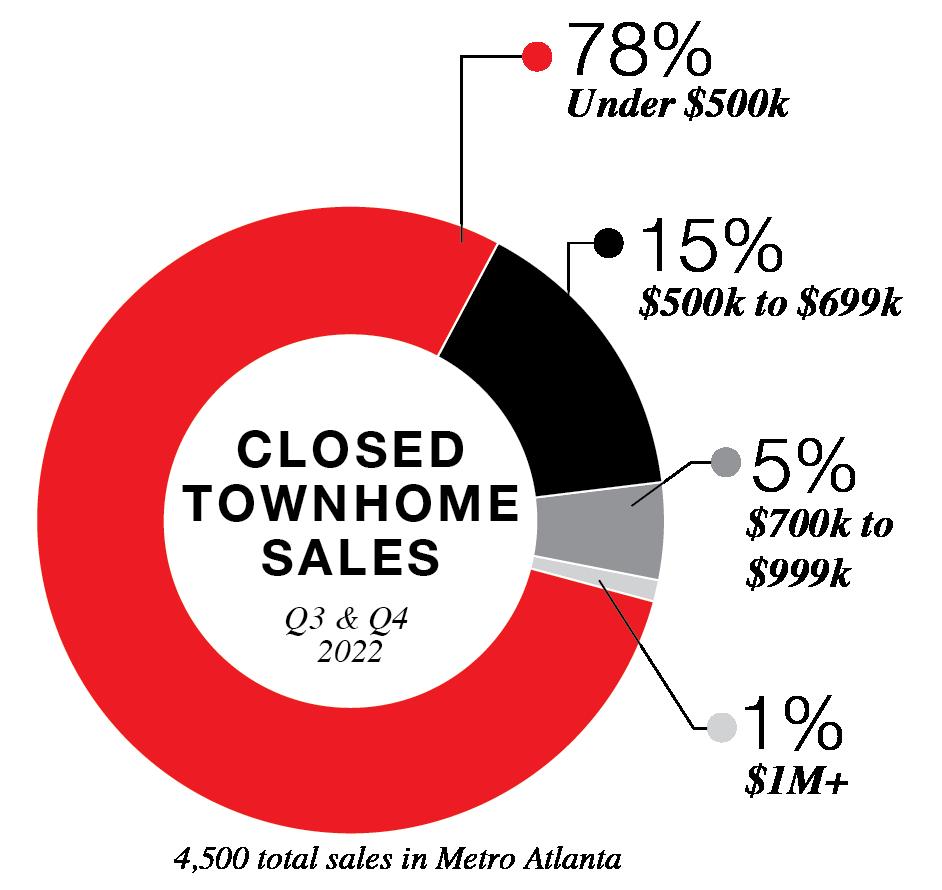
Townhomes have become an increasingly popular choice for Metro Atlanta homebuilders and buyers over the past decade, offering many of the perks of a single-family home with a lower price tag and less exterior maintenance. In late 2012, 10.5% of all homes purchased in the metro were townhomes. In the second half of 2022, about 15% of Metro Atlanta homebuyers opted for townhomes, with 4,500 total sales in Q3 and Q4.
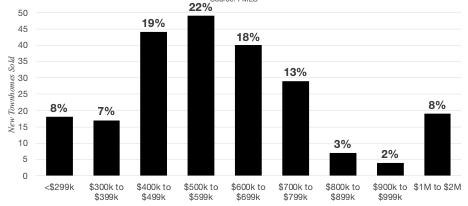
Although the total number of townhomes sold was down in the second half of 2022 (-26% compared to the same period in 2021) sale prices continued to rise. The average price for a townhome in Metro Atlanta was $395,933 in Q3 and Q4, 10% higher than the same period in 2021, in part because of limited inventory. 78% of townhomes sold for less than $500,000. Even with growing prices, townhomes remain a more affordable option than detached single-family homes, which sold on average for $113,149 more than the average townhome.
This relative cost savings is a key factor in the growing popularity of townhomes. There were just 1.9 months of townhome inventory in late 2022, a slightly tighter supply than the market overall. They went under contract in 22 days on average, faster than single-family homes or condominiums.
Most townhome sales were in suburban areas outside the perimeter, with about a quarter of townhome sales ITP. Threebedroom townhomes were the
Key Stats
Metro Atlanta
Townhomes
(Q3 & Q4 2022)
• $395,933 average sale price (+10.1% YOY)
• 15% of all homes sold were townhomes
• Townhomes sold 3 days faster than average (22 days on market)
• Townhomes sold for 98.7% of the original list price on average, the highest of any home type most purchased category, making up 62% of all townhome sales and averaging $403,020. Although they made up a smaller share of the market, 2-bedroom townhomes have the highest relative demand, with just 1.5 months of supply in Metro Atlanta.
While luxury townhomes continue to be a small portion of the overall townhome market (less than 2% of sales), there were 14% more townhomes sold for $1 million or more in the second half of 2022 compared to 2021. This shows a growing number of luxury buyers interested in a low-maintenance townhome lifestyle and an expanding portfolio of new luxury townhomes to choose from. With a smaller pool of luxury buyers, these townhomes tended to stay on the market about twice as long as more affordable townhomes, averaging 44 days on the market.
Metro Atlanta Townhome Summary (Q3 & Q4 2022)
Source: FMLS InfoSparks, Greater Atlanta Area, Townhomes, Rolling 6-months as of December 2022 (year-over-year change compared to rolling 6-months as of December 2021)
Source: FMLS InfoSparks, Greater Atlanta Area, Townhomes, Rolling 6-months as of December 2022 (year-over-year change compared to rolling 6-months as of December 2021)
Q4 2022)
Source: FMLS InfoSparks, Greater Atlanta Area, Townhomes, Rolling 6-months as of December 2022 (year-over-year change compared to rolling 6-months as of December 2021)
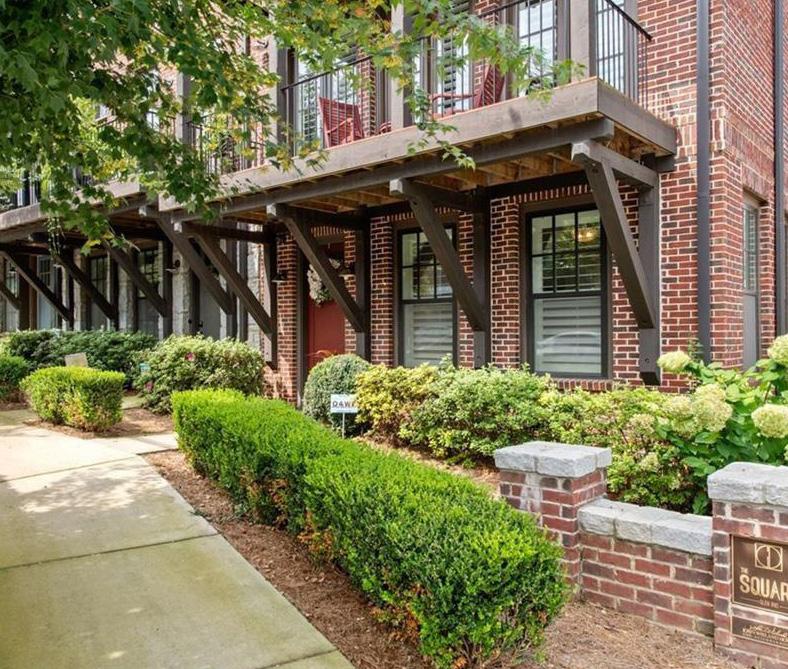
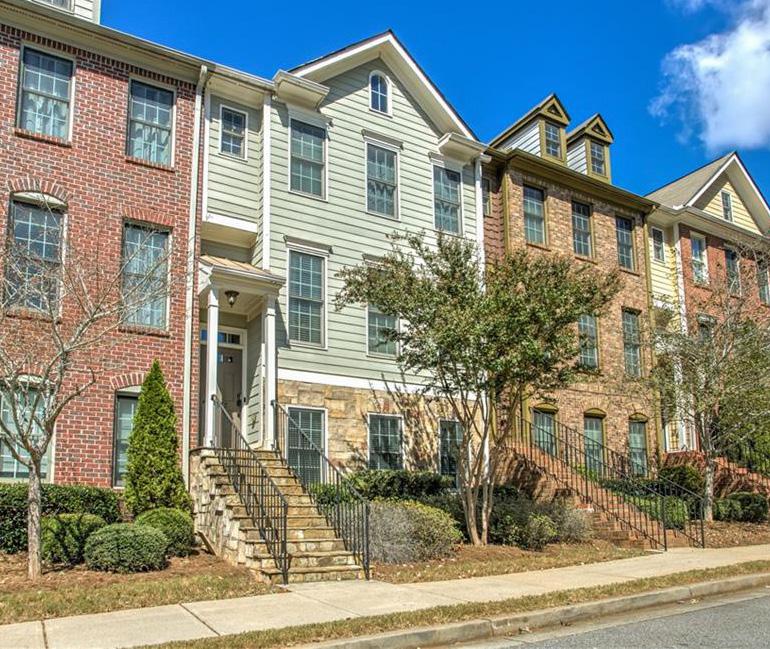
Townhomes - Inside the Perimeter
The growing trend toward townhomes has been even stronger ITP than in the metro overall. In the late 2012, 13% of all homes sold ITP were townhomes. By the second half of 2022, 18% were townhomes (1,023 sales). The cost savings compared to a detached single-family home was greater too. In Q3 and Q4 2022, the average ITP townhome cost $517,902, about $164,355 (24%) cheaper than the average detached single-family home. About 55% of ITP townhomes sold for less than $500,000, a higher share than the 47% of ITP single-family homes in the same price range.
Like the market overall, the total number of townhomes sold ITP was down in the second half of 2022 compared to the same period in 2021 (-34%). As with single-family homes, intown sales for townhomes under $500,000 were down more than those at higher price points (-43.3%), reflecting greater buyer sensitivity to rising interest rates in the entry level price range.
The ITP luxury townhome market is small but growing. Townhomes priced over $1 million were the only price range with more ITP sales in late 2022 compared to 2021 (+2.7%) but remained a fraction of the market with just 38 sales. Though small, that is 475% more luxury townhomes sold than a decade ago. The number of new listings for townhomes over $1 million ITP is up significantly (+41.2% compared to late 2021) while new listings at lower price points is down (-22.6%), reflecting fewer of the less expensive resale townhomes being listed and higher price tags for new construction townhomes being delivered in a period with high construction costs.
Key Stats ITP Townhomes
(Q3 & Q4 2022)
• $517,902 average sale price (+11.1% YOY)
• 18% of all ITP homes sold were townhomes
• 23% of all townhome sales were ITP
• 26% of all townhome listings were ITP
• 22% ITP townhomes sold were new construction
• ITP homes sold a little slower than the metro average (26 days on market)
• Homes sold for 98.7% of the original list price on average
Q3 + Q4 2022 ITP Townhome Superlatives
Most Expensive Area to Buy a Townhome ITP
Fastest Growing Average Townhome Prices ITP
Highest Price Per Square Foot for Townhomes ITP
Shortest Average Days on Market ITP
Inman Park ($1,215,599 average Q3/Q4 sale price)
Inman Park (+74.3% Q3/Q4 average closed sale price in 2022 vs. 2021)
Inman Park (Average $428/SF)
Tied between Avondale Estates and East Atlanta (Average 4 days on market)
Where Can You Buy the Typical Townhome for...
Less than $300,000
Cascade East College Park
East Point
West End/ Adair Park/ Capitol View/Sylvan Hills
$300,000 to $499,999
Avondale Estates
Collier Hills/ Ardmore Park
Grant Park
Glenwood Park
Peoplestown/ Chosewood Park/
Lakewood Heights
Vinings
West Midtown/ Underwood Hills
$500,000 to $699,999
Brookhaven
Buckhead
Chamblee
Chastain Park
Decatur
Druid Hills/ Emory
East Atlanta
Edgewood
Garden Hills
Kirkwood
Oakhurst
Ormewood Park
Reynoldstown
Summerhill
$700,000 to $1 million Over $1 million
East Lake
Lake Claire/ Little Five Points
Midtown
Old Fourth Ward
Peachtree Hills
Ansley Park/ Sherwood Forest
Inman Park
ITP Townhome Summary by Neighborhood - Q3 & Q4 2022
ITP Townhome Summary by Neighborhood - Q3 & Q4 2022 (Continued)
New Construction Townhomes ITP
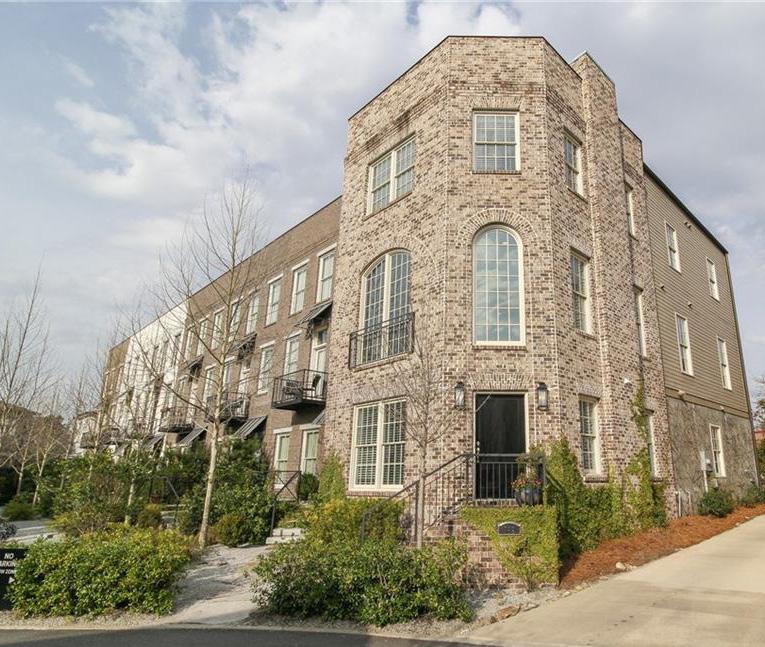
Nearly half (49%) of all new homes sold ITP in Q3 and Q4 2022 were townhomes (227 homes). This was greater than the number of singlefamily homes sold (195 homes), showing a growing trend toward intown townhome development, with designs that uses land more efficiently and often can be sold at a more attainable price point. Townhomes purchased in late 2022 were also more likely to be new builds compared to other types of homes. Although new construction made up just 8% of all ITP home sales in Q3 and Q4, 22% of all townhomes sold ITP were new construction.
These new townhomes were most often located on the west side from West Midtown to the Chattahoochee River; in east side neighborhoods like Old Fourth Ward, Edgewood, Kirkwood, and Summerhill. Unlike new single-family homes ITP, most new construction townhomes
New Construction Townhomes Sold ITP - Q3 & Q4 2022
are part of small townhome developments, by nature of their attached design.
New construction townhomes ranged from $248,500 for a modest 3-bedroom, 1,800-square foot townhome at Browns Mill Village to $1,960,000 for a gut renovation of a historic estate in Druid Hills that was converted to multiple homes, including this 4-bedroom, 4,574-square-foot townhome. Most were priced under $600,000 (56%), with an average sale price of $618,826 ($309 per square foot).46
Townhomes - Outside the Perimeter
Townhomes were a popular choice for buyers in all parts of suburban Atlanta, from Canton in the north to Fayetteville in the south. Most of the townhomes sold in the second half of 2022 were located OTP (77%).
The highest concentrations of townhome sales were in centrally located Fulton, DeKalb, and Cobb Counties, followed by the northern suburban counties. Fewer townhomes were sold in suburban counties south of Atlanta, where the housing stock leans more heavily toward single-family homes.
Fayette County had the fewest townhome sales in late 2022, with just 12 sales, but the highest average sale price of all Metro Atlanta counties. The average price for a townhome in Fayette County was driven by the fact that most sales were custom built townhomes in the new Trilith development, a master planned community next to Trilith Studios and designed to attracted film industry employees with convenient, high-end homes.
Key Stats
OTP Townhomes (Q3 & Q4 2022)
• 77% of all townhome sales were OTP
• 74% of all townhome listings were OTP
Q3 + Q4 2022 OTP Townhome Superlatives
Most Expensive Area to Buy a Townhome OTP
Fastest Growing Average Townhome Prices OTP
Chattahoochee Hills ($838,908 average Q3/Q4 sale price)
Fayetteville (+161.9% Q3/Q4 average closed sale price in 2022 vs. 2021)
Highest Price Per Square Foot for Townhomes OTP Chattahoochee Hills (Average $431/SF)
Shortest Average Days on Market OTP Fairburn (Average 3 days on market)
Source: FMLS InfoSparks, Rolling 6-months as of December 2022
Where Can You Buy the Typical Townhome for...
Clarkston
Douglasville
Fairburn
McDonough
Norcross
South Fulton
Tucker
Union City
Acworth
Canton
Duluth
East Cobb
Johns Creek
Kennesaw
Lawrenceville
Mableton
Marietta
Peachtree City
Peachtree
Corners
Sandy Springs
Smyrna
Snellville
Sugar Hill
Suwanee
Woodstock
Alpharetta
Dunwoody
Fayetteville
Milton
OTP Townhome Summary by Area - Q3 & Q4 2022
Source: FMLS InfoSparks, Townhomes, Rolling 6-months as of December 2022 (year-over-year change compared to rolling 6-months as of December 2021) q Down YOY p Up YOY
OTP Townhome Summary by Area - Q3 & Q4 2022
q Down YOY p Up YOY s Below TH Market Average r Above TH Market Average w Equal to TH Market Average
New Construction Townhomes OTP
There were 1,037 new construction townhomes sold in Metro Atlanta in Q3 and Q4 2022.47 They sold for an average of $471,488— about $167,000 less than the cost of the average new single-family home, making townhomes a more affordable option for buyers looking for new construction. Most new townhomes were constructed outside of the perimeter, often around the historic and emerging town centers of suburban cities.
Fulton County had the most new construction townhomes sold in late 2022 (401 homes), followed by Gwinnett (199 homes), DeKalb (183 homes), Cobb (112 homes), and Cherokee (109 homes) Counties. In Fulton County, there were more new construction sales for townhomes than for single-family homes (327 homes) in Q3 and Q4 2022. Few new construction townhomes were sold on counties in the south Metro area, with just 21 new townhomes sold between Clayton, Henry, Fayette, Rockdale, and Douglas Counties.
The top cities for new construction townhome sales OTP were spread across the north and south sides of the metro, typically in cities that have been working on establishing more defined town centers: Fairburn, Woodstock, Suwanee, Stonecrest, Lithonia, and Peachtree Corners.
Luxury townhomes—priced at $1 million or higher—are an emerging part of the townhome market, offering a low-maintenance option for high-end buyers. About 2% of new construction townhomes sold in late 2022 were more than $1 million, all located in Fulton or DeKalb Counties, and mostly within the City of Atlanta. The only OTP cities with new construction townhome sales over $1 million were Alpharetta and Milton.
As with new single-family homes, the most affordable cities for new construction homes were all located south of Atlanta: Morrow ($231,475 average sale price), South Fulton ($261,049), Stockbridge ($284,123), Lithonia ($294,817), and Fairburn ($296,179).