2 minute read
Market Snapshot


Across Metro Atlanta, home sales slowed in the second half of 2022, reflecting normal seasonal trends at an accelerated pace due to higher interest rates and uncertain economic conditions. The number of homes sold was down about 30% marketwide compared to Q3 and Q4 2021, and down 22.7% compared to the same period in 2019, a more normal year.
Although new listings declined consistently, the total number of listings went up as homes stayed on the market longer than they did in the hot early 2022 market. went up as homes stayed on the market longer than they did in the hot early 2022 market. Homes averaged
25 days on market in Q3 and Q4 2022. More affordable homes were typically scooped up faster than the more expensive inventory, and townhomes and condominiums sold faster than single-family homes. Inventory remained low at just 2.1 months of supply. This limited
Metro Atlanta Market Summary - All Home Types (Q3 & Q4 2022)
inventory helped to stabilize home prices despite a decline in demand. The average sale price was up 9.9 % year-over-year, and up 44.8% from the same period in 2019, with an average increase of $147,969 since 2019 (including $18,593 last year).
Source: FMLS InfoSparks, Greater Atlanta Area/City of Atlanta/ITP, All home types, All price points, Rolling 6-months as of December 2022 (year-over-year change compared to rolling 6-months as of December 2021)
$400,000 median sale price
$477,701 average sale price
2.1 months of inventory
Single-Family Homes: 2.2 months
Townhomes: 1.9 months
Condominiums: 1.7 months

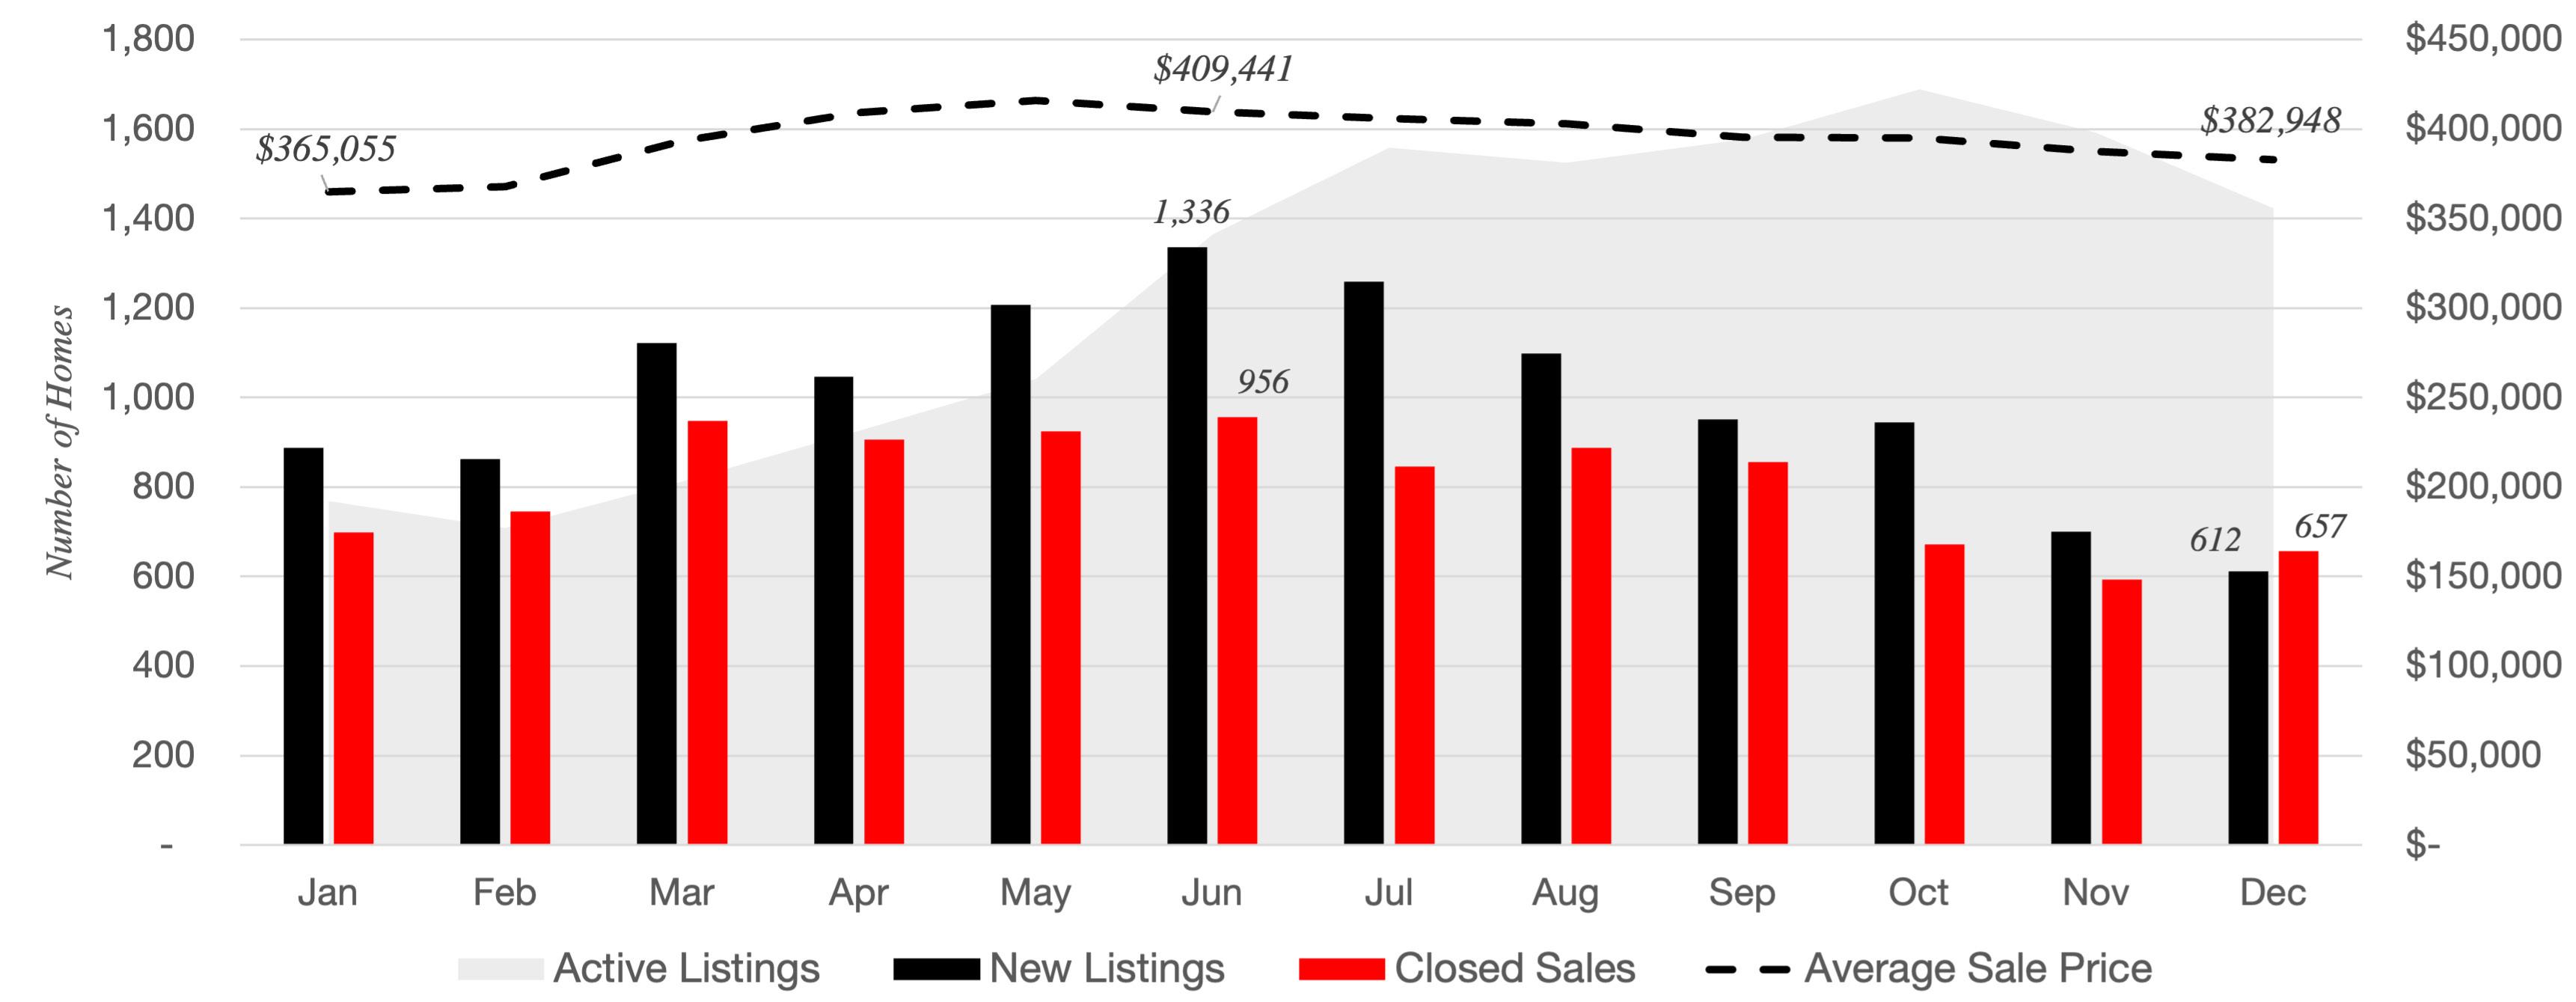
Supply Dynamics by Home Type
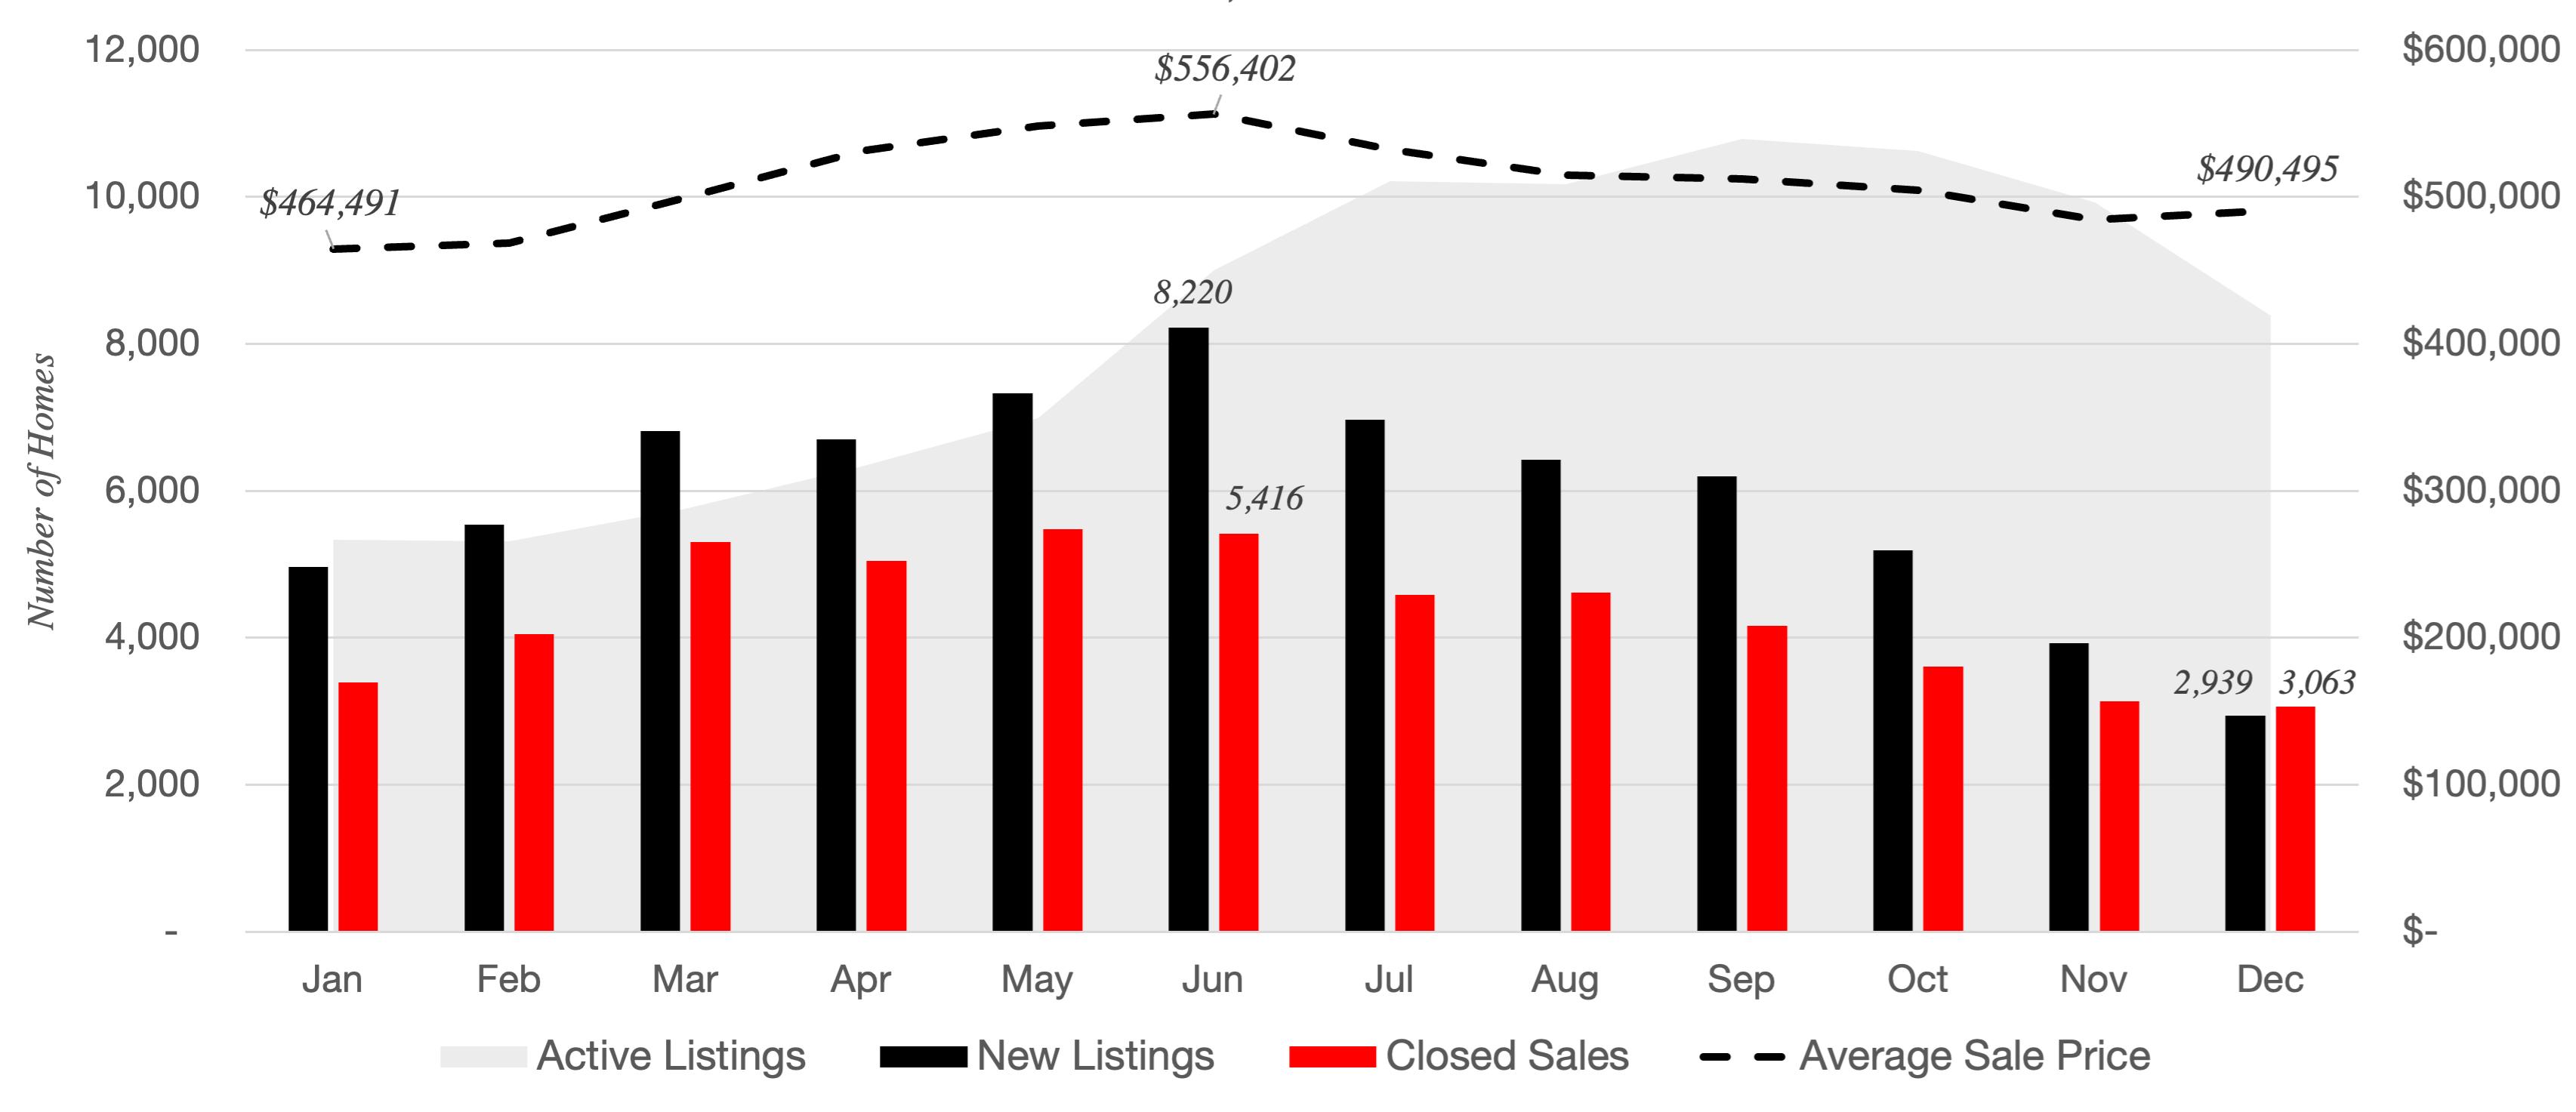
Metro Atlanta 2022 Supply Dynamics - All Home Types
Source: FMLS InfoSparks, Greater Atlanta Area, All Home Types, January to December 2022
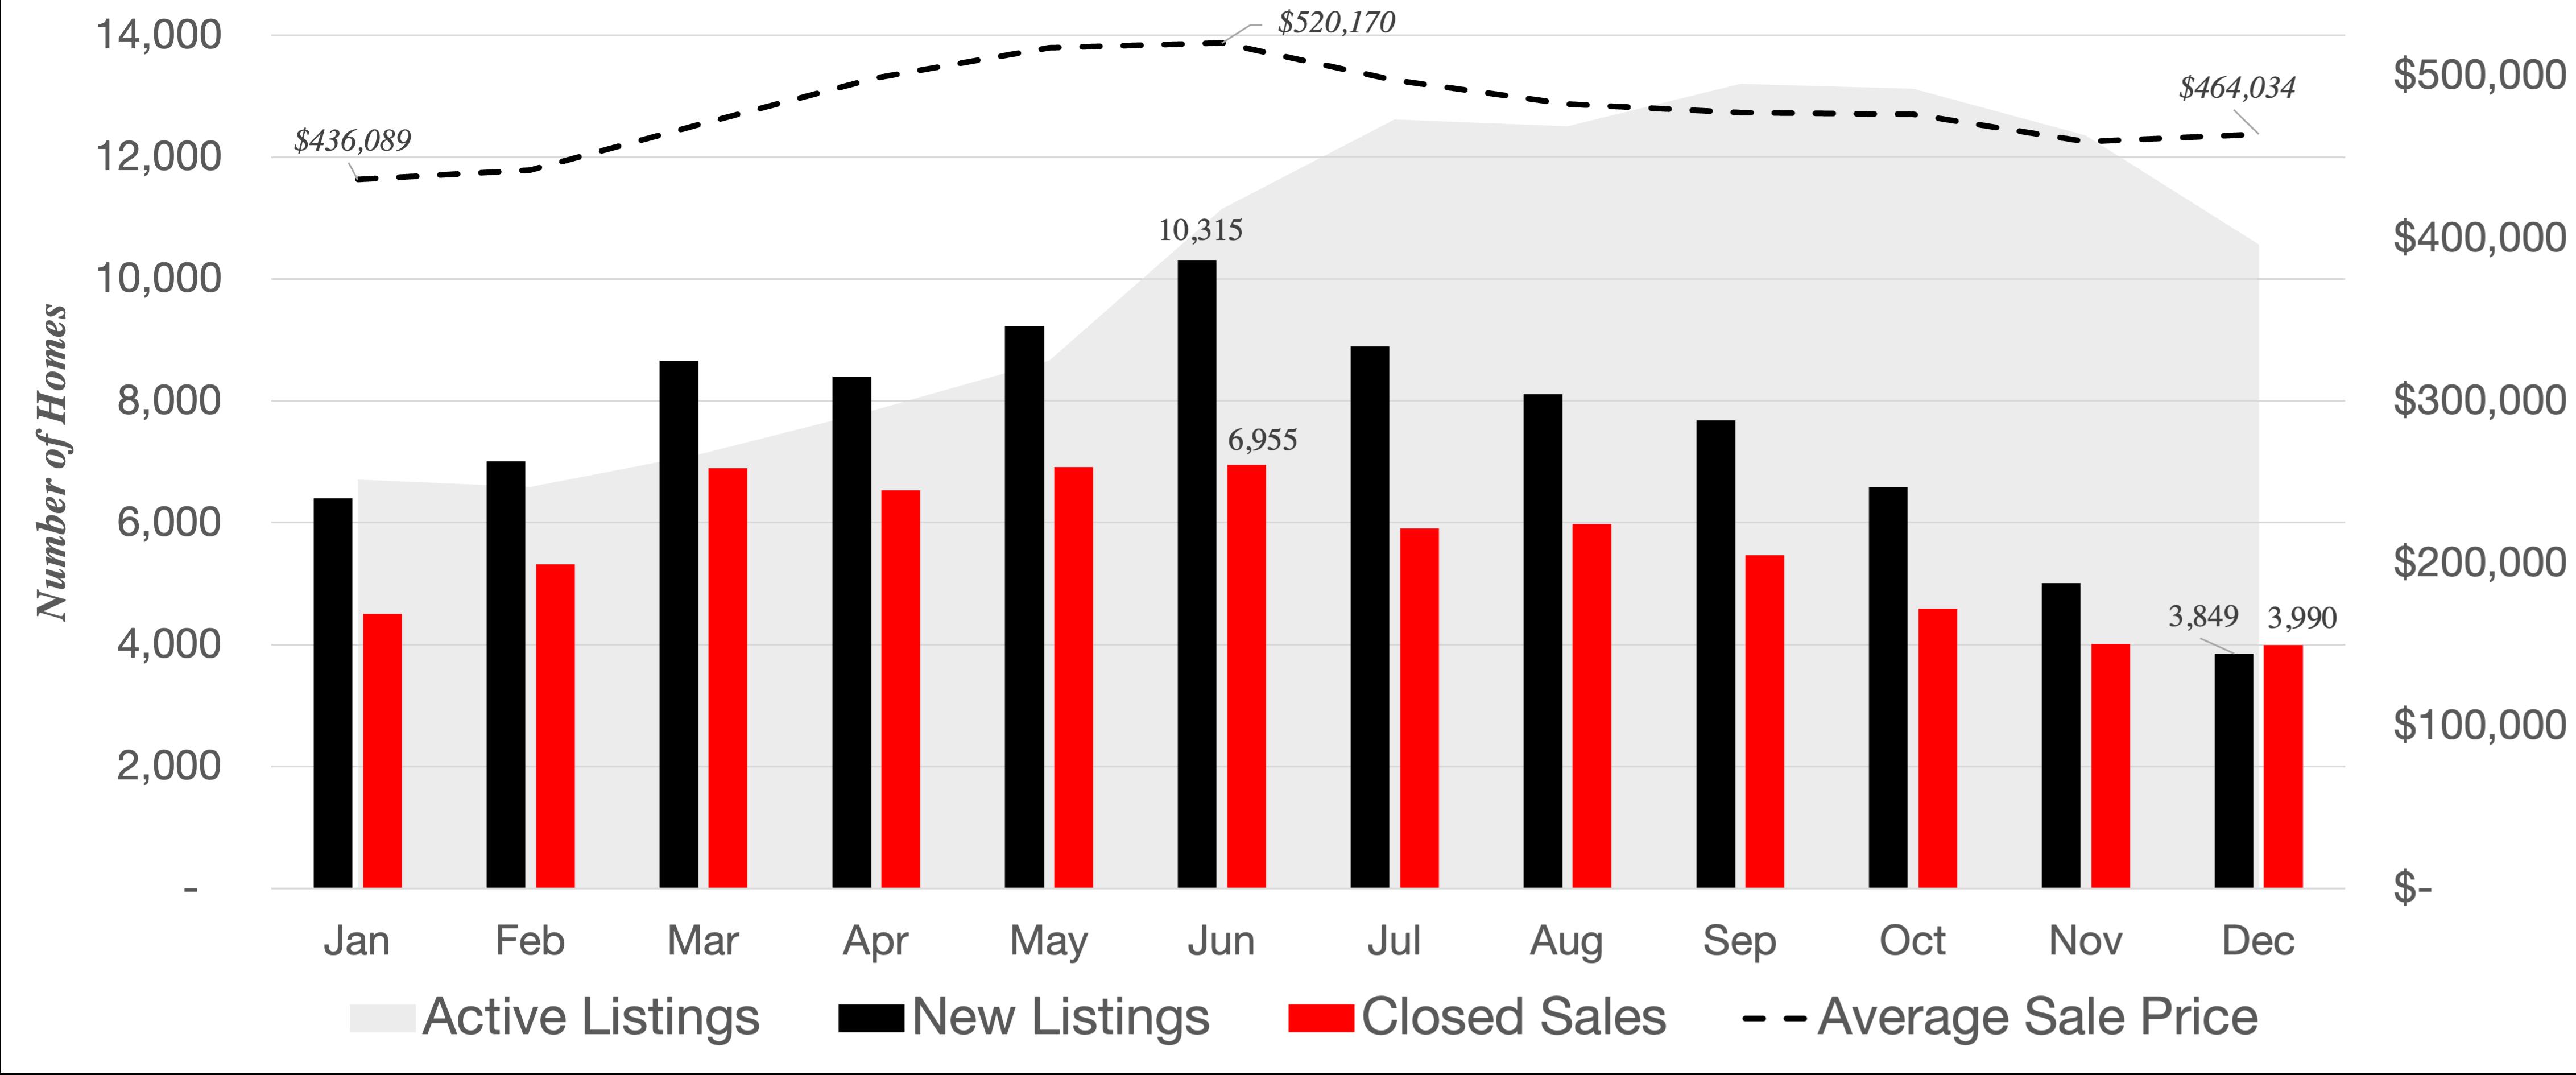
Metro Atlanta 2022 Supply Dynamics - Single-Family Homes
Source: FMLS InfoSparks, Greater Atlanta Area, Single-Family Homes, January to December 2022
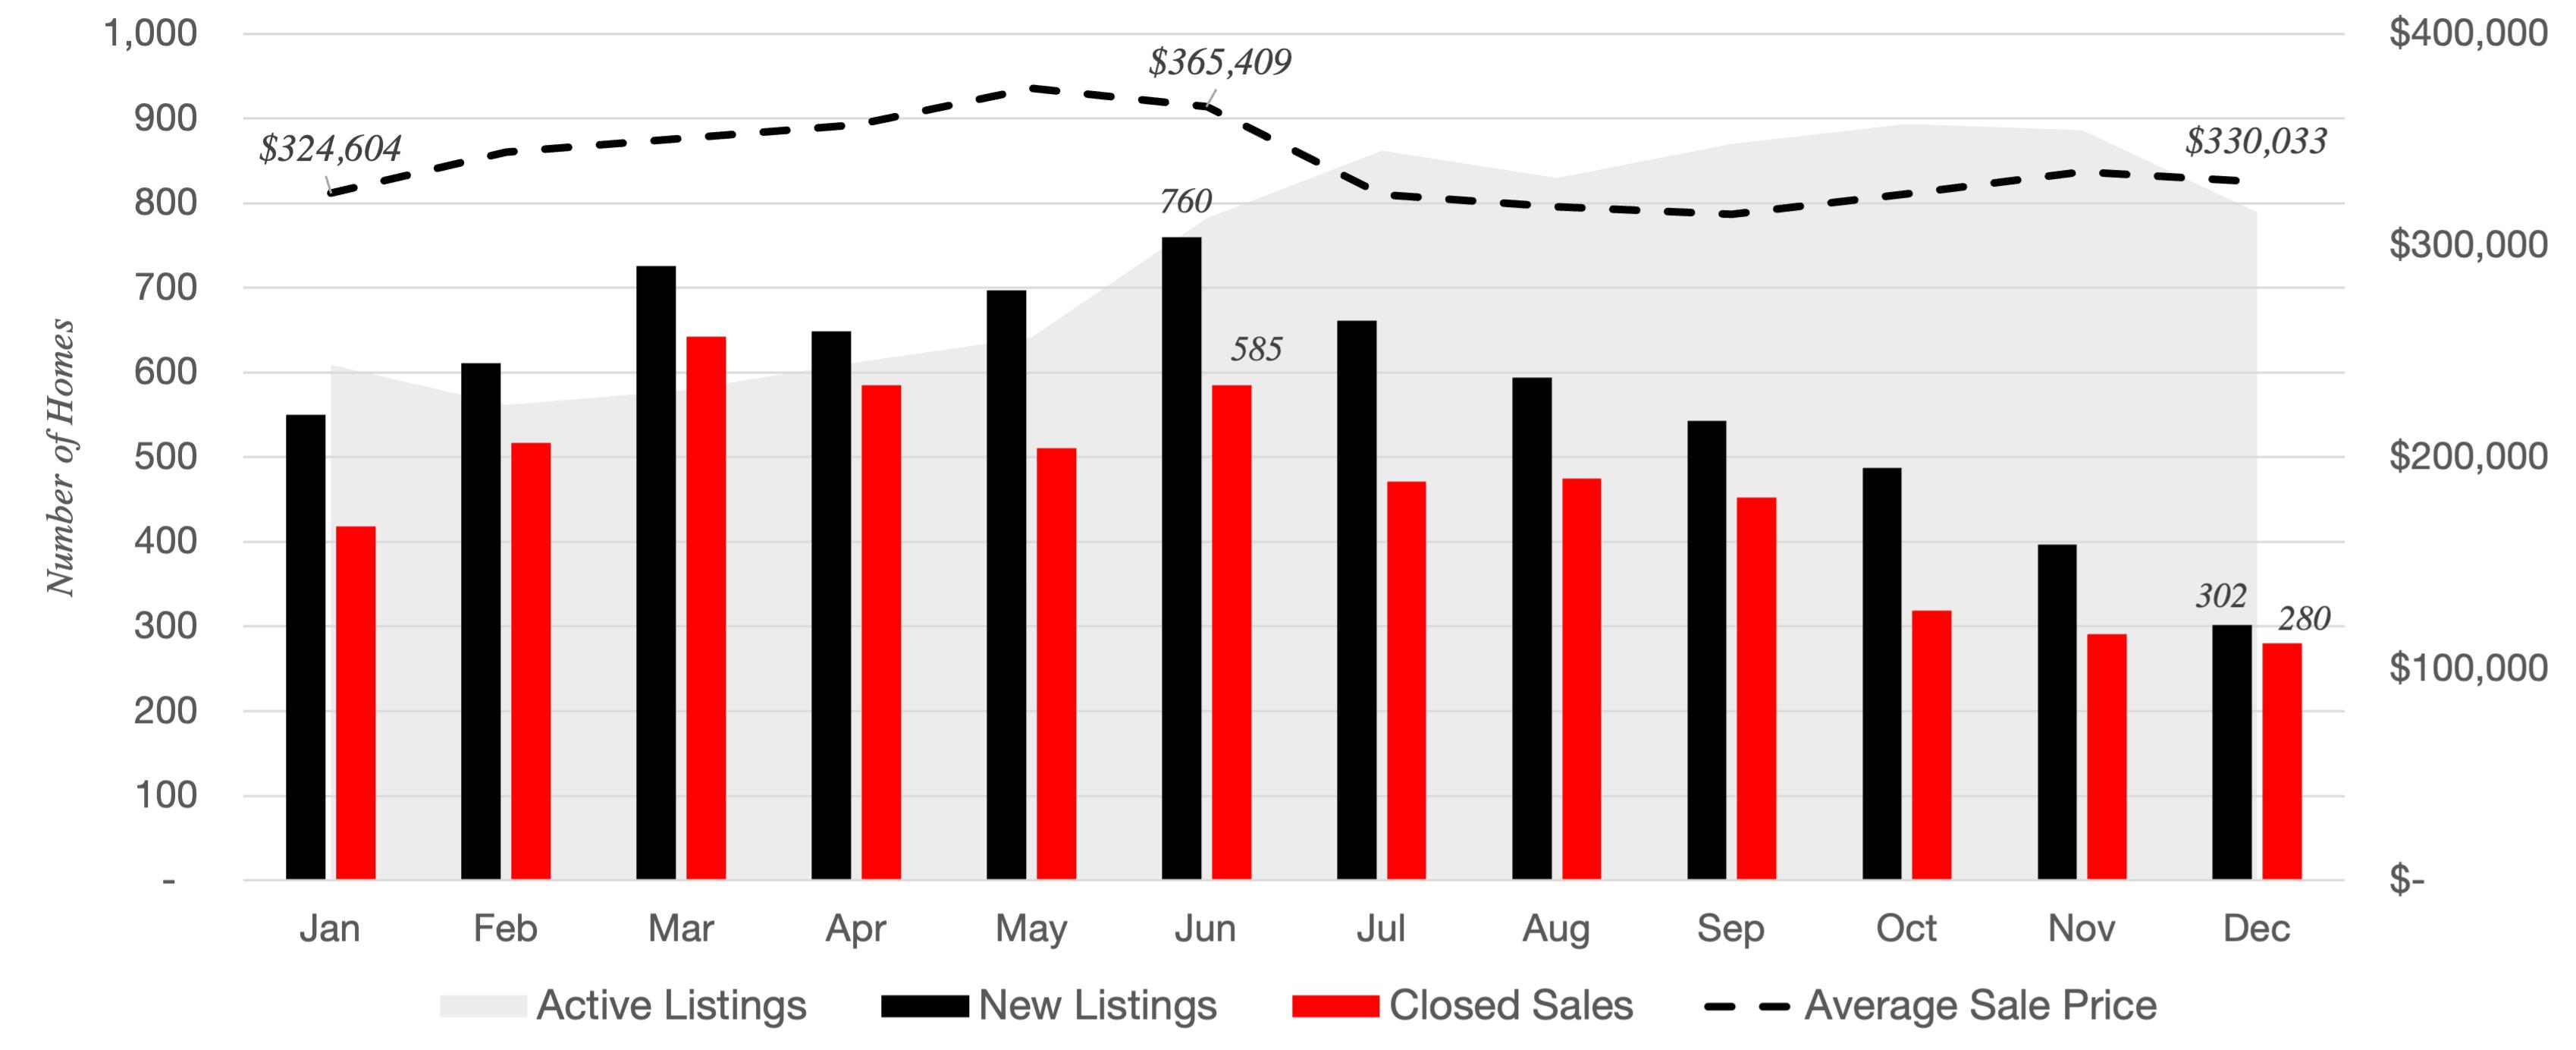
Metro Atlanta 2022 Supply Dynamics - Townhomes
Source: FMLS InfoSparks, Greater Atlanta Area, Townhomes, January to December 2022
Metro Atlanta 2022 Supply Dynamics - Condominiums
Source: FMLS InfoSparks, Greater Atlanta Area, Condominiums, January to December 2022
Metro Atlanta Market Summary by Price Point - All Home Types (Q3 & Q4 2022)
Source: FMLS InfoSparks, Greater Atlanta Area, All home types, Rolling 6-months as of December 2022 (year-over-year change com pared to rolling 6-months as of December 2021)
Metro Atlanta Market Summary by Price Point - Single-Family Homes (Q3 & Q4 2022)
Source: FMLS InfoSparks, Greater Atlanta Area, Detached Single-family homes, Rolling 6-months as of December 2022 (year-over-year change compared to rolling 6-months as of December 2021)
Metro Atlanta Market Summary by Price Point - Townhomes (Q3 & Q4 2022)
Source: FMLS InfoSparks, Greater Atlanta Area, Townhomes, Rolling 6-months as of December 2022 (year-over-year change compared to rolling 6-months as of December 2021)
Metro Atlanta Market Summary by Price Point - Condominiums (Q3 & Q4 2022)
Source: FMLS InfoSparks, Greater Atlanta Area, Condominiums, Rolling 6-months as of December 2022 (year-over-year change compared to rolling 6-months as of December 2021)