5 minute read
Transaction Volumes


Fewer people have been buying and selling homes since higher interest rates set in during summer 2022. Pending sales are a leading indicator of sales activity— typically about a month ahead of closings— and had a strong relationship to ongoing interest rate changes in 2022.
Pending sales began to decline in April, as interest rates first began to rise and more significantly in June, when they rose above 5.25%. Pending sales continued to decrease throughout most of the second half of the year, in keeping with seasonal trends accelerated by rising interest rates.
August was the only month that did not post month-over-month declines in pending sales. When interest rates dipped to 4.99% in early August, there was an uptick in transactions, with 5.4% more pending sales than July. Pending sales reached what is believed to be the low point for this cycle in November, when interest rates peaked at 7.08%.
In December, interest rates came down for six consecutive weeks and pending sales bounced slightly.28
In early January 2023, they continued to pick up. Although they were still down year-over-year (YOY), they were down 16% YOY (and just -5% compared to 2019) the third week of January, an improvement over the low point in November when pending sales were down 45% YOY,29 showing signs of buyers returning as rates stabilize. That same week, mortgage applications nationally were up 7% over the previous week, another sign of buyers getting ready to enter the spring market.30
As of the week of February 2nd, the average 30-year fixed rate mortgage rate was at 6.09%.31 With interest rates expected to land in the 5.5% to 6.5% range for most of 2023, the total number of homes sold in 2023 is expected to be lower than in 2022. Nationally, the NAR is forecasting a 7% decline in home sales for 2023 compared to 2022.32
67,095 homes were sold in all of 2022 (13% fewer than the annual average for 2017-2021)
17,345 homes were sold in Q3 (19% fewer than the average for the same period 2017-2021)
12,596 homes were sold in Q4 (32% fewer than the average for the same period 2017-2021)
7% fewer homes expected to be sold in 2023 than in 2022 according to the National Asssociation of Realtors
Which price points had the most sales?
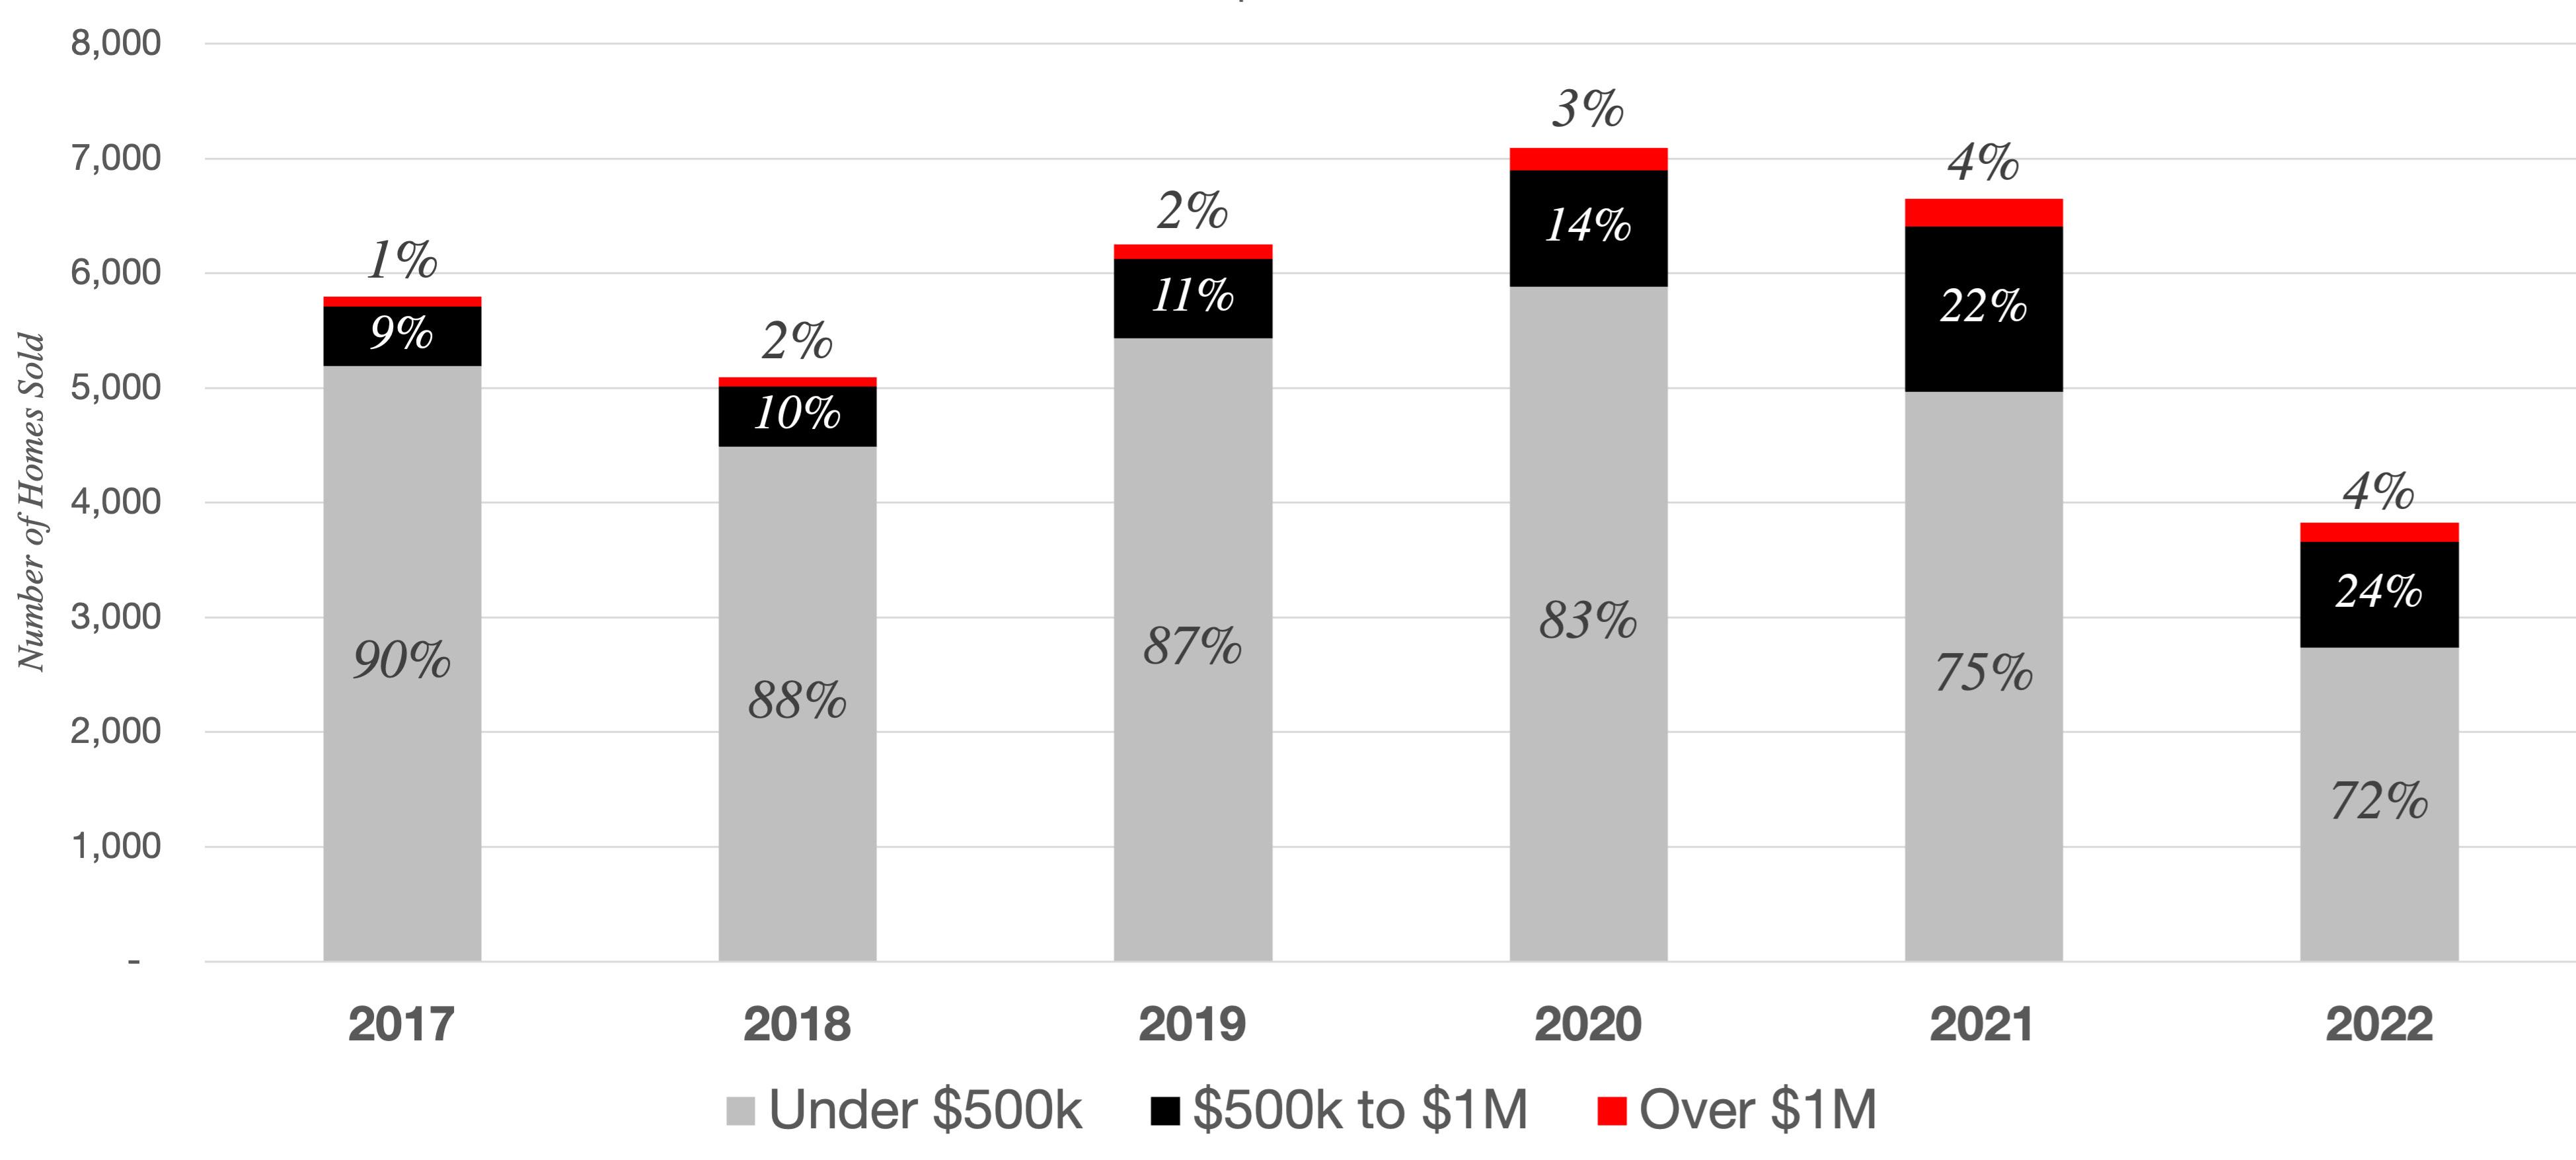
Entry level homes continue to make up the bulk of sales, but have taken the biggest hit in transaction volume declines since higher interest rates set in during summer 2022:
Entry Level (< $500,000)
Most homes sold in the Greater Atlanta Area have been under $500,000, both historically and in 2022. However, the share of homes priced under $500,000 has declined in the last several years as prices overall have risen and more homes now fall into higher price brackets. In December 2022, only 72% of homes in the Greater Atlanta Area sold for less than $500,000 compared to 90% of homes in 2017.33
In December, there were 2,739 homes sold for less than $500,000 in the Greater Atlanta area, 47% fewer sales than the average for the previous five Decembers, and down 45% compared to December 2021. This was a greater decline in transaction volume than higher price points, reflecting fewer homes for sale in this price range and potentially that entry level buyers may be more price sensitive and experiencing greater constraints from the higher mortgage rate environment.
Move-Up ($500,000 to $1 million)
Move-up buyers—those purchasing homes priced between $500,000 and $1 million, often upgrading from an entry level home—have also been affected by increased interest rates. Closed sales in this price range were down 36% yearover-year in December 2022, a less dramatic decline in sales than entry level homes. This may be in part due to rising prices, which pushed more homes into this price range.
Luxury (Over $1 million)
Luxury buyers were the least responsive to the higher interest rate environment of the past year. There was a 30% decline in closed sales for homes over $1 million in December 2022 compared to December 2021, the smallest decline of any price bracket. Even with this slower pace of sales, about twice as many homes sold for over $1 million in December 2022 as in December 2017, largely due to the overall escalation of home prices in Atlanta over the past five years.
Can Atlantans afford current home prices?
Although Atlanta remains more affordable than many major cities, continued home price growth and rising mortgage rates have led to an increased cost of homeownership that has outpaced income growth in the past few years, making it more difficult for some Atlantans to afford to buy a home and leading some buyers to consider a wider range of potential homes that fit their budgets.
Decreased affordability leads to a smaller pool of potential buyers and therefore fewer total transactions. The average sale price for a home in Metro Atlanta increased by 44% between December 2019 and December 2022.34 The typical monthly payment for the average home increased even more* due to higher interest rates. Meanwhile, the monthly take home pay for the median household increased by 11% from 2019 to 2021 (2022 data is not yet available).35
In December 2017, the monthly payment for the average priced home in the Atlanta area cost about 39% of the net monthly income for a family earning the median household income. By December 2022, a typical monthly mortgage payment for the average priced home reached 59% of the median household’s monthly budget. This increased cost has pushed some would-be buyers to wait to buy a home.
There would need to be a change in dynamics for a greater share of
Atlantans to comfortably afford home ownership— and for the number of home sales to rise signficantly— such as a reduction in mortgage interest rates, more affordable home prices, or an increase in income.
For those who are able to purchase a home, some may choose to lower their target price range to account for a higher interest rate. To meet their financial goals, some buyers today are expanding their searches to different types of homes—such as a smaller home, a townhome, or a condominium— or considering a wider range of neighborhoods, allowing them to find homes that meet their lifestyle goals while fitting their budget. Others are taking advantage of mortgage rate buydown programs to lower their initial payments, with plans to refinance at a lower rate.
* Assumptions: Annual median household income from U.S. Census American Community Survey estimates as net monthly household income (based on the ADP Gross to Net Calculator for a Georgia resident); FMLS InfoSparks average sale price (all home types) for the Greater Atlanta Area in December of each year; Average 30-year fixed rate mortgage interest rate from Freddie Mac Primary Mortgage Market Survey for the given month.
Metro Atlanta Key Housing Affordability Statistics
a) U.S. Census American Community Survey, Atlanta-Sandy Springs-Roswell MSA, 2017 to 2021 b) 2022 Median Household Income had not yet been published at t he time of this report; 2021 data shown for reference c) Net monthly income estimated using the ADP Gross to Net Calculator for a Georgia resident d) FMLS InfoSparks average sale price (all home types) for the Greater Atlanta Area in December of each year e) Freddie Mac Primary Mortgage Market Survey, average of weekly average rates for December of each year f) Assumes a 20 percent down payment and no PMI; includes estimated property taxes and insurance, but not HOA dues