ITALY
Status and main trends in the Italian fisheries sector
Production increases after years of decline Over the past few years, national seafood production has been steadily declining until 2013; in 2014, a slight increase in the quantity was recorded with a production of 325,000 tonnes of seafood. In terms of value, the negative trend continued also in 2014. This decline affects both marine fisheries and aquaculture. Molluscs are still the main product of the national aquaculture sector; the main harvest is of mussels (Mytilus galloprovincialis) and clams (Tapes philippinarum).
T
he overall production of marine fisheries in 2014 amounted to 177,000 tonnes and generated 813 million euro. In the last two years it lost an estimated 21,000 t and 121 million euro, a contraction that further weakened the sector and reduced its impact on the overall Italian economic scenario. In 2014, the trade deficit in the seafood sector amounted to 840,000 tonnes and 3,919 million euro. The deficit continues to rise due to a higher rise in imports over exports. Political instability affecting some countries bordering the Mediterranean and the challenging economic condition of several EU countries had an impact on the international seafood trade as well. Apparent consumption – calculated as the difference between
exports versus internal production and import – reached 1,166,000 tonnes in 2014. Even so, per capita consumption remains at minimal levels (18.55 €/kg in 2013 and 19,18 €/kg in 2014), far below the 20 €/kg recorded in 2005. The unfavourable state of the domestic economy and the related general decline in food consumption continues to affect seafood purchases.
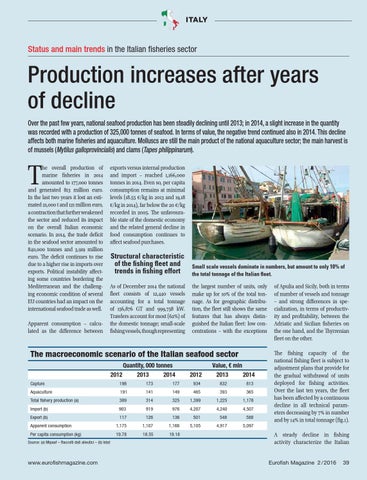
Structural characteristic of the fishing fleet and trends in fishing effort
Small scale vessels dominate in numbers, but amount to only 10% of the total tonnage of the Italian fleet.
As of December 2014 the national fleet consists of 12,440 vessels accounting for a total tonnage of 156,876 GT and 999,758 kW. Trawlers account for most (62) of the domestic tonnage; small-scale fishing vessels, though representing
the largest number of units, only make up for 10 of the total tonnage. As for geographic distribution, the fleet still shows the same features that has always distinguished the Italian fleet: low concentrations – with the exceptions
The macroeconomic scenario of the Italian seafood sector Quantity, 000 tonnes 2012
2013
2014
Value, € mln 2012
2013
2014
Capture
198
173
177
934
832
813
Aquaculture
191
141
149
465
393
365
Total fishery production (a)
389
314
325
1,399
1,225
1,178
Import (b)
903
919
976
4,207
4,240
4,507
117
126
136
501
548
588
Apparent consumption
Export (b)
1,175
1,107
1,166
5,105
4,917
5,097
Per capita consumption (kg)
19.78
18.55
19.18
Source: (a) Mipaaf – Raccolti dati alieutici – (b) Istat
www.eurofishmagazine.com
07_ITALY.indd 39
of Apulia and Sicily, both in terms of number of vessels and tonnage – and strong differences in specialization, in terms of productivity and profitability, between the Adriatic and Sicilian fisheries on the one hand, and the Thyrrenian fleet on the other. The fishing capacity of the national fishing fleet is subject to adjustment plans that provide for the gradual withdrawal of units deployed for fishing activities. Over the last ten years, the fleet has been affected by a continuous decline in all technical parameters decreasing by 7 in number and by 14 in total tonnage (fig.1). A steady decline in fishing activity characterize the Italian Eurofish Magazine 2 / 2016
39
05/04/16 11:11 AM