Estonian Fishery 2011
Basic and economic indicators of 24–40 m length class trawlers In 2011, catches were reported for 32 large vessels owned by 19 companies. These trawlers caught 51,800 tonnes of fish, whose estimated total value amounted to 9.9 million euros based on average first sales prices. Similarly to small trawlers, catches were dominated by sprat. Sprat and herring accounted for 66% and 31%, respectively, of the total catch for 2011, which means that the proportion of sprat decreased significantly compared to the preceding year (Figure 29). The number of large trawlers decreased by 11%, dropping from 36 in 2010 to 32 in 2011 (Table 19). As a result, the number of employees changed: whereas
��������
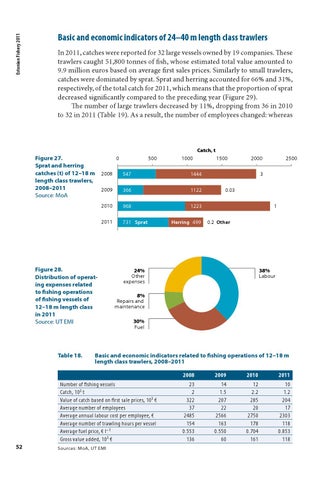
Figure 27. � Sprat and herring catches (t) of 12–18 m ���� ��� length class trawlers, 2008–2011 ���� ��� Source: MoA
����
���
����
����
����
��� �����
������� ���
����
� ����
����
� ��� �����
��� ����� ��������
��� ������
��� ����� ��������
�� ������������ �����������
��� ������������ �����������
��� ����
��� ����
Basic and economic indicators related to fishing operations of 12–18 m length class trawlers, 2008–2011
Number of fishing vessels Catch, 103 t Value of catch based on first sale prices, 103 € Average number of employees Average annual labour cost per employee, € Average number of trawling hours per vessel Average fuel price, € l–1 Gross value added, 103 € 52
���� ����
����
Figure 28. Distribution of operating expenses related to fishing operations of fishing vessels of 12–18 m length class in 2011 Source: UT EMI
Table 18.
���
Sources: MoA, UT EMI
2008
2009
2010
2011
23 2 322 37 2485 154 0.553 136
14 1.5 207 22 2566 163 0.550 60
12 2.2 285 20 2750 178 0.704 161
10 1.2 204 17 2303 118 0.853 118