CONDITIONS OF PARAQUAT USE IN INDIA
April 2015
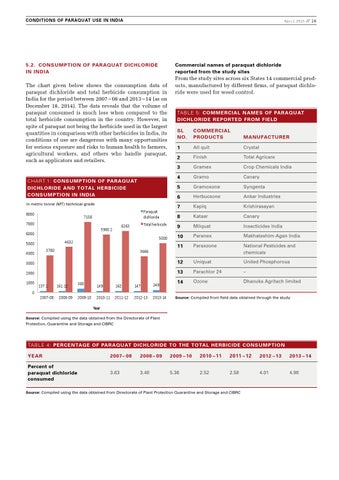
5.2. CONSUMPTION OF PARAQUAT DICHLORIDE IN INDIA
The chart given below shows the consumption data of paraquat dichloride and total herbicide consumption in India for the period between 2007 – 08 and 2013 – 14 (as on December 18, 2014). The data reveals that the volume of paraquat consumed is much less when compared to the total herbicide consumption in the country. However, in spite of paraquat not being the herbicide used in the largest quantities in comparison with other herbicides in India, its conditions of use are dangerous with many opportunities for serious exposure and risks to human health to farmers, agricultural workers, and others who handle paraquat, such as applicators and retailers.
CHART 1: CONSUMPTION OF PARAQUAT DICHLORIDE AND TOTAL HERBICIDE CONSUMPTION IN INDIA in metric tonne (MT) technical grade
8000 7000
1000 0
Metric tonne
Metric tonne
2000
4632
5000 3780
Paraquat dichloride
6263
5900.2
6000
5000
3000
7158
7000
6000
4000
7158
8000
6263
5900.2
4632
3666
3000
2000 137.1 1000
383
161.12 149 383 161.12 137.1 2007-‐0 08 2008-‐09 2009-‐10 2010-‐11
2007-‐08
2008-‐09
2009-‐10 Year
Commercial names of paraquat dichloride reported from the study sites From the study sites across six States 14 commercial products, manufactured by different firms, of paraquat dichloride were used for weed control.
TABLE 5: COMMERCIAL NAMES OF PARAQUAT DICHLORIDE REPORTED FROM FIELD SL NO.
COMMERCIAL PRODUCTS
MANUFACTURER
1
All quit
Crystal
2
Finish
Total Agricare
3
Gramex
Crop Chemicals India
4
Gramo
Canary
5
Gramoxone
Syngenta
6
Herbucsone
Ankar Industries
7
Kapiq
Krishirasayan
Kataar
Canary
Milquat
Insecticides India
Paranex
Makhateshim-Agan India
11
Paraxzone
National Pesticides and chemicals
12
Uniquat
United Phosphorous
13
Parachlor 24
–
14
Ozone
Dhanuka Agritech limited
Paraquat 8 dichloride Total herbicide 9 Total herbicide 5000 10 5000
3666
3780
4000
249
162 149 2011-‐12
147 162 2012-‐13
147 2013-‐14
249
2010-‐11
2011-‐12
2012-‐13
2013-‐14
// 16
Source: Compiled from field data obtained through the study
Year Source: Compiled using the data obtained from the Directorate of Plant Protection, Quarantine and Storage and CIBRC
TABLE 4: PERCENTAGE OF PARAQUAT DICHLORIDE TO THE TOTAL HERBICIDE CONSUMPTION YEAR
2007– 08
2008 – 09
2009 – 1 0
2010 – 1 1
2011 – 1 2
2012 – 1 3
2013 – 1 4
Percent of paraquat dichloride consumed
3.63
3.48
5.36
2.52
2.58
4.01
4.98
Source: Compiled using the data obtained from Directorate of Plant Protection Quarantine and Storage and CIBRC