IT’S IN THE CAN
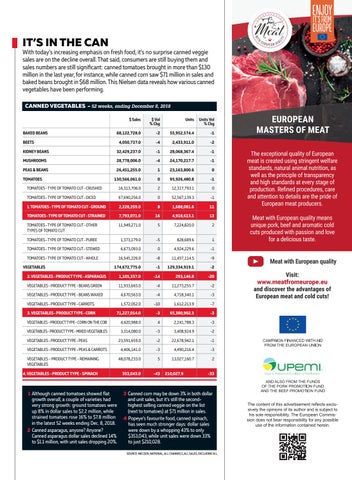
With today’s increasing emphasis on fresh food, it’s no surprise canned veggie sales are on the decline overall. That said, consumers are still buying them and sales numbers are still significant: canned tomatoes brought in more than $130 million in the last year, for instance, while canned corn saw $71 million in sales and baked beans brought in $68 million. This Nielsen data reveals how various canned vegetables have been performing. CANNED VEGETABLES - 52 weeks, ending December 8, 2018 $ Sales
$ Vol % Chg
Units
68,122,728.0
-2
55,952,574.4
-1
4,050,737.0
-4
2,433,911.0
-2
KIDNEY BEANS
32,429,237.0
-1
28,068,367.4
-1
MUSHROOMS
28,778,006.0
-4
24,170,217.7
-1
BAKED BEANS BEETS
PEAS & BEANS
Units Vol % Chg
26,451,255.0
1
23,163,800.6
0
130,566,061.0
0
95,926,480.8
-1
TOMATOES - TYPE OF TOMATO CUT - CRUSHED
16,313,706.0
2
12,317,793.1
0
TOMATOES
TOMATOES - TYPE OF TOMATO CUT - DICED
67,690,256.0
0
52,567,139.3
-1
1. TOMATOES - TYPE OF TOMATO CUT - GROUND
2,228,259.0
8
1,688,081.6
11
TOMATOES - TYPE OF TOMATO CUT - STRAINED
7,793,071.0
16
4,918,613.1
13
TOMATOES - TYPE OF TOMATO CUT - OTHER TYPES OF TOMATO CUT
11,949,271.0
5
7,224,820.0
2
TOMATOES - TYPE OF TOMATO CUT - PUREE
1,373,179.0
-5
828,689.6
1
TOMATOES - TYPE OF TOMATO CUT - STEWED
6,673,093.0
0
4,924,229.6
-1
TOMATOES - TYPE OF TOMATO CUT - WHOLE
16,545,226.0
-8
11,457,114.5
-9
174,672,775.0
-1
129,334,919.1
-2
2. VEGETABLES - PRODUCT TYPE - ASPARAGUS
1,105,337.0
-14
293,146.8
-20
VEGETABLES - PRODUCT TYPE - BEANS GREEN
11,933,665.0
-4
11,273,255.7
-2
VEGETABLES - PRODUCT TYPE - BEANS WAXED
4,670,563.0
-4
4,718,340.1
-3
VEGETABLES - PRODUCT TYPE - CARROTS
1,572,052.0
-10
1,612,213.9
-7
3. VEGETABLES - PRODUCT TYPE - CORN
71,227,014.0
-3
65,380,902.3
-3
4,420,988.0
4
2,241,788.3
-3
VEGETABLES
VEGETABLES - PRODUCT TYPE - CORN ON THE COB VEGETABLES - PRODUCT TYPE - MIXED VEGETABLES
3,314,080.0
-3
3,408,924.9
-2
23,591,659.0
-2
22,678,942.1
-1
4,406,141.0
-3
4,490,216.4
-3
VEGETABLES - PRODUCT TYPE - REMAINING VEGETABLES
48,078,233.0
5
13,027,160.7
2
4. VEGETABLES - PRODUCT TYPE - SPINACH
353,043.0
-43
VEGETABLES - PRODUCT TYPE - PEAS VEGETABLES - PRODUCT TYPE - PEAS & CARROTS
1 Although canned tomatoes showed flat growth overall, a couple of varieties had very strong growth: ground tomatoes were up 8% in dollar sales to $2.2 million, while strained tomatoes rose 16% to $7.8 million in the latest 52 weeks ending Dec. 8, 2018. 2 Canned asparagus, anyone? Anyone? Canned asparagus dollar sales declined 14% to $1.1 million, with unit sales dropping 20%.
210,027.9
-33
3 Canned corn may be down 3% in both dollar and unit sales, but it’s still the secondhighest selling canned veggie on the list (next to tomatoes) at $71 million in sales. 4 Popeye’s favourite food, canned spinach, has seen much stronger days: dollar sales were down by a whopping 43% to only $353,043, while unit sales were down 33% to just $210,028. SOURCE: NIELSEN, NATIONAL, ALL CHANNELS, ALL SALES, EXCLUDING N.L.