SCALES OF PROJECTION: URBAN BIODIVERSITY IN MALAYSIA VISION VALLEY
1 10 100 1000 10000 100000 1000000
010000000
10000000
indissoluble whole, in which all parts are interconnected, both among themselves and 020000000
030000000
040000000
with the inert medium of the biosphere.”i
020000000
020000000
010000000
indivisible and
010000000
100000000
“Life presents an
030000000
030000000
Kuala Lumpur
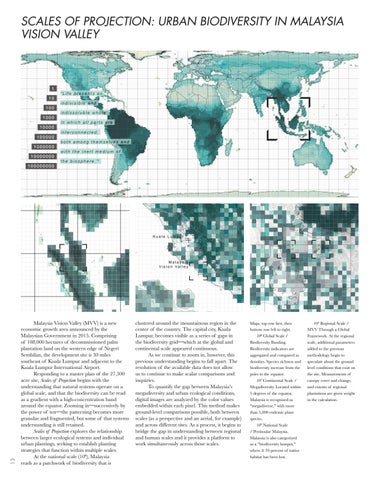
Malaysia Vision Valley (MVV) is a new economic growth area announced by the Malaysian Government in 2015. Comprising of 108,000 hectares of decommissioned palm plantation land on the western edge of Negeri Sembilan, the development site is 30 miles southeast of Kuala Lumpur and adjacent to the Kuala Lumpur International Airport. 1 0 7of the 27,300 Responding to a master plan acre site, Scales of Projection begins with the understanding that natural systems operate on a global scale, and that the biodiversity can be read as a gradient with a high-concentration band around the equator. Zooming in—successively by the power of ten—the patterning becomes more granular and fragmented, but some of that systems understanding is still retained. Scales of Projection explores the relationship between larger ecological systems and individual urban plantings, seeking to establish planting strategies that function within multiple scales. At the national scale (106), Malaysia reads as a patchwork of biodiversity that is 010000000
0
020000000
030000000
Megadiversity
clustered around the mountainous region in the center of the country. The capital city, Kuala Lumpur, becomes visible as a series of gaps in the biodiversity grid—which at the global and continental scale appeared continuous. As we continue to zoom in, however, this previous understanding begins to fall apart. The resolution of the available data does not allow us to continue to make scalar comparisons and inquiries. To quantify the gap between Malaysia’s megadiversity and urban ecological conditions, digital images are analyzed by the color values embedded within each pixel. This method makes ground-level comparisons possible, both between scales (as a perspective and an aerial, for example) and across different sites. As a process, it begins to bridge the gap in understanding between regional and human scales and it provides a platform to work simultaneously across those scales. 050000000
050000000
040000000
040000000
Malaysia V i s i o n Va l l e y
040000000
L o c a t e d w i t h i n 5 d e g r e e s o f t h e e q u a t o r, M a l a y s i a ’s l o c a t i o n p l a c e s i t h i g h o n t h e l a t i t u d i n a l diversity gradient (LDG). Malaysia and neighboring Indonesia are both recognized as “megadiverse”. E a c h c o u n t r y h a s m o r e t h a n 5 , 0 0 0 e n d e m i c p l a n t s p e c i e s . H o w e v e r, b o t h c o u n t r i e s a r e a l s o categorized as “biodiversity hotspots”, where ≥ 70% of original native habitat has been lost.
13
I N T E R FA C E : C o n s t r u c t i n g t h e E d g e o f M a l a y s i a V i s i o n Va l l e y Southeast Asia Regional Context | 0°1’2.44” N, 155°0’50.81” E
0
100
250
500
Biodiversity
L
H
Elevation
L
H
1,000 km
1:10,000,000
Emily Louise Allen
Maps, top row first, then 105 Regional Scale / bottom row left to right. MVV Through a Global 108 Global Scale / Framework. At the regional Biodiversity Banding. scale, additional parameters Biodiversity indicators are added to the previous aggregated and compared as methodology begin to densities. Species richness and speculate about the ground biodiversity increase 1 0 5 R e gfrom i o n a l U nthe d e r s t a n d i nlevel g t h r o u conditions g h G l o b a l F r a m ethat w o r k exist on poles to the equator. the site. Measurements of 107 Continental Scale / canopy cover and change, Megadiversity. Located within and extents of regional 5 degrees of the equator, plantations are given weight Malaysia is recognized as in the calculation. “megadiverse,” with more than 5,000 endemic plant species. 106 National Scale / Peninsular Malaysia. Malaysia is also categorized as a “biodiversity hotspot,” where ≥ 70 percent of native habitat has been lost. At the regional scale, additional parameters are added to the previous methodology in order to begin to speculate about the ground level conditions that exist on the site. In addition to biodiversity indicators, measurements of canopy cover and change and extents of regional plantations are given weight in the calculation.
I N T E R FA C E : C o n s t r u c t i n g t h e E d g e o f M a l a y s i a V i s i o n Va l l e y MVV Region | 2°41’36.46”N, 101°48’32.33”E
0
1
5
10 km
1:100,000