station East was higher than on city streets with heavy traffic in the main working hours (6-22).
% of the particle number at station B4 and approximately 70 % at stations East and West. This particle fraction is the main reason why the number of ultra-
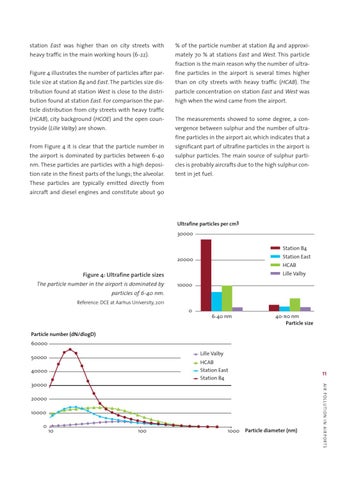
Figure 4 illustrates the number of particles after par-
fine particles in the airport is several times higher
ticle size at station B4 and East. The particles size dis-
than on city streets with heavy traffic (HCAB). The
tribution found at station West is close to the distri-
particle concentration on station East and West was
bution found at station East. For comparison the par-
high when the wind came from the airport.
ticle distribution from city streets with heavy traffic (HCAB), city background (HCOE) and the open coun-
The measurements showed to some degree, a con-
tryside (Lille Valby) are shown.
vergence between sulphur and the number of ultrafine particles in the airport air, which indicates that a
From Figure 4 it is clear that the particle number in
significant part of ultrafine particles in the airport is
the airport is dominated by particles between 6-40
sulphur particles. The main source of sulphur parti-
nm. These particles are particles with a high deposi-
cles is probably aircrafts due to the high sulphur con-
tion rate in the finest parts of the lungs; the alveolar.
tent in jet fuel.
These particles are typically emitted directly from aircraft and diesel engines and constitute about 90
Ultrafine particles per cm3 30000 Station B4 Station East
20000
HCAB Lille Valby
Figure 4: Ultrafine particle sizes The particle number in the airport is dominated by
10000
particles of 6-40 nm. Reference: DCE at Aarhus University, 2011
0 6-40 nm
40-110 nm Particle size
Particle number (dN/dlogD) 60000 Lille Valby
50000
HCAB Station East Station B4
40000
11
20000 10000 0
10
100
1000
Particle diameter (nm)
A I R P O L L U T I O N I N A I R P O RTS
30000