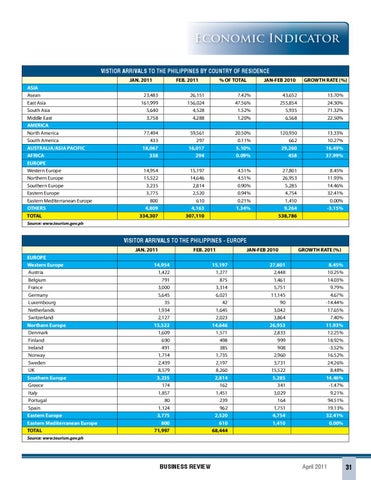
Economic Indicator VISTIOR ARRIVALS TO THE PHILIPPINES BY COUNTRY OF RESIDENCE JAN. 2011 ASIA Asean East Asia South Asia Middle East AMERICA North America South America AUSTRALIA/ASIA PACIFIC AFRICA EUROPE Western Europe Northern Europe Southern Europe Eastern Europe Eastern Mediterranean Europe OTHERS TOTAL
FEB. 2011
% OF TOTAL
JAN-FEB 2010
GROWTH RATE (%)
23,483 161,999 5,640 3,758
26,151 156,024 4,528 4,288
7.42% 47.56% 1.52% 1.20%
43,652 255,854 5,935 6,568
13.70% 24.30% 71.32% 22.50%
77,494 433 18,067 338
59,561 297 16,017 294
20.50% 0.11% 5.10% 0.09%
120,930 662 29,260 458
13.33% 10.27% 16.49% 37.99%
14,954 15,522 3,235 3,775 800 4,809 334,307
15,197 14,646 2,814 2,520 610 4,163 307,110
4.51% 4.51% 0.90% 0.94% 0.21% 1.34%
27,801 26,953 5,285 4,754 1,410 9,264 538,786
8.45% 11.93% 14.46% 32.41% 0.00% -3.15%
Source: www.tourism.gov.ph
VISITOR ARRIVALS TO THE PHILIPPINES - EUROPE JAN. 2011 EUROPE Western Europe Austria Belgium France Germany Luxembourg Netherlands Switzerland Northern Europe Denmark Finland Ireland Norway Sweden UK Southern Europe Greece Italy Portugal Spain Eastern Europe Eastern Mediterranean Europe TOTAL
FEB. 2011
14,954 1,422 791 3,000 5,645 35 1,934 2,127 15,522 1,609 690 491 1,714 2,439 8,579 3,235 174 1,857 80 1,124 3,775 800 71,997
15,197 1,277 875 3,314 6,021 42 1,645 2,023 14,646 1,571 498 385 1,735 2,197 8,260 2,814 162 1,451 239 962 2,520 610 68,444
JAN-FEB 2010 27,801 2,448 1,461 5,751 11,145 90 3,042 3,864 26,953 2,833 999 908 2,960 3,731 15,522 5,285 341 3,029 164 1,751 4,754 1,410
GROWTH RATE (%) 8.45% 10.25% 14.03% 9.79% 4.67% -14.44% 17.65% 7.40% 11.93% 12.25% 18.92% -3.52% 16.52% 24.26% 8.48% 14.46% -1.47% 9.21% 94.51% 19.13% 32.41% 0.00%
Source: www.tourism.gov.ph
BUSINESS REVIEW
April 2011
31