emissions reductions who’s doing what?
worst case
6000
mtco2e in 2020
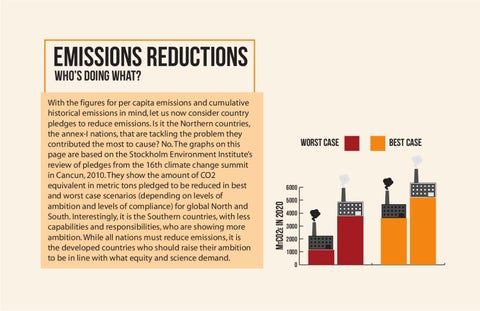
With the figures for per capita emissions and cumulative historical emissions in mind, let us now consider country pledges to reduce emissions. Is it the Northern countries, the annex-I nations, that are tackling the problem they contributed the most to cause? No. The graphs on this page are based on the Stockholm Environment Institute’s review of pledges from the 16th climate change summit in Cancun, 2010. They show the amount of CO2 equivalent in metric tons pledged to be reduced in best and worst case scenarios (depending on levels of ambition and levels of compliance) for global North and South. Interestingly, it is the Southern countries, with less capabilities and responsibilities, who are showing more ambition. While all nations must reduce emissions, it is the developed countries who should raise their ambition to be in line with what equity and science demand.
5000 4000 3000 2000 1000 0
best case