8 minute read
PROBLEM ONE: OPERATIONS AND MAINTENANCE ARE INSUFFICENT


OPERATIONS AND MAINTENANCE ARE INSUFFICENT
Across the United States, public transportation has focused on the creation of new infrastructure as opposed to improvements, maintenance and the frequency, reliability and speed of transit service. The sorry state of public transit in the United States has worsened social mobility and further exacerbated class divides. Public transportation has been stigmatized and under funded ensuring that service is not fast, efficient, or frequent. How can we envision a Green New Deal for Transportation that makes public transit a more reliable, efficient, and fast form of transportation?
Advertisement
Frequency and passenger perception of public transport unreliability pose the biggest barriers to public transportation
ridership. As renowned transit consultant, Jarret Walker says, “frequency is freedom.” The difference between transit that runs every thirty minutes and one that runs every 10 minutes means the difference between planning your life around a transit schedule and one in which you can make a spontaneous decision to leave. According to a study conducted by researchers at the University of California, Berkeley, the strongest influence on transit use reduction comes from experiencing delays due to operational problems. 15 Late buses, overcrowded vehicles, and missed transfers count as unreliable in the eyes of transit users. Even infrequently scheduled service may be perceived as unreliable by passengers, even if vehicles are operating on time, simply due to the large gaps between departures and passengers’ lack of knowledge of the scheduled frequency. 16
Infrequent transit hurts the most vulnerable in society and reduces the opportunity for social mobility.
When we discuss the implications of a Green New Deal for Transportation, we must consider a systems-thinking approach and that means thinking about the importance of equity in how our public transportation system is set up. According to Harvard’s Equality of Opportunity project, a long commute is one of the biggest barriers to escaping poverty. 17 When many public agencies that deliver transit service are run by board members who never use their own service, the hypocrisy is not lost on anyone, that outdated stereotypes and antiquated ideas take precedence when planning for transportation in the United States. Philadelphia, Pennsylvania, one of the poorest large cities in the country and a majority minority city, falls victim to this trend as well, with only one board member
12
commuting to work on Southeastern Pennsylvania Transportation Authority (SEPTA’s) expansive public transit network. 18
In addition to frequency, the speed of service impacts the perception of
transit reliability for users. According to the 2019 report released by INRIX Inc. a transportation analytics company based in Washington, Philadelphia had the thirdworst congestion among American cities after Boston and Chicago. 19 On average, Philadelphia drivers spent 112 hours in congestion last year at a cost of $1,568 per person. This congestion has impacted bus speeds as well. In Philadelphia, bus speeds fell every year from 2014 to 2017, and most buses travel below 12 mph. 20 In theory, transit agencies plan bus schedules to account for delays due to congestion or other, however according to Simon Berrebi, a postdoctoral fellow at Georgia Tech and expert on bus bunching, said he frequently sees bus routes that are so unreliable that some days they run the route in 30 minutes and on bad days, take 80 minutes. 21 Transit delays are also not uncommon on subways and trolleys when old train cars break down, leading to back-ups on other parts of the line causing delays. Average vehicle speeds have decreased at most transit agencies since 2012, according to the National Transit Database. 22
Rather than focusing on reliability, public transit in the United States has mostly been concerned with building and expansion of transit rather than maintenance of the
current service. 23 Following the 2008 economic recession, the Obama Administration approved the Recovery Act which included $48.1 billion for roads and transit. 24 While this seemed promising, the problem was that those funds were dedicated almost exclusively to new investments instead of supplementing existing operating funds. During this time, even while states and cities were laying train tracks and buying new buses, they were also being forced to cut bus routes and raise subway fares. Overall, American cities added more than 1,200 miles of new and expanded transit lines between 2010 and 2019, spending more than $47 billion in 2019 dollars to do so. 25 A total of about $3.6 billion was spent on new bus expansion projects over this period meaning the average American contributed just $1.10 in tax dollars annually to the construction of facilities for new or expanded quality bus lines, out of a total of about $14.50 every year on transportation expansion overall. 26
Ending the continuous expansion of the roadway network is an essential element of any effort to reduce the carbon footprint of transportation, slow the growth in driving, and
incentivize public transport. Instead of focusing on expansion, Philadelphia and the United States should focus on repair and maintenance projects to improve the frequency, speed and reliability of transit. In its most recent “conditions and performance report,” the U.S. Department of Transportation estimates a national transit maintenance backlog of approximately $99 billion worth of projects in need of repair. 27
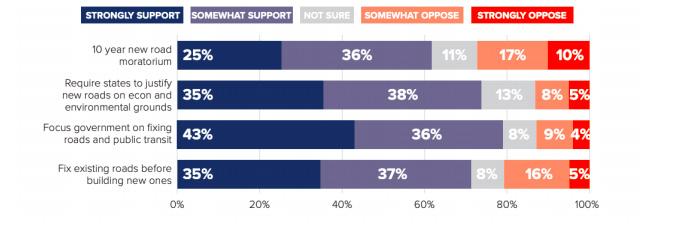
A November 2019 national poll found strong support for prioritizing repair road projects before building new roads, with only 3% separating Democrats, Independents and Republicans—and 61% supporting an outright moratorium on new roads for 10 years as a means of reorienting toward repairing infrastructure. 28 That same poll also found that voters from across the political spectrum and from urban, suburban, and rural areas overwhelmingly believe more transit would benefit the country. 29 Maintenance has been relegated to last priority since antiquated rules have dominated how transit funding gets
allocated. The U.S. has funded transportation based on the principle that the user pays for the infrastructure through a fee, the gas tax, which has funded the Highway Trust Fund since 1956. The “80-20 split” in transportation has continued to be the norm, with highways receiving 80% of the

funds and transit receiving 20% since 1982 when Congress struck a deal to raise the gas tax, but 1 cent of the 5 cent increase would be dedicated to transit, with the remaining spent on highways. 30 However, our transportation dollars are no longer based on a user fee paid by drivers, yet this funding divide still persists. Even with Obama’s Recovery Act in 2009, deficit funding came from the general fund, not from gas tax fees
14
As we face a pandemic which threatens the financial viability of each city’s transit agency, the crisis also highlights the greater need to
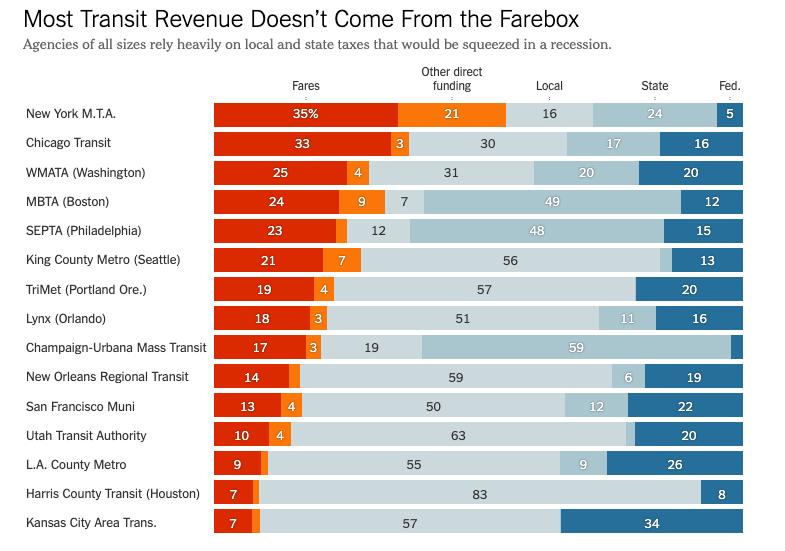
invest in public transit. Each city and state differs in how it’s transit agency receives the bulk of its budget. In Illinois, transit agencies rely on sales taxes that will dwindle as housing spending decreases. Portland, Oregan payroll taxes fund transit, which will decline as unemployment rises. In San Francisco, the transit system gets almost twice as much revenue in parking fees and

2016 Funding Sources for Transit Operations
fines as it does from transit fares. 31 As the economy lags and transit agencies struggle to cover the costs, the role of the government plays an even greater role. The recently passed $2 trillion CARES Act which includes $25 billion in direct, emergency assistance for transit is more than double what the federal government usually spends on transit in a year. 32 This offers up an opportunity to
invest in maintenance and operations using typically limited federal funds, in order to improve frequency, speed of service and reliability.
By investing in maintenance, current public transit networks can improve, increasing ridership loyalty through a renewed, better service and create new jobs in a time of high
unemployment. While expansion projects require more funding, maintenance creates 16% more jobs per dollar compared to roadway expansion. 33 If the American Reinvestment and Recovery Act (ARRA, commonly known as “the stimulus”) of 2009 is any model, each dollar spent on public transportation produced 70% more job hours than an ARRA dollar spent on highways. 34 According to the American Public Transit Association (APTA), the necessary public investments in transit systems could support millions of construction and operations jobs and catalyze nearly $1 trillion in economic activity during the next 20 years. 35